The main category of Forex News.
You can use the search box below to find what you need.
[wd_asp id=1]
The main category of Forex News.
You can use the search box below to find what you need.
[wd_asp id=1]
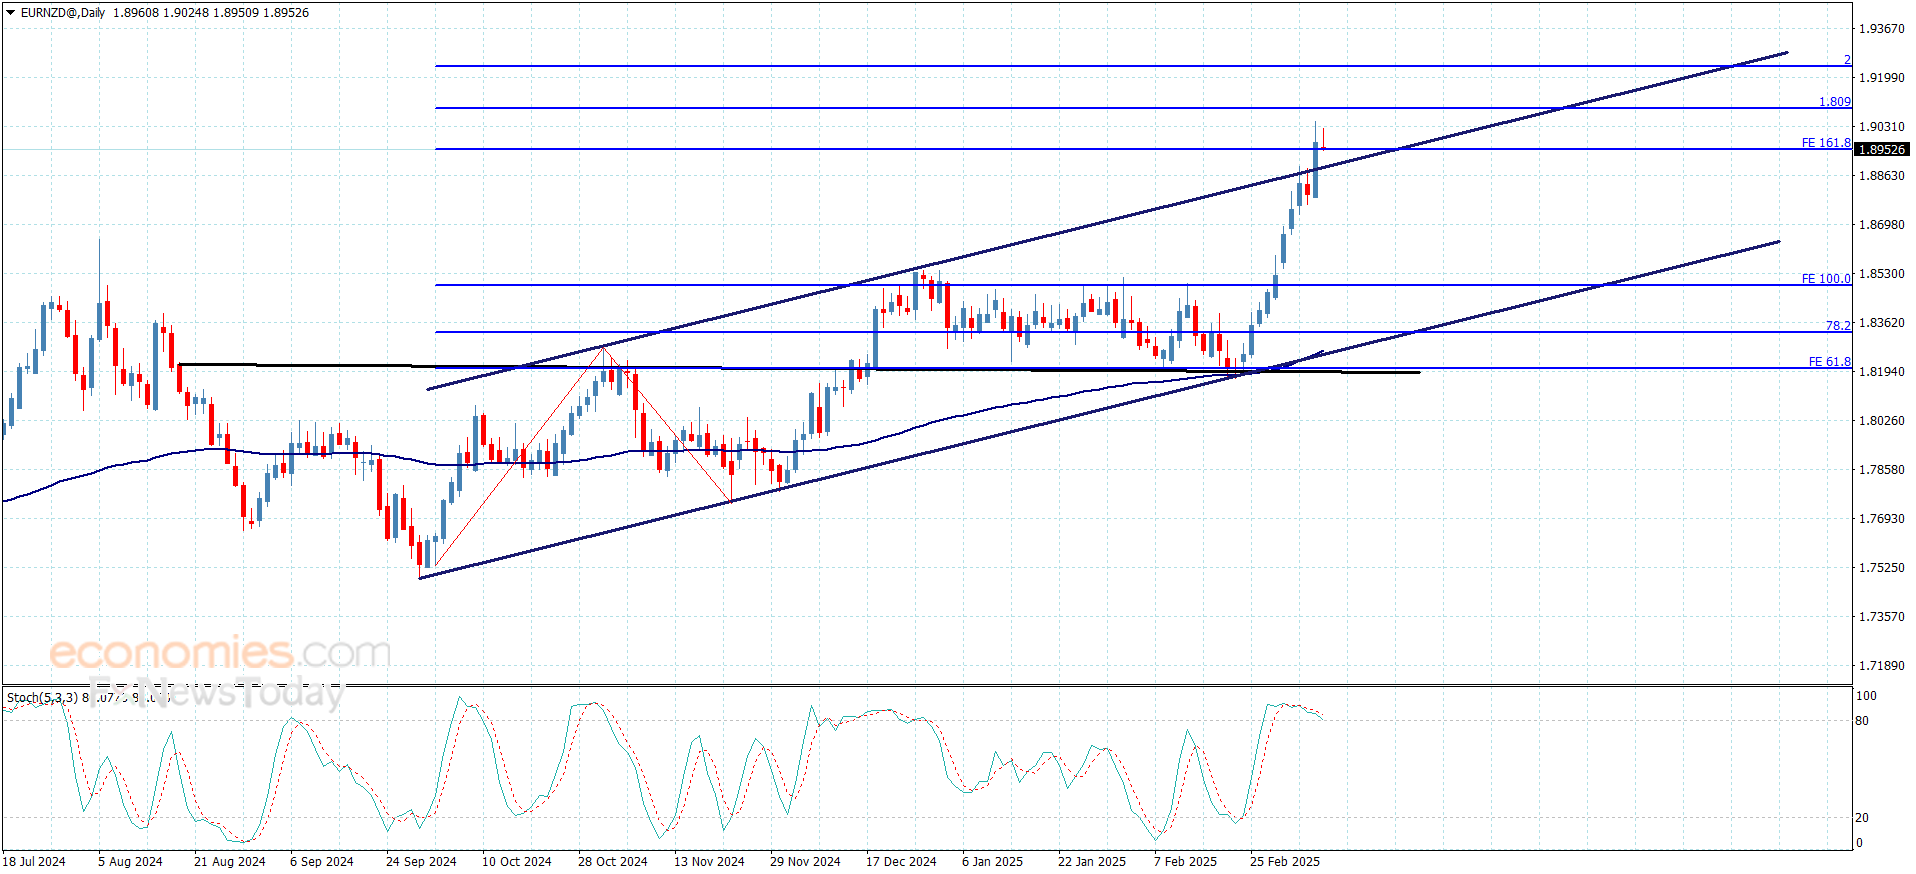
The EURNZD price formed strong bullish rally on last Friday to surpass the bullish channel’s resistance line at 1.8880, achieving big gains by reaching 1.9050, while the current sideways fluctuation is caused by stochastic attempt to exit the overbought areas, to keep waiting to gather the additional positive momentum soon followed by starting to target new positive stations that might extend towards 1.9090 followed by reaching 1.230.
Note that declining below the breached resistance will postpone the bullish attack for now to start activating the correctional bearish track before reaching the suggested targets.
The expected trading range for today is between 1.8900 and 1.9100
Trend forecast: Bullish
EUR/USD gained more than 4% in the previous week and touched its highest level since early November near 1.0890 on Friday. The pair stays relatively quiet and fluctuates in a tight channel above 1.0800 in the early European session on Monday.
The table below shows the percentage change of Euro (EUR) against listed major currencies last 7 days. Euro was the strongest against the US Dollar.
| USD | EUR | GBP | JPY | CAD | AUD | NZD | CHF | |
|---|---|---|---|---|---|---|---|---|
| USD | -4.11% | -2.46% | -1.99% | -0.62% | -1.82% | -2.30% | -2.55% | |
| EUR | 4.11% | 1.60% | 2.00% | 3.45% | 2.29% | 1.70% | 1.45% | |
| GBP | 2.46% | -1.60% | 0.51% | 1.82% | 0.68% | 0.09% | -0.15% | |
| JPY | 1.99% | -2.00% | -0.51% | 1.61% | 0.21% | -0.28% | -0.59% | |
| CAD | 0.62% | -3.45% | -1.82% | -1.61% | -1.06% | -1.69% | -1.94% | |
| AUD | 1.82% | -2.29% | -0.68% | -0.21% | 1.06% | -0.58% | -0.82% | |
| NZD | 2.30% | -1.70% | -0.09% | 0.28% | 1.69% | 0.58% | -0.25% | |
| CHF | 2.55% | -1.45% | 0.15% | 0.59% | 1.94% | 0.82% | 0.25% |
The heat map shows percentage changes of major currencies against each other. The base currency is picked from the left column, while the quote currency is picked from the top row. For example, if you pick the Euro from the left column and move along the horizontal line to the US Dollar, the percentage change displayed in the box will represent EUR (base)/USD (quote).
The US Dollar (USD) remained under heavy selling pressure last week as the disappointing macroeconomic data releases, in addition to US President Donald Trump’s tariff decisions, fed into fears over an economic downturn in the US.
The data published by the US Bureau of Labor Statistics showed on Friday that Nonfarm Payrolls rose by 151,000 in February. This reading missed the market expectation for an increase of 160,000. Other details of the employment report showed that the Unemployment Rate edged higher to 4.1% from 4% in January, while the annual wage inflation rose to 4% from 3.9% in the same period. Later in the day, Federal Reserve (Fed) Chairman Jerome Powell said that the uncertainty around the Trump administration’s policies are high. Powell reiterated that they can maintain policy restraint for longer if inflation progress stalls, or that they can ease the policy if the labor market unexpectedly weakens. These comments failed to trigger a market reaction and allowed EUR/USD to stabilize in the upper half of its weekly range.
The Fed will be in the blackout period this week. On Wednesday, February Consumer Price Index (CPI) will be featured in the US economic calendar.
Meanwhile, US stock index futures were last seen losing between 0.4% and 0.6%. Although a bearish action in Wall Street could help the USD find demand, investors could refrain from betting on a steady recovery in the currency.
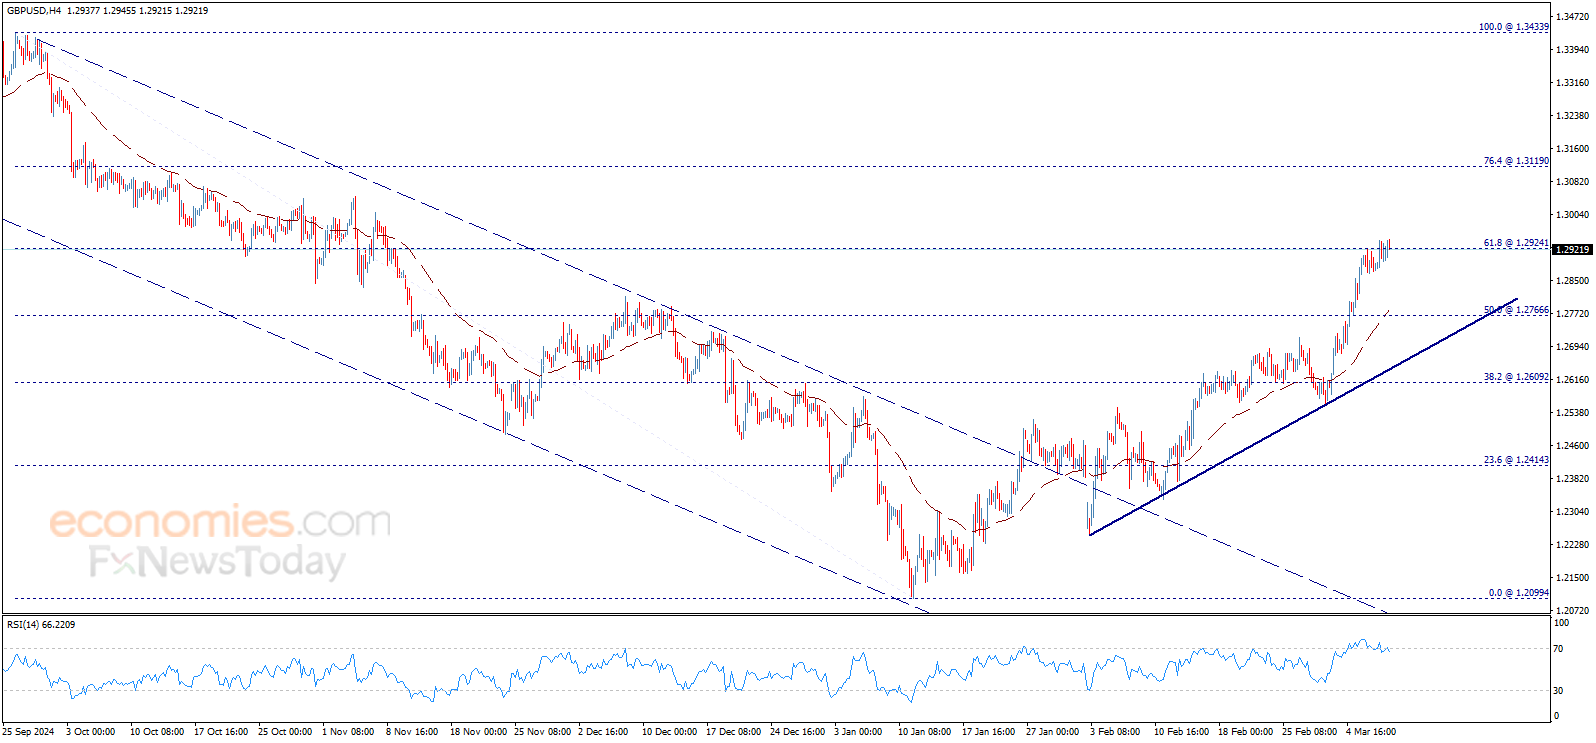
The Relative Strength Index (RSI) indicator on the four-hour chart retreated slightly below 70, suggesting that the bullish bias remains intact following a technical correction. On the downside, 1.0800 (static level, 20-period Simple Moving Average (SMA), round level) aligns as first support before 1.0760 (static level) and 1.0730 (200-day SMA).
Looking north, first resistance could be spotted at 1.0870 (200-week SMA) ahead of 1.0900 (round level, static level) and 1.0940 (static level).
The Euro is the currency for the 19 European Union countries that belong to the Eurozone. It is the second most heavily traded currency in the world behind the US Dollar. In 2022, it accounted for 31% of all foreign exchange transactions, with an average daily turnover of over $2.2 trillion a day. EUR/USD is the most heavily traded currency pair in the world, accounting for an estimated 30% off all transactions, followed by EUR/JPY (4%), EUR/GBP (3%) and EUR/AUD (2%).
The European Central Bank (ECB) in Frankfurt, Germany, is the reserve bank for the Eurozone. The ECB sets interest rates and manages monetary policy. The ECB’s primary mandate is to maintain price stability, which means either controlling inflation or stimulating growth. Its primary tool is the raising or lowering of interest rates. Relatively high interest rates – or the expectation of higher rates – will usually benefit the Euro and vice versa. The ECB Governing Council makes monetary policy decisions at meetings held eight times a year. Decisions are made by heads of the Eurozone national banks and six permanent members, including the President of the ECB, Christine Lagarde.
Eurozone inflation data, measured by the Harmonized Index of Consumer Prices (HICP), is an important econometric for the Euro. If inflation rises more than expected, especially if above the ECB’s 2% target, it obliges the ECB to raise interest rates to bring it back under control. Relatively high interest rates compared to its counterparts will usually benefit the Euro, as it makes the region more attractive as a place for global investors to park their money.
Data releases gauge the health of the economy and can impact on the Euro. Indicators such as GDP, Manufacturing and Services PMIs, employment, and consumer sentiment surveys can all influence the direction of the single currency. A strong economy is good for the Euro. Not only does it attract more foreign investment but it may encourage the ECB to put up interest rates, which will directly strengthen the Euro. Otherwise, if economic data is weak, the Euro is likely to fall. Economic data for the four largest economies in the euro area (Germany, France, Italy and Spain) are especially significant, as they account for 75% of the Eurozone’s economy.
Another significant data release for the Euro is the Trade Balance. This indicator measures the difference between what a country earns from its exports and what it spends on imports over a given period. If a country produces highly sought after exports then its currency will gain in value purely from the extra demand created from foreign buyers seeking to purchase these goods. Therefore, a positive net Trade Balance strengthens a currency and vice versa for a negative balance.
(This story was corrected on March 10 at 09:48 GMT to say that the annual wage inflation in the US rose to 4% from 3.9%, not 4.9%.)
Despite copper price consolidation within the bullish channel, the stability of 4.8100$ barrier continues to hinder the attempts to resume the bullish attack, to notice providing negative rebound towards 4.6200$ now.
We expect to get more mixed trades now, noting that it is important to hold above the additional support 4.5400$ to manage to gather the positive momentum and attack the mentioned barrier first, while surpassing it will push the price to achieve new gains that might extend towards 4.8800$ and 5.000$.
The expected trading range for today is between 4.5500$ and 4.7700$
Trend forecast: Bullish
Despite copper price consolidation within the bullish channel, the stability of 4.8100$ barrier continues to hinder the attempts to resume the bullish attack, to notice providing negative rebound towards 4.6200$ now.
We expect to get more mixed trades now, noting that it is important to hold above the additional support 4.5400$ to manage to gather the positive momentum and attack the mentioned barrier first, while surpassing it will push the price to achieve new gains that might extend towards 4.8800$ and 5.000$.
The expected trading range for today is between 4.5500$ and 4.7700$
Trend forecast: Bullish
Gold price is extending its range-play above $2,900 starting a new week on Monday, looking to defend the critical support line near $2,910.
Despite registering a weekly gain last week, Gold price struggles to gain upside traction early Monday. Gold buyers stay cautious amid looming US President Donald Trump’s tariffs on Canada and Mexico after the recent back-and-forth and ahead of this week’s US JOLTS Job Openings and Consumer Price Index (CPI) data.
President Trump issued a fresh tariff threat on Canadian lumber on Friday, noting that it may or may not come today, or on Monday, or on Tuesday. This statement came after the Trump administration temporarily waived tariffs on all USMCA-associated goods and reaffirmed that reciprocal tariffs will take effect in April.
On Sunday, Trump said that they are “looking at a lot of things with respect to tariffs on Russia.
Besides impending tariffs, geopolitical developments will also play a pivotal role this week, especially after the US President said that the administration has discussed lifting an intelligence pause on Ukraine. “Ukraine will sign the minerals deal, but I want them to want peace… they haven’t shown it to the extent they should,” Trump added.
Heightened uncertainty around tariffs and the Ukraine peace deal intensifies concerns over a potential US stagflation, especially after Friday’s February labor market report. The US economy added 151,000 jobs in February, compared with an expected rise of 160,000 and a previous downward revision of 125,000. Meanwhile, the Unemployment Rate climbed to 4.1% versus expectations of 4%. The Labor Force Participation Rate ticked a tad lower to 62.4% in the same period from January’s 62.6%.
The US Dollar lost roughly 3% of its value against its major currency rivals last week amid economic slowdown fears. This lifted bets for more Federal Reserve (Fed) interest rate cuts this year and kept the Gold price downside cushioned. According to LSEG Fed interest rate probabilities, markets are currently pricing 76 basis points (bps) of Fed rate cuts by year-end, starting in June.
However, Gold buyers failed to find any fresh impetus for a sustained upside as Fed Chair Jerome Powell stated on Friday that the US central bank would take a cautious approach to monetary policy easing, adding that the economy currently “continues to be in a good place”.
Looking ahead, Gold price remains a ‘buy-the-dips’ trade as it is the most sought-after store of value and a hedge against inflationary pressures. China continued its Gold purchases for the fourth consecutive month in February, according to the People’s Bank of China data, lending support to yellow metal.
Meanwhile, traders digest the latest China’s inflation data showing that the February CPI fell into negative territory for the first time since January last year, declining by 0.7% year-over-year (YoY.) China’s CPI in February fell 0.2% on a monthly basis, compared to a rise of 0.7% in January.
It’s worth mentioning that Chinese tariffs, announced last week, of up to 15% on a raft of US farm products come into effect on Monday.
The short-term technical outlook for Gold price remains more or less the same as long as it defends the 21-day Simple Moving Average (SMA) of $2,911 on a daily candlestick closing basis.
The uptrend could gain further traction on acceptance above the $2,930 static resistance.
The Relative Strength Index (RSI) holds comfortably above the 50 level, suggesting buyers will likely retain control in the near term.
If the February 26 high of $2,930 is taken out sustainably, the next topside barriers are at an all-time high of $2,956 and the $2,970 round level.
If Gold price runs into offers, immediate support is seen at the $2,850 psychological barrier as the 21-day SMA at $2,911 gives way.
The demand area near $2,835 could be a tough nut to crack for sellers.
Tariffs are customs duties levied on certain merchandise imports or a category of products. Tariffs are designed to help local producers and manufacturers be more competitive in the market by providing a price advantage over similar goods that can be imported. Tariffs are widely used as tools of protectionism, along with trade barriers and import quotas.
Although tariffs and taxes both generate government revenue to fund public goods and services, they have several distinctions. Tariffs are prepaid at the port of entry, while taxes are paid at the time of purchase. Taxes are imposed on individual taxpayers and businesses, while tariffs are paid by importers.
There are two schools of thought among economists regarding the usage of tariffs. While some argue that tariffs are necessary to protect domestic industries and address trade imbalances, others see them as a harmful tool that could potentially drive prices higher over the long term and lead to a damaging trade war by encouraging tit-for-tat tariffs.
During the run-up to the presidential election in November 2024, Donald Trump made it clear that he intends to use tariffs to support the US economy and American producers. In 2024, Mexico, China and Canada accounted for 42% of total US imports. In this period, Mexico stood out as the top exporter with $466.6 billion, according to the US Census Bureau. Hence, Trump wants to focus on these three nations when imposing tariffs. He also plans to use the revenue generated through tariffs to lower personal income taxes.
Brent oil price rallies upwards now to breach 70.40$ and attempts to hold above it, and by taking a deeper look at the chart, we find that the price completed forming double bottom pattern that we expect to push the price to recover in the upcoming sessions and achieve intraday gains.
To review the full report, and to get our more detailed analysis and 100% accurate signals provided by Best Trading Signal, subscribe to Economies.com VIP Club through the link below!
Brent oil price continued to rise to succeed touching the bearish channel’s resistance line that declined to 71.70$, to rebound downwards clearly from there and head towards resuming the main bearish track within the mentioned channel, and the price needs to surpass 70.10$ to reinforce the chances of continuing the bearish bias in the upcoming sessions.
To review the full report, and to get our more detailed analysis and 100% accurate signals provided by Best Trading Signal, subscribe to Economies.com VIP Club through the link below!
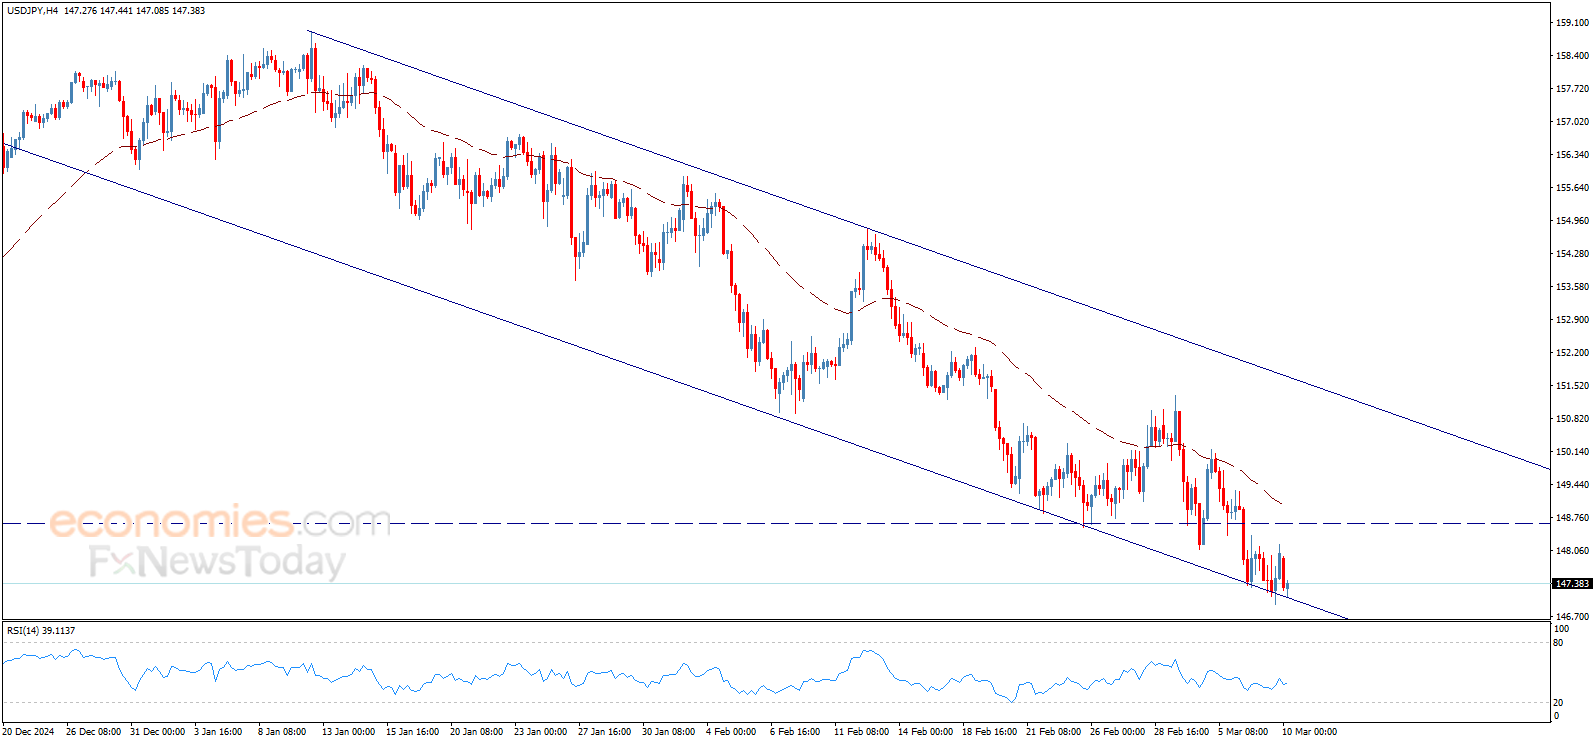
The USDJPY price shows sideways trades in the previous sessions, starting today with bearish bias in attempt to resume the expected bearish trend for the upcoming period, which targets 146.50 areas as a next negative station.
To review the full report, and to get our more detailed analysis and 100% accurate signals provided by Best Trading Signal, subscribe to Economies.com VIP Club through the link below!
Catching up on some of the revised forecasts after Germany ditched its debt brake, ICYMI:
Bank of America revised up their forecasts for the euro:
Now that WTI Crude Oil has hit the lower part of its mid and long-term price range, traders will have to start considering where support levels might start to prove durable. Selling WTI Crude Oil since the middle of January has proven to be a solid wager for traders with patience and the stamina to deal with reversals higher and then a return to the lower trend. However, at some juncture WTI Crude Oil is certain to run into dynamics regarding costs of production and demand, which will start to create areas where speculative outlook may finding buying impetus.

The ability to break below the 66.000 USD ratio in WTI Crude Oil this past week was intriguing. Long-term price charts show challenges to the 65.000 vicinity in the spring of 2023 and late December 2021. But it has been a handful of years since WTI Crude Oil has slumped below with the 64.000 to 63.000 price levels in a sustained manner. Looking for more downside pressure in WTI Crude Oil may remain the flavor for speculators, but they should begin to think about where a floor will be found.
After touching lows on Wednesday and Thursday of this past week, WTI Crude Oil did start to traverse upwards again. The movement higher lacked price velocity which seems to indicate large players feel the commodity belongs within its current realms.
The price of WTI Crude Oil has certainly delivered the lower price range that has been expected. But now that lower values have been attained, traders need to start asking where support levels are and will factor into potential reversals. Speculators should brace for the potential that current values now being demonstrated might begin to become an area where prices get choppy as large players trade and look for advantages.
The Trump administration’s proactive energy stance in not going to change, this creates a fundamental component in WTI Crude Oil which should keep the price of the commodity rater restrained. Looking for too much upside in WTI Crude Oil is likely a mistake, using targets and cashing out trades when they have achieved their technical goals is important. Technical perspectives within these current lower depths will be important. While it is true that WTI Crude Oil may see more downside pressure, traders also know that costs of production will factor into the futures price and create some support. Crude Oil has seen a strong downtrend emerge since the middle of January, and perhaps it isn’t over yet. This weeks’ trading will be interesting to see if support starts to become more durable.
Ready to trade our weekly forecast? We’ve shortlisted the best Forex Oil trading brokers in the industry for you.