The main category of Forex News.
You can use the search box below to find what you need.
[wd_asp id=1]
The main category of Forex News.
You can use the search box below to find what you need.
[wd_asp id=1]
Now that WTI Crude Oil has hit the lower part of its mid and long-term price range, traders will have to start considering where support levels might start to prove durable. Selling WTI Crude Oil since the middle of January has proven to be a solid wager for traders with patience and the stamina to deal with reversals higher and then a return to the lower trend. However, at some juncture WTI Crude Oil is certain to run into dynamics regarding costs of production and demand, which will start to create areas where speculative outlook may finding buying impetus.

The ability to break below the 66.000 USD ratio in WTI Crude Oil this past week was intriguing. Long-term price charts show challenges to the 65.000 vicinity in the spring of 2023 and late December 2021. But it has been a handful of years since WTI Crude Oil has slumped below with the 64.000 to 63.000 price levels in a sustained manner. Looking for more downside pressure in WTI Crude Oil may remain the flavor for speculators, but they should begin to think about where a floor will be found.
After touching lows on Wednesday and Thursday of this past week, WTI Crude Oil did start to traverse upwards again. The movement higher lacked price velocity which seems to indicate large players feel the commodity belongs within its current realms.
The price of WTI Crude Oil has certainly delivered the lower price range that has been expected. But now that lower values have been attained, traders need to start asking where support levels are and will factor into potential reversals. Speculators should brace for the potential that current values now being demonstrated might begin to become an area where prices get choppy as large players trade and look for advantages.
The Trump administration’s proactive energy stance in not going to change, this creates a fundamental component in WTI Crude Oil which should keep the price of the commodity rater restrained. Looking for too much upside in WTI Crude Oil is likely a mistake, using targets and cashing out trades when they have achieved their technical goals is important. Technical perspectives within these current lower depths will be important. While it is true that WTI Crude Oil may see more downside pressure, traders also know that costs of production will factor into the futures price and create some support. Crude Oil has seen a strong downtrend emerge since the middle of January, and perhaps it isn’t over yet. This weeks’ trading will be interesting to see if support starts to become more durable.
Ready to trade our weekly forecast? We’ve shortlisted the best Forex Oil trading brokers in the industry for you.
March 9, 2025 – Written by David Woodsmith
STORY LINK Pound to Dollar Weekly Forecast: Target Extended to 1.33-1.34 say Analysts
Foreign exchange strategists at Morgan Stanley have extended their Pound to Dollar exchange rate (GBP/USD) target to $1.33.
Bank of America analysts consider that the GBPUSD break higher this week is potentially very important and could pave the way for a test of 2024 highs above $1.34.
It has been a week of chaotic US drama amid with sharp dollar index losses (DXY) as the Euro surged and GBP/USD hit 4-month highs near 1.2950 before a correction.
ING commented; “This week’s tectonic shifts in the Transatlantic divide come with significant caveats and major unknowns. And it’s these question marks that really matter for what happens next in financial markets.”
The bank no longer expects GBP/USD will slide below 1.20.
According to Morgan Stanley; “The combination of USD-negative forces and improved optimism around EUR as a ‘credible alternative’ to the greenback should propel capital into Europe, benefiting not just EUR but other European currencies as well.”
Ukraine developments remained very important, especially given the European reaction.

On the trade front, President Trump imposed 25% tariffs on Canada and Mexico from February 4th.
Trump then announced that autos would be exempted for one month and this was then extended to all goods covered by the free-trade agreement.
There are still plans to introduce global tariffs at the beginning of April and tariffs on China have been increased.
MUFG commented; “What is clear is that the back-and-forth on trade tariff policy announcements can’t be good for the US economy and it is surely creating an incentive amongst businesses to retrench from decisions around hiring and business investments.”
US data was mixed with the jobs report close to expectations.
Federal government employment, however, declined and sharper falls are expected over the next few months.
Expectations of a first-quarter GDP decline for the first quarter increased recession fears.
Equity markets declined, but it was notable that the dollar failed to gain defensive support.
This failure helped open a wider currency debate.
According to Deutsche Bank’s global head of FX strategy George Saravelos there is an increased risk that the US dollar will lose its reserve currency status; “we are starting to become more open-minded to the prospects of a broader weaker trend unfolding for the dollar. Two pillars of America’s role in the world are being fundamentally challenged: the US’s security backstop for Europe and the respect of rules-based free trade.”
It added; “We do not write this lightly. But the speed and scale of global shifts is so rapid that this needs to be acknowledged as a possibility. It is hard to over-estimate the scale of change taking place in global economic and geopolitical relations in a matter of days.”
Kit Juckes at SocGen also expressed dollar reservations; “My biggest underlying concern with the dollar is that even after so many years of exceptionalism that have taken it to levels it hasn’t seen since 1985 in real effective terms, it only takes a few chinks in the armour for it to look weaker.”
ING commented on the 2025 outlook; “Given this week’s events and the fact that DXY is heavily weighted towards European currencies, it seems fair to say that DXY has now topped for the year.”
According to Lloyds Bank; “We’re witnessing regular acts of US economic self-harm, which will cause short-term disruptions at the very least. On top of that, we’ve seen an indiscriminate tearing at the rules and bureaucracy, which will invariably have unforeseen consequences.”
The bank noted the risk of capital outflows; “that flow could become a torrent as policy implications begin to galvanise, or we see a more sustained pick up in market volatility. We had shaded our longer-term core bullish USD view over the past couple of weeks, but we now abandon that viewpoint entirely.”
Doubts over the US outlook were compounded by the German proposals for a huge EUR500bn boost to infrastructure spending as well as a sharp increase in defence spending.
A re-rating of the Euro-area outlook and jump in yields triggered a Euro surge and further gains would be a tailwind for GBP/USD.
JP Morgan commented; “We are now approaching that inflection point prompting us to turn bearish on the dollar and constructive on the Euro for the first time since 2024. This represents a substantial change in view for us. It sees a potential EUR/USD move to 1.12-1.14.
Bank of America considers that the 1.20 area could be in reach late this year.
UBS is still wary over Pound fundamentals; “Risks regarding the UK’s fiscal and current account situation remain and pose a downside risk to GBP—in case of “the wrong kind of carry” whereby FX and rates can decouple as we saw in January.”
International Money Transfer? Ask our resident FX expert a money transfer question or try John’s new, free, no-obligation personal service! ,where he helps every step of the way,
ensuring you get the best exchange rates on your currency requirements.
A weaker US dollar, which fell to a four-month low, made gold more attractive to foreign buyers. The greenback’s decline was driven by a weaker-than-expected non-farm payrolls (NFP) report and growing speculation about Fed rate cuts.
China continued its gold-buying spree for a fourth consecutive month in February, signaling ongoing central bank demand for the metal. Meanwhile, geopolitical risks and trade uncertainty provided further safe-haven support.
The US labor market showed signs of cooling, with February’s NFP data revealing 151,000 jobs added, below the forecasted 160,000. This report reinforced market expectations that the Fed could begin rate cuts by June, with futures pricing in about 78 basis points of easing this year.
However, Federal Reserve Chair Jerome Powell struck a cautious tone, stating that the central bank needs “greater clarity” before making any moves on interest rates. Inflation concerns remain a key issue, with upcoming CPI data expected to provide fresh insight into whether price pressures are cooling.
Trade tensions continue to be a major factor influencing gold. The US recently imposed fresh 25% tariffs on imports from Mexico and Canada, along with increased duties on Chinese goods. A temporary exemption on auto tariffs for certain manufacturers has added complexity, leaving markets uncertain about the long-term trade policy outlook.
Shifting to the US labor market and consumer sentiment, initial jobless claims and the Michigan Consumer Sentiment Index also need consideration.
A spike in jobless claims and a fall in consumer sentiment could indicate weaker wage growth and spending. A pullback in consumer spending may soften demand-driven inflationary pressures. However, another drop in claims and improving sentiment may delay Fed rate cuts.
A more hawkish Fed may push USD/JPY toward 150, while dovish signals could trigger a drop toward 145.
In the coming week, USD/JPY trends will hinge on:
After last week’s declines, the USD/JPY sits well below the 50-day and the 200-day EMAs, sending bearish price signals.
A USD/JPY break above the 149.358 resistance level would support a return to 150. A breakout from 150 could enable the bulls to target the 200-day and 50-day EMAs.
Conversely, a break below last week’s low of 146.935 could signal a drop toward 145. A fall through 145 would bring the 140.309 support level into sight.
The 14-day Relative Strength Index (RSI) at 33.86 indicates a USD/JPY fall below 147 before entering oversold territory (RSI below 30).
March 9, 2025 – Written by Frank Davies
STORY LINK Euro to Dollar Forecast: 2 Factors Could Drive Additional Gains Over Next 1-3 Months
The US Dollar (USD) has remained firmly on the defensive versus the Pound Sterling (GBP) in global markets while the Euro (EUR) has made further net gains following German plans to unlock a huge fiscal stimulus.
The Pound to Dollar exchange rate (GBP/USD) has posted fresh 4-month highs just above 1.2930.
The US jobs data is likely to be pivotal in determining whether GBP/USD can test the 1.30 level today.
The Pound to Euro (GBP/EUR) exchange rate is close to 5-week lows just above the 1.1900 level amid a Euro surge.
According to Kirstine Kundby-Nielsen, FX analyst at Danske Bank, “It’s all to do with the broad-based euro optimism that we’ve seen with this shift in fiscal policy in Germany.”
ING added on the Euro, “A major re-rating is underway.”
Economic data and the equity market performance is likely to be crucial for the dollar.
President Trump made further concessions to Canada and Mexico on Thursday, but there are increased fears that the uncertainty and frequent policy changes will undermine confidence in the economy.
The US will release the latest employment data on Friday.
Consensus forecasts are for an increase in non-farm payrolls around 160,000 for February with the unemployment rate holding at 4.0%.
Markets are, however, expecting a soft set of data even though the rash of government firings will not yet show up in the data.
ING commented, “Some fear that weather plus changes in government education funding will be a drag on the headline number. However, the impact of the DOGE government job cuts may not emerge for another couple of months.”
According to MUFG, “Given the depreciation of the dollar is down to a shift in relative macro expectations in part due to weak economic data from the US, a weak payrolls report today would certainly further extend dollar losses and harden the view that the FOMC will cut sooner than expected.”
The ECB cut interest rates on Thursday but added an extra element with comments that policy is now much less restrictive.
In this context, there were doubts whether there would be a further cut in April.
ING commented, “A pause at the next meeting to come to terms with the new macro reality now looks like a possibility.”
EUR/USD has hit 4-month highs around 1.0870 amid the Euro surge. Further gains would provide a tailwind for GBP/USD.
According to Danske Bank, “While EUR optimism from increased fiscal spending may now be largely priced in, potential catalysts such as a ceasefire deal in Ukraine or a further deterioration in the US cyclical macro outlook – especially the latter – could drive additional gains in the pair over the next 1-3M.”
International Money Transfer? Ask our resident FX expert a money transfer question or try John’s new, free, no-obligation personal service! ,where he helps every step of the way,
ensuring you get the best exchange rates on your currency requirements.
TAGS: Euro Dollar Forecasts
I wrote on 2nd March that the GBP/NZD currency pair would likely fall in value. Unfortunately, it rose in value by 0.71%.
Last week saw several data releases affecting the Forex market:
Last week’s key takeaways were:
The coming week has a lighter schedule of important releases, so we are likely to see less volatility in the Forex market over the coming week.
This week’s important data points, in order of likely importance, are:
For March 2025, I made no forecast, as there were no clear trends at the start of this month.
Last week, I forecasted that the following currency cross would fall in value over the week:
This was not a profitable call.
This week, I forecast that the following currency crosses will fall in value:
The Euro was the strongest major currency last week, while the US Dollar was the weakest, putting the EUR/USD currency pair in focus. Volatility increased last week, with 70% of the most important Forex currency pairs and crosses changing in value by more than 1%. It is likely to remain at a similar level over the coming week, despite the lighter agenda, due to US inflation data due, and the ongoing trade war.
You can trade these forecasts in a real or demo Forex brokerage account.

Last week, the US Dollar Index printed the largest weekly bearish candlestick in almost 2.5 years. The Dollar was the worst performing major currency last week and suffered a big loss, closing back within its dominant recent range and well below its level from 3 months ago, invalidating its former long-term bullish trend. At one point, the price reached a new 4-month low.
These are bearish signs, although there is some lower wick suggesting a little buying at the low.
Global markets have entered a strongly risk-off mode, but the greenback does not benefit because of the uncertain trade war the US is now engaged in against Canada, Mexico, and China, with no end in sight.
Trades taken over the coming week will probably be best positioned against the US Dollar, at least until a deal is announced replacing reciprocal import tariffs involving the USA.

The EUR/USD currency pair made a huge gain over the week, rising by more than 4%, which is unusual. The key driver is certainly the US-centered trade war, which has sent the greenback flying lower, while the Euro has gained as a store of value.
Although the European Central Bank met last week and gave a slightly dovish report, as well as cutting rates by 0.25%, that was not enough to weaken the Euro at all.
Despite the strong bullish move, the daily price chart below shows that the bulls may have run out of steam towards the end of last week, with the final two daily candlesticks close to looking like bearish pin bars. Another factor is the tight cluster of resistance levels overhead which are confluent with a major bearish inflection point near the major round number at $1.1000.
Another bearish factor is that the moving averages are misaligned: although the price has made a bullish breakdown to new multi-month highs, the 50-day moving average is still below the 100-day moving average, and this is often used as a filter by successful trend traders, suggesting we are most likely to see a bearish reversal.
I caution traders positioned long here to think about exiting and suggest that other traders consider a short trade, if and when we get a reversal from a key resistance level.

The USD/JPY currency pair fell last week to trade at a new 5-month low. Trend traders would have got signals to go short here last week but this was stopped by one key filter still saying no short trade: the 50-day moving average remains above the 100-day moving average.
Note how the price rejected the low of the week Friday and the support level at ¥147.84 with a bullish pin bar. This is certainly not decisive, but until the price makes a stronger fall and erases that low with a strongly bearish close, it will be unwise to go short. Also, the moving averages need to cross.
The US Dollar is very weak due to the US-centered trade war, and the Japanese Yen typically benefits in this kind of risk-off situation where the greenback cannot. The Yen also has a tailwind as Japanese wage inflation is clearly rising and the Bank of Japan seems set to implement meaningful rate hikes for the first time since 2008.

The S&P 500 Index fell strongly last week and reached a level nearly 8% below its record high which was made barely more than 2 weeks ago. The main reason for the strong drop in most global stock markets, and the major US indices in particular, is of course the large tariffs President Trump has imposed on US imports from Canada and Mexico, and the fact that neither country seems close to capitulating or to make the kind of deal President Trump would want to call off the tariffs. The US tariffs are just negotiation by another means.
Technically, what is most interesting here is that the price on Thursday and Friday traded below the 200-day moving average, which is drawn within the daily price chart below. This indicator is used to establish a technical bear market, and it is interesting we have not yet had a daily close below it. This suggests that this moving average may be acting as a mobile pivotal point. If the price keeps refusing to close below it, we may see the start of another bullish rally, and if a tariff deal were then concluded, that would give a big tailwind to any bullish push.
Personally, as a trend trader, I will not be entering any new long trades until we see the price make a new record high, and that might not happen for quite a long time.

It was a poor week for commodities generally, with the possible exception of Gold, which mostly traded not far away from its recent all-time high just above $2,950.
One of the very few exceptions is Natural Gas. The nearest futures contract of Henry Hub natural gas rose during last week to make a new 2-year high and ended the week not far from that.
So, what is driving Natural Gas higher? Most analysts see it as a combination of extreme cold weather, seasonality, and strong demand plus weak supply.
March can be a pretty cold month in the Northern Hemisphere, and the cold can even stretch into April, so there is reason to believe this long-term bullish trend might continue for a while longer yet.
If you are worried about the generally poor environment for commodities and start of the spring season later this month, you could pass on this long trade or take an unusually small position.

I see the best trades this week as:
Ready to trade our Forex weekly forecast? Check out our list of the top 10 Forex brokers in the world .
Additionally, European gas storage is at 37% capacity, compared to the five-year seasonal average of 49%, reinforcing global supply concerns. However, U.S. traders remain focused on domestic fundamentals, where inventory tightness continues to underpin long-term price strength.
The latest NOAA forecast for March 17-21 introduced a more bullish factor late last week. The outlook calls for cooler temperatures along the West Coast, while storm systems could help moderate warmth on the East Coast. This shift in expectations sparked short-covering, helping prices recover from early-week losses.
However, the overall forecast remains mixed. While colder systems persist in the northern U.S., milder conditions across the South and East, with highs in the 50s-80s, could limit heating demand. If temperatures trend warmer in subsequent forecasts, natural gas could face renewed selling pressure.
Trade policy developments are adding another layer of uncertainty. U.S. tariffs of 10% on Canadian natural gas imports took effect last week, which could put upward pressure on domestic prices as importers adjust. Canada has hinted at retaliatory measures, including a 25% tariff on electricity exports to the U.S., potentially increasing demand for gas-fired power generation.
Meanwhile, LNG exports remain near record highs, with flows to U.S. terminals holding at 15.2 Bcf/d. Additionally, President Trump’s decision to lift restrictions on new LNG export projects could lead to further structural demand growth. The upcoming decision on the Commonwealth LNG facility in Louisiana will be a key development to watch.
The GBP/USD weekly forecast shows a rebound in the pound as the dollar drops amid soft NFP and tariff uncertainty.
The GBP/USD price had a bullish week as the pound soared against a weak dollar. The greenback collapsed as market participants grew fearful of a US economic slowdown. On Tuesday, Trump implemented tariffs on Canada, Mexico and China. Although he suspended some of these tariffs, traders worried that trade wars would hurt the US economy.
–Are you interested to learn more about forex options trading? Check our detailed guide-
Meanwhile, Fed rate cut expectations increased after US nonfarm payrolls came in lower than expected. Job growth slowed down slightly. At the same time, the unemployment rate increased from 4.0% to 4.1%. More downbeat data next week could push traders to start pricing three rate cuts this year.
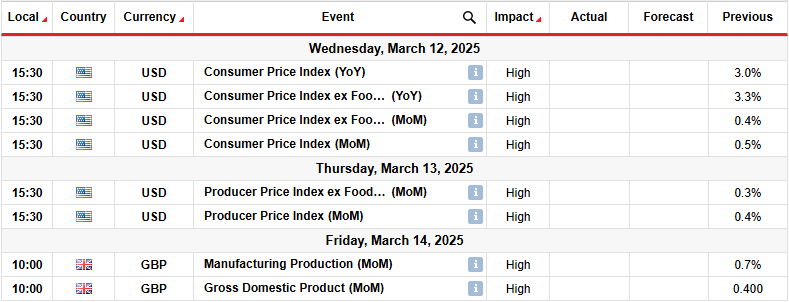
Next week, the US will release its CPI and PPI reports, showing the state of inflation. Meanwhile, the UK will release data on manufacturing production and gross domestic product. The inflation data will shape the outlook for Fed rate cuts. Economists expect inflation to ease from the previous month. Such an outcome would align with recent data showing a slowdown in the US economy. Therefore, it would increase Fed rate cut expectations, boosting GBP/USD.
Meanwhile, UK data will show the health of the UK economy and shape the outlook for Bank of England monetary policy.
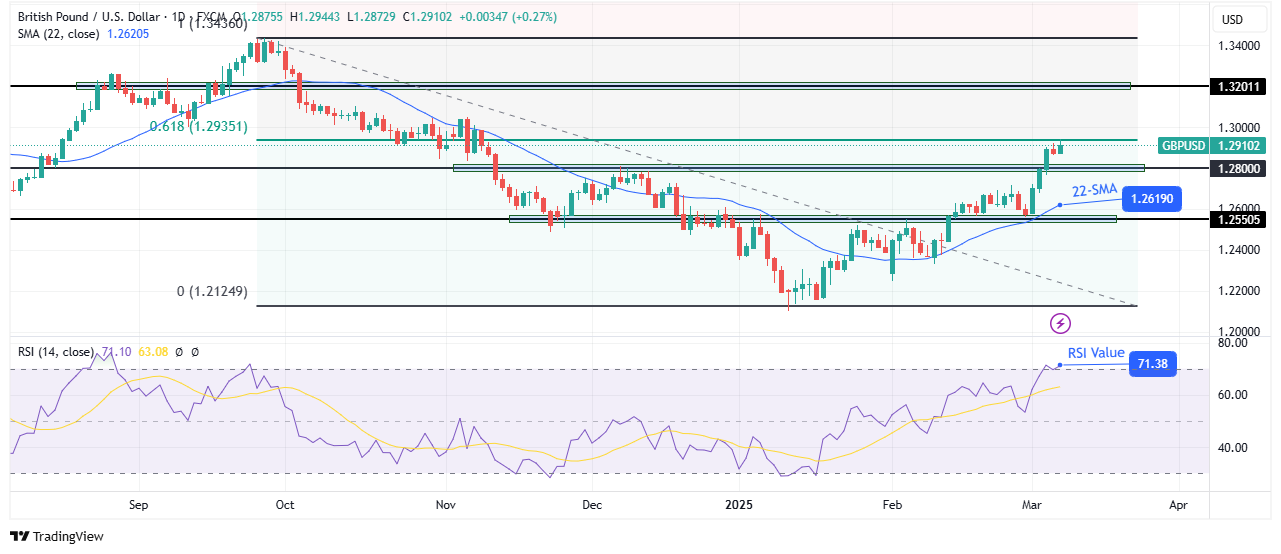
On the technical side, the GBP/USD price has broken above the 1.2800 key resistance level. This move has pushed the price far above the 22-SMA, with the RSI in the overbought region, indicating solid bullish momentum.
–Are you interested to learn more about Thailand forex brokers? Check our detailed guide-
The price recently reversed after a strong downtrend. Since the reversal, bulls have maintained their position above the 22-SMA, constantly reaching new highs. However, the current high has fallen near the 0.618 Fib retracement level. This might act as a solid resistance. Therefore, GBP/USD might pull back to retest the recently broken 1.2800 key level. A deeper pullback would retest the 22-SMA.
However, as long as the price stays above the SMA and the RSI above 50, the bullish trend will continue. Therefore, GBP/USD might reach the 1.3201 resistance level.
Looking to trade forex now? Invest at eToro!
67% of retail investor accounts lose money when trading CFDs with this provider. You should consider whether you can afford to take the high risk of losing your money.
I suspect that we will continue to see the Japanese yen rally a bit, but I think longer term eventually we turn around. In the short term, we could very well end up dropping down to the 145 yen level, which is an area that’s been important more than once and will attract a certain amount of attention. However, if we were to turn around and recapture the 150 yen level on a daily close,Top Forex Brokers1 Get Started 74% of retail CFD accounts lose money Could We Recover?You may be able to convince me that we are going to recover quite a bit. I do think that this is simply going to be about the bond markets, and of course, the yields in America have fallen while the yields in Japan have risen, so we’re repricing the differential. At the end of the day, though, you still pay to be short of this market, something I’m not a fan of. So as long as the interest rates are still pretty far wide apart. I don’t really like the idea of shorting for anything more than a short term move. From a longer term standpoint, I still believe that eventually we will see this thing turn around. But there are hints of recession in the United States, which could set up an interesting situation where maybe the yen strengthens against the dollar, but not against other currencies. We’ll just have to wait and see. But right now, I would say that more likely than not, the 150 yen level will be a very difficult resistance barrier to get above.EURUSD Chart by TradingViewWant to trade our USD/JPY forex analysis and predictions ? Here’s a list of forex brokers in Japan to check out.
MENAFN08032025000131011023ID1109291277
Legal Disclaimer:
MENAFN provides the information “as is” without warranty of any kind. We do not accept any responsibility or liability for the accuracy, content, images, videos, licenses, completeness, legality, or reliability of the information contained in this article. If you have any complaints or copyright issues related to this article, kindly contact the provider above.
Another leg down in gold has been anticipated given last week’s bearish reversal following a new record high of $2,956. The week ended with a weekly bearish engulfing pattern as gold fell below support of the prior two weeks and it ended the week in a bearish position, in the lower third of the week’s trading range. Furthermore, a breakdown of a rising trendline and 20-Day MA triggered, thereby further confirming weakness. There has been only one leg down from the $2,956 record high today and a minimum of two legs down is common for a bearish retracement.
This week’s advance tested prior support of the trendline as resistance, and resistance was seen around the line. The 20-Day line is the other trend indicator that was tested as resistance, but it failed as resistance because gold rose above the 20-Day MA and traded above it for four days. Nonetheless, taken together, gold may have completed its counter trend rally to test prior support as resistance. Once that happens, the chance for a bearish continuation improves.
An inside week is established for this week, leaving two key price levels to be considered. The low for the week was $2,855 and the high is $2,930. A decisive move through either price level may determine the next direction. Although the technical evidence is more on the bearish side, a sustained rally above this week’s high would require a realignment of views and would open the possibility of a bullish continuation of the trend in the near term. On the downside, the next lower target for gold if the recent swing low at $2,833 fails to retain support, is a range around $2,813 to $2,810, consisting of the 38.2% Fibonacci retracement and the initial target for a falling ABCD pattern, respectively.
For a look at all of today’s economic events, check out our economic calendar.