The main category of Forex News.
You can use the search box below to find what you need.
[wd_asp id=1]
The main category of Forex News.
You can use the search box below to find what you need.
[wd_asp id=1]
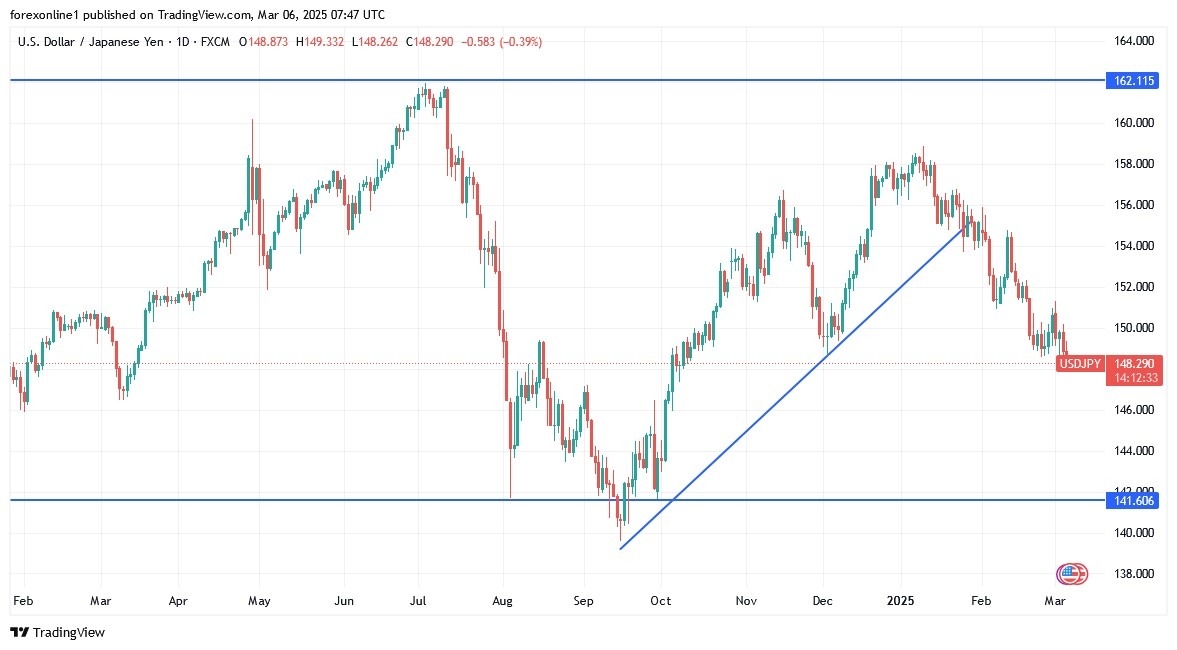
There is no doubt that, according to currency market trading on licensed Forex trading companies’ platforms, the Japanese Yen’s gains have increased to their highest in five months amidst hawkish comments from a senior Bank of Japan official. Bank of Japan Deputy Governor Shinichi Uchida stated that the central bank would raise interest rates further if its economic forecasts are met, emphasizing that the exit from the intensive monetary easing program has not just begun. The official also stressed that monetary conditions remain very accommodative, noting that the Bank of Japan’s reduction of Japanese government bond holdings has been limited.
Meanwhile, the latest data showed that Japan’s services sector grew at its fastest pace in six months in February, driven by strong demand.
Globally, the Japanese yen was pressured by growing trade concerns after new U.S. tariffs on Canada, Mexico and China took effect this week, prompting retaliatory measures from those countries.

Watch the dollar decline against the Japanese yen to seize new buying opportunities, but always remember not to take risks.
At its latest meeting, the Bank of Japan raised its key short-term interest rate by 25 basis points to 0.5%, the highest level in 17 years, in line with market consensus. This move reflects the momentum of wage increases and steady progress in inflation. It also represents the third-interest rate hike since the Japanese central bank ended negative interest rates in March 2024. The central bank also indicated plans for further price increases and scaling back monetary support if economic data and prices match its expectations.
Friday’s decision was passed by a majority of 8-1, with board member Nakamura dissenting. At the same time, in its quarterly forecast, the Bank of Japan raised its core inflation forecast to 2.7% for fiscal 2024 from October’s estimate of 2.5%, citing a growing labour shortage. Moreover, the Bank of Japan also expected core inflation to decline to 2.4% in fiscal 2025 and 2.0% in fiscal 2026.
At the same time, the central bank lowered its GDP growth forecast for 2024 slightly to 0.5% from the previous figure of 0.6%. Growth forecasts remain at 1.1% for fiscal 2025 and 1.0% for fiscal 2026.
According to trading via the daily chart, the general downward trend for the USD/JPY pair is getting stronger and breaking the support of 148.00 may be possible. If this happens, the technical indicators may start giving strong oversold signals from the Relative Strength Index and the MACD indicator. Currently, the closest support levels for the currency pair are 148.00, 147.20 and 146.00, respectively. We still prefer to buy the dollar against the Japanese yen, but without risk and dividing the trading volume on separate support levels. On the other hand, and for the same time period, the resistance of 152.50 will remain the most important to break the current bearish outlook for the currency pair.
Want to trade our USD/JPY forex analysis and predictions? Here’s a list of forex brokers in Japan to check out.
Spot Gold consolidated in the $2,910 region for most of this Thursday, attracting buyers on an intraday dip to $2,891.27. Financial markets kept swinging at the pace of sentiment, with prevalent demand for safety maintaining the bright metal afloat.
Concerns revolve around United States (US) government tariff plans. President Donald Trump kick-started his mandate by announcing massive levies on most trading partners, rolling 25% taxes on Canadian and Mexican imports on Tuesday, only to delay such levies on automakers for one month on Wednesday.
Additionally, Trump said on Thursday, “After speaking with President Claudia Sheinbaum of Mexico, I have agreed that Mexico will not be required to pay Tariffs on anything that falls under the USMCA Agreement. This Agreement is until April 2nd. I did this as an accommodation and out of respect for President Sheinbaum. “
The back and forth does not overshadow the fact that the trade war is in full fashion, and hence, concerns about the economic performance of the world’s largest economy. Speculative interest considers that Trump’s plans pose a downward risk to growth and an upward risk to inflation, resulting in a weakening Greenback.
Meanwhile, US employment-related data came in mixed. On the one hand, weekly unemployment claims fell in the last week of February, while Q4 Unit Labor Costs declined to 2.2% from 3% in the previous quarter. On the other hand, US-based employers last month announced plans to slash 172,017 jobs, a 103% increase from January and the highest February total since 2009, according to the Challenger Job Cuts report.
The US will release the February Nonfarm Payrolls report on Friday. The country is expected to have added 160K new jobs in the month, while the Unemployment Rate is foreseen steady at 4%.
The daily chart for the XAU/USD pair shows is little changed for a second consecutive day, yet at the same time, it posted a lower high and a lower low, which skews the risk to the downside. However, the same chart shows that intraday dips below a bullish 20 Simple Moving Average (SMA) quickly attract buyers. Technical indicators, in the meantime, remain within positive levels, although with uneven strength.
The near-term picture shows buyers battling to retain control. The XAU/USD pair is currently developing above all its moving averages, although a flat 100 SMA stands at $2,911.50. The 20 SMA, in the meantime, advances below the longer one. Finally, technical indicators diverge around their midlines, with the Momentum indicator aiming lower yet the Relative Strength Index (RSI) advancing. The bearish potential remains limited, with dips likely to keep attracting buyers.
Support levels: 2,911.50 2,894.25 2,876.90
Resistance levels: 2,927.90 2,941.40 2,956.10
The GBPCHF price formed strong bullish rally yesterday, taking advantage of the frequent consolidation within the minor bullish channel, to notice surpassing 1.1420 barrier and approaching 1.1510 resistance line.
Note that stochastic crawl towards the overbought areas will reinforce the chances of gathering the additional positive momentum to ease the mission of breaching the current resistance and start targeting new positive stations, starting as a 1.1545 level.
The expected trading range for today is between 1.1450 and 1.1545
Trend forecast: Bullish
This does tend to be a very volatile time, but because of this, I want to take my time and see a nice surge lower to get involved in a short position. As far as buying is concerned, if it wasn’t for the seasonality, that would obviously be the trade here. But the last thing I want to do is be the last buyer of natural gas for the season.
The risk to reward ratio just is not that appealing to me right now. So as much as it pains me to not participate in what’s been such a strong three days, the reality is the move I’m looking for is a lot bigger than this. So, we’ll have to wait and see, but right now we’re still just flirting with that top and we’ll have to see if we can break through it. If we do, it could open up a move to the $5 level, which, quite frankly, I hope it does, because I can short it from a higher level at that point, as soon as we start to price in the warmer weather.
For a look at all of today’s economic events, check out our economic calendar.
According to Forex market trading and reliable trading companies’ platforms, the British Pound benefited significantly from expectations that interest rates in Britain will remain higher for longer, with traders reducing their bets on interest rate cuts by the Bank of England to 52 basis points for 2025. Bank of England Deputy Governor Ramsden warned that persistent wage pressures could keep inflation high but suggested that future interest rate cuts could accelerate if needed.
Additionally, the Pound is seen as less exposed to US tariffs, especially after US President Trump suggested a potential trade deal with Britain that could avoid new tariffs. At the same time, Germany announced a significant increase in defence and infrastructure spending, while Britain has already outlined its plans to increase defence spending and cover it with cuts in development budgets.
As we expected before, the improvement in investor and market sentiment will support further gains for the British pound, and now you should be careful not to renew the selling operations to take profits.
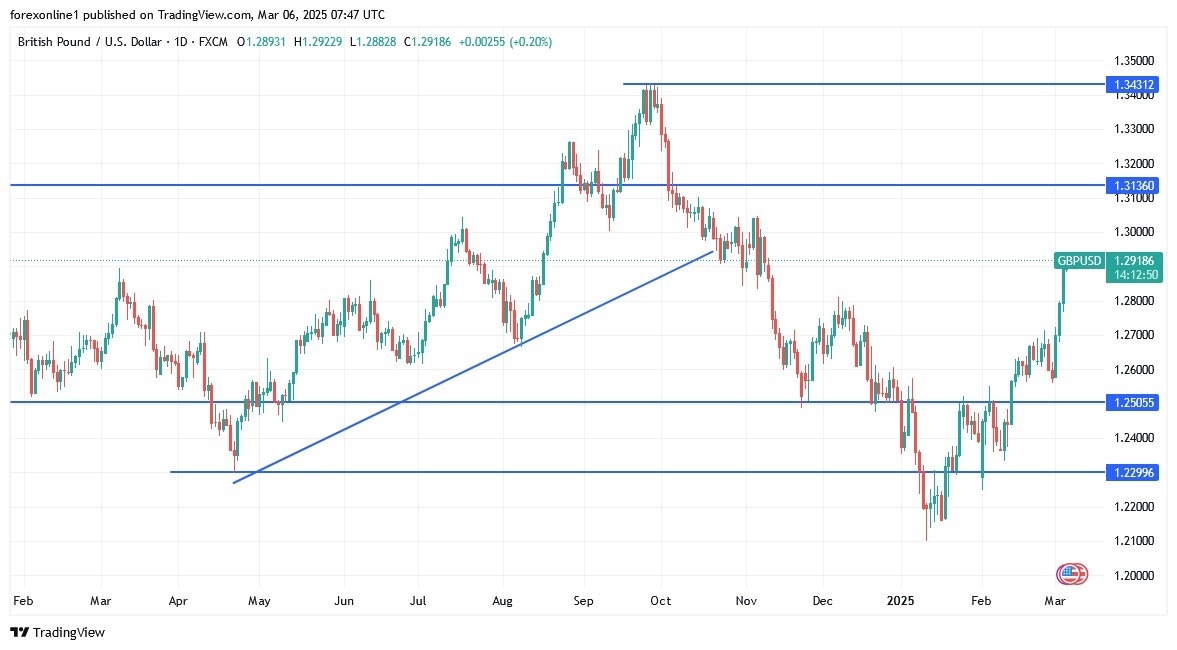
According to Forex market trading, the US dollar’s decline after the confirmation of tariffs on Canada and Mexico perplexed traders and analysts alike. In general, the dollar’s weakness reflects expectations that tariffs pose a significant obstacle to US economic growth and at the same time raise inflation. In short, it’s stagflation. Commenting on recent trading, Morgan Stanley analysts say that this breakout is very important because it opens the door to broader US dollar weakness. After recent gains, the GBP/USD pair rose to recover the 50% Fibonacci retracement of the major decline that occurred from October 2024 to January 2025.
On another note, the slowdown in US economic data has become clear, prompting financial markets to bet on further US interest rate cuts by the Federal Reserve. Money markets show that investors are pricing in 75 basis points of cuts by the December meeting. That would mean three 25 basis point cuts, higher than the single cut expected in early February. This is weighing on US bond yields, which in turn is weighing on the US dollar.
According to recent trading, the yield on the 10-year British treasury bond rose 11 basis points to 4.613%, following a rise in European bond yields after Germany announced a historic fiscal shift to boost spending on defence and infrastructure. The move signals increased borrowing across Europe, weighing on UK revenues as the government also plans to increase defence spending, funded by cuts in other areas.
At the same time, expectations of a Bank of England rate cut have dimmed, with markets now pricing in just 52 basis points of cuts for 2025. BoE Deputy Governor Ramsden warned that persistent wage pressures could keep inflation high, but also suggested that future rate cuts could accelerate if economic conditions worsen.
According to the performance on the daily chart, bulls’ control over the GBP/USD pair is getting stronger and a move towards the psychological resistance of 1.3000 will be the strongest confirmation of the upward shift. At the same time, technical indicators will move towards strong overbought levels led by the movement of the RSI and MACD indicators. In contrast, and over the same time frame, the support level of 1.2630 will remain a threat to the current upward shift. Finally, we expect GBP/USD to remain on its upward trajectory until the reaction to the US jobs numbers which may affect market expectations for future US central bank policy.
Ready to trade our daily GBP/USD Forex forecast? Here’s some of the best forex broker UK reviews to check out
Polygon’s currency price (MATICUSDT) inched lower in the intraday levels, confirming the breach of the pivotal support of $0.286, amid the dominance of the main downward trend in the medium term, while trading alongside the secondary short-term trend line, with negative pressure from trading below the 50-day SMA, coupled with negative signals from the RSI.
Therefore we expect the price to decline and target the support of $0.149, provided it settles firmly below the resistance of $0.286.
Trend forecast for today: Bearish
Gold price is sitting at one-week highs near $2,930 early Thursday, consolidating a three-day recovery while aiming for a retest of lifetime highs of $2,956 ahead of mid-tier US economic data releases.
Gold price has entered a brief phase of upside consolidation as buyers take a breather before the next leg higher. The buying interest around the bright metal remains unabated amid sustained US Dollar (USD) weakness as increased odds of further interest rate cuts by the Federal Reserve (Fed) due to US economic slowdown concerns.
US President Donald Trump’s tariff war is expected to increase inflation, rekindling stagflation fears.
Even though Trump announced a one-month pause on the auto tariffs while considering agricultural exemptions on Canada and Mexico, the USD sellers refuse to give up amid a recent series of dismal US economic data and a relentless surge in the EUR/USD pair.
Data released by the ADP Research showed on Wednesday that the US private sector added 77K jobs in February after creating 186K jobs in January. The data missed the expectations of 140K by a wide margin. However, the Institute for Supply Management (ISM) Services PMI rose to 53.5 in February, exceeding forecasts for 52.6. The ISM Services Employment Index jumped to 53.9 in February from 52.3 in January.
The Euro (EUR) jumped to a four-month high against the USD, tracking the rally in the German bund yields after German political parties agreed on a massive spending plan to support the Eurozone’s biggest economy. Surging German bund yields drove global yields higher, including the US Treasury bond yields, capping the Gold price recovery.
Gold traders now eagerly await Friday’s Nonfarm Payrolls (NFP) data to assess the Fed’s easing trajectory amid growing trade tensions between the US and its trading partners.
In the meantime, the mid-tier US Jobless Claims data and further developments on the tariffs front by the Trump administration will be closely followed for any impact on the USD performance and the Gold price action.
The upcoming European Central Bank (ECB) policy decision could curb the EUR/USD rally, fuelling a fresh US Dollar rebound. In such a scenario, Gold price could see a corrective move lower, which could also be seen as a profit-taking decline ahead of the all-important US payrolls data on Friday.
The short-term technical outlook for Gold price remains more or less the same as long as it defends the 21-day Simple Moving Average (SMA) of $2,906.
The uptrend could regain traction only on acceptance above the $2,930 static resistance on a daily candlestick closing basis.
The Relative Strength Index (RSI) has turned slightly lower but holds well above the 50 level, suggesting that the bullish potential remains in place.
If the February 26 high of $2,930 is taken out sustainably, the next topside barriers are at an all-time high of $2,956 and the $2,970 round level.
If sellers fight back control, immediate support is seen at the 21-day SMA at $2,906, below which the $2,850 psychological barrier will be challenged.
The $2,835 demand area will then come into play.
(This story was corrected on March 6 at 07:30 GMT to say that “Gold price defends 21-day SMA at $2,906, not $2,903.7 )
Gold has played a key role in human’s history as it has been widely used as a store of value and medium of exchange. Currently, apart from its shine and usage for jewelry, the precious metal is widely seen as a safe-haven asset, meaning that it is considered a good investment during turbulent times. Gold is also widely seen as a hedge against inflation and against depreciating currencies as it doesn’t rely on any specific issuer or government.
Central banks are the biggest Gold holders. In their aim to support their currencies in turbulent times, central banks tend to diversify their reserves and buy Gold to improve the perceived strength of the economy and the currency. High Gold reserves can be a source of trust for a country’s solvency. Central banks added 1,136 tonnes of Gold worth around $70 billion to their reserves in 2022, according to data from the World Gold Council. This is the highest yearly purchase since records began. Central banks from emerging economies such as China, India and Turkey are quickly increasing their Gold reserves.
Gold has an inverse correlation with the US Dollar and US Treasuries, which are both major reserve and safe-haven assets. When the Dollar depreciates, Gold tends to rise, enabling investors and central banks to diversify their assets in turbulent times. Gold is also inversely correlated with risk assets. A rally in the stock market tends to weaken Gold price, while sell-offs in riskier markets tend to favor the precious metal.
The price can move due to a wide range of factors. Geopolitical instability or fears of a deep recession can quickly make Gold price escalate due to its safe-haven status. As a yield-less asset, Gold tends to rise with lower interest rates, while higher cost of money usually weighs down on the yellow metal. Still, most moves depend on how the US Dollar (USD) behaves as the asset is priced in dollars (XAU/USD). A strong Dollar tends to keep the price of Gold controlled, whereas a weaker Dollar is likely to push Gold prices up.
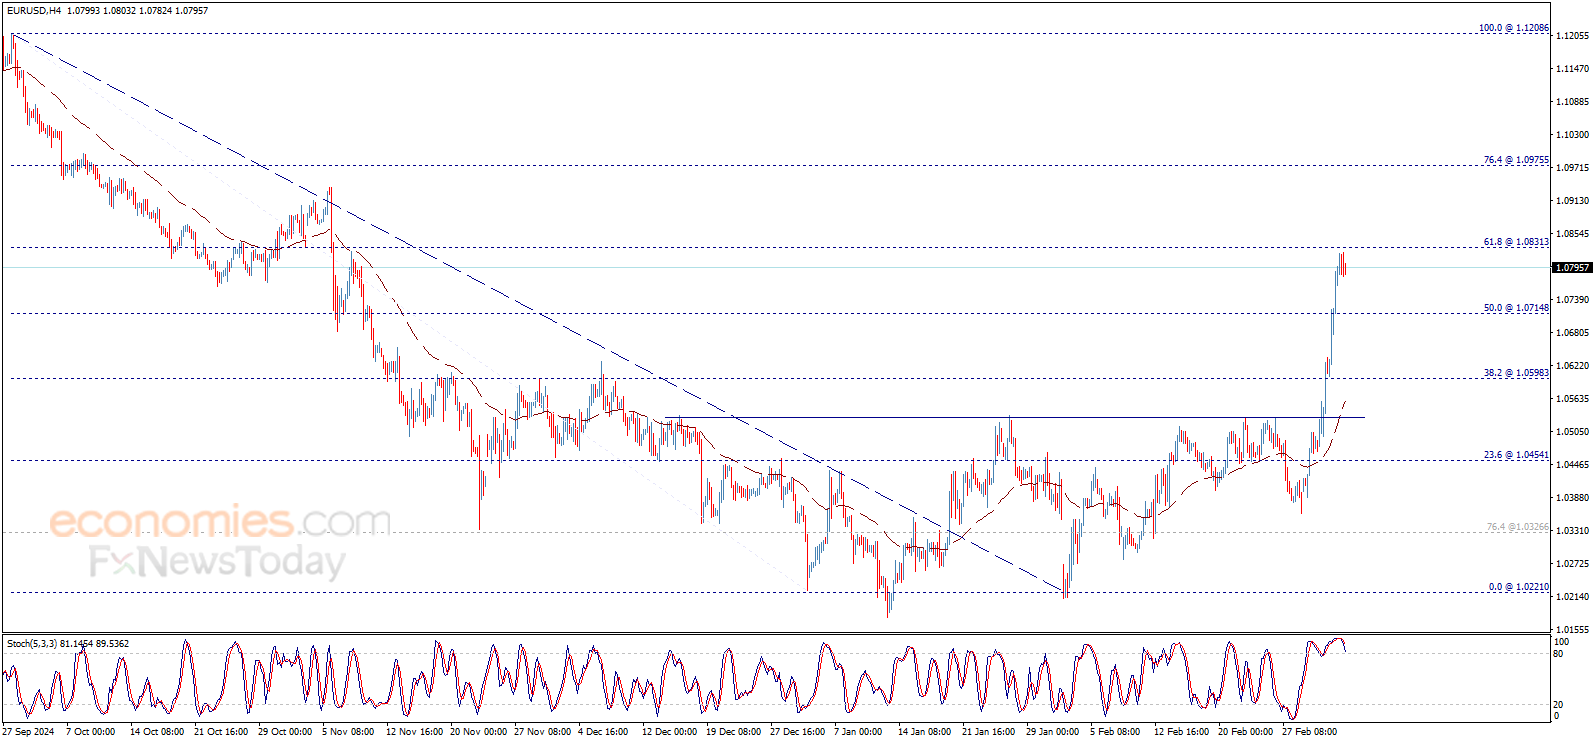
EUR/USD preserved its bullish momentum and registered impressive gains for the third consecutive day on Wednesday. The pair continues to inch higher in the European morning on Thursday and trades at its highest level since early November above 1.0800.
The table below shows the percentage change of Euro (EUR) against listed major currencies this week. Euro was the strongest against the US Dollar.
| USD | EUR | GBP | JPY | CAD | AUD | NZD | CHF | |
|---|---|---|---|---|---|---|---|---|
| USD | -4.05% | -2.55% | -1.15% | -0.78% | -2.14% | -2.45% | -1.36% | |
| EUR | 4.05% | 1.45% | 2.80% | 3.21% | 1.89% | 1.48% | 2.61% | |
| GBP | 2.55% | -1.45% | 1.46% | 1.74% | 0.43% | 0.03% | 1.15% | |
| JPY | 1.15% | -2.80% | -1.46% | 0.60% | -0.95% | -1.27% | -0.21% | |
| CAD | 0.78% | -3.21% | -1.74% | -0.60% | -1.21% | -1.68% | -0.58% | |
| AUD | 2.14% | -1.89% | -0.43% | 0.95% | 1.21% | -0.40% | 0.72% | |
| NZD | 2.45% | -1.48% | -0.03% | 1.27% | 1.68% | 0.40% | 1.12% | |
| CHF | 1.36% | -2.61% | -1.15% | 0.21% | 0.58% | -0.72% | -1.12% |
The heat map shows percentage changes of major currencies against each other. The base currency is picked from the left column, while the quote currency is picked from the top row. For example, if you pick the Euro from the left column and move along the horizontal line to the US Dollar, the percentage change displayed in the box will represent EUR (base)/USD (quote).
The US Dollar (USD) remained under heavy selling pressure midweek despite the upbeat ISM Services Purchasing Managers Index (PMI) report for February. News of US President Donald Trump granting the US automative industry a one-month exemption from 25% tariffs imposed on Canada and Mexico allowed the risk mood to improve and forced the USD to continue to weaken.
Later in the day, the European Central Bank (ECB) will announce monetary policy decisions and publish the revised macroeconomic projections. Markets widely expect the ECB to lower key rates by 25 basis points (bps).
A downward revision to inflation and growth expectations could cause investors to price in a continuation of policy easing and open the door for the Euro to correct lower. Market participants will also pay close attention to comments from ECB President Christine Lagarde. In case Lagarde adopts a cautious tone on additional rate cuts, citing the uncertainty surrounding the EU-US trade relations, the Euro could hold its ground.
The US economic calendar will feature the weekly Initial Jobless Claims data. Investors, however, could ignore this data ahead of Friday’s Nonfarm Payrolls (NFP) report.
The Relative Strength Index (RSI) indicator on the 4-hour chart climbed above 80, reflecting extremely overbought conditions for EUR/USD in the near term. On a bullish note, the pair made a daily close above the 200-day Simple Moving Average (SMA), currently located at 1.0720, for the first time in four months.
On the downside, 1.0760 (static level) aligns as interim support before 1.0720 (200-day SMA) and 1.0700 (static level, round level). Looking north, first resistance could be spotted at 1.0900 (static level, round level) ahead of 1.0940 (static level from November).
The European Central Bank (ECB) in Frankfurt, Germany, is the reserve bank for the Eurozone. The ECB sets interest rates and manages monetary policy for the region. The ECB primary mandate is to maintain price stability, which means keeping inflation at around 2%. Its primary tool for achieving this is by raising or lowering interest rates. Relatively high interest rates will usually result in a stronger Euro and vice versa. The ECB Governing Council makes monetary policy decisions at meetings held eight times a year. Decisions are made by heads of the Eurozone national banks and six permanent members, including the President of the ECB, Christine Lagarde.
In extreme situations, the European Central Bank can enact a policy tool called Quantitative Easing. QE is the process by which the ECB prints Euros and uses them to buy assets – usually government or corporate bonds – from banks and other financial institutions. QE usually results in a weaker Euro. QE is a last resort when simply lowering interest rates is unlikely to achieve the objective of price stability. The ECB used it during the Great Financial Crisis in 2009-11, in 2015 when inflation remained stubbornly low, as well as during the covid pandemic.
Quantitative tightening (QT) is the reverse of QE. It is undertaken after QE when an economic recovery is underway and inflation starts rising. Whilst in QE the European Central Bank (ECB) purchases government and corporate bonds from financial institutions to provide them with liquidity, in QT the ECB stops buying more bonds, and stops reinvesting the principal maturing on the bonds it already holds. It is usually positive (or bullish) for the Euro.
Copper price confirmed its surrender to the previously suggested positivity by settling within the bullish channel frequently and surpassing 4.6800$ barrier now, to notice the beginning of recording the positive targets by touching 4.7800$ now.
The continuous positive momentum provided by the major indicators will increase the efficiency of the bullish track, to expect attacking 4.8100$ recorded high soon, while surpassing it will start targeting new positive stations by rallying towards 4.9100$ and face the bullish channel’s resistance line.
The expected trading range for today is between 4.6800$ and 4.9100$
Trend forecast: Bullish
Copper price confirmed its surrender to the previously suggested positivity by settling within the bullish channel frequently and surpassing 4.6800$ barrier now, to notice the beginning of recording the positive targets by touching 4.7800$ now.
The continuous positive momentum provided by the major indicators will increase the efficiency of the bullish track, to expect attacking 4.8100$ recorded high soon, while surpassing it will start targeting new positive stations by rallying towards 4.9100$ and face the bullish channel’s resistance line.
The expected trading range for today is between 4.6800$ and 4.9100$
Trend forecast: Bullish