The main category of Forex News.
You can use the search box below to find what you need.
[wd_asp id=1]
The main category of Forex News.
You can use the search box below to find what you need.
[wd_asp id=1]
Silver (XAG/USD) attracts some sellers during the Asian session on Thursday and erodes a part of its weekly gains registered over the past three days. The white metal currently trades above mid-$32.00s, down 0.35% for the day, though the near-term bias seems tilted in favor of bullish traders and supports prospects for a further appreciating move.
From a technical perspective, the XAG/USD showed some resilience below the 100-day Exponential Moving Average (EMA) last Friday. Moreover, oscillators on the daily chart have again started gaining positive traction on the daily chart and validate the near-term constructive outlook for the commodity. Hence, a subsequent strength towards the $33.00 mark, en route to the February monthly swing high, around the $33.40 area, looks like a distinct possibility.
The next relevant hurdle is pegged near the $33.60-$33.70 region, above which the XAG/USD could aim to reclaim the $34.00 round figure and climb further towards the $34.50-$34.55 zone. The momentum could extend further towards the highest level since October 2012, closer to the $35.00 psychological mark touched in October 2024.
On the flip side, the $32.30-$32.25 horizontal resistance breakpoint now seems to protect the immediate downside ahead of the $32.00 mark. This is followed by the $31.80 support, below which the XAG/USD could fall to the $31.25-$31.20 region before dropping to the 100-day EMA, currently pegged near the $31.10-$31.00 area. Some follow-through selling below last week’s swing low, around the $30.80 area, would shift the bias in favor of bearish traders.
Silver is a precious metal highly traded among investors. It has been historically used as a store of value and a medium of exchange. Although less popular than Gold, traders may turn to Silver to diversify their investment portfolio, for its intrinsic value or as a potential hedge during high-inflation periods. Investors can buy physical Silver, in coins or in bars, or trade it through vehicles such as Exchange Traded Funds, which track its price on international markets.
Silver prices can move due to a wide range of factors. Geopolitical instability or fears of a deep recession can make Silver price escalate due to its safe-haven status, although to a lesser extent than Gold’s. As a yieldless asset, Silver tends to rise with lower interest rates. Its moves also depend on how the US Dollar (USD) behaves as the asset is priced in dollars (XAG/USD). A strong Dollar tends to keep the price of Silver at bay, whereas a weaker Dollar is likely to propel prices up. Other factors such as investment demand, mining supply – Silver is much more abundant than Gold – and recycling rates can also affect prices.
Silver is widely used in industry, particularly in sectors such as electronics or solar energy, as it has one of the highest electric conductivity of all metals – more than Copper and Gold. A surge in demand can increase prices, while a decline tends to lower them. Dynamics in the US, Chinese and Indian economies can also contribute to price swings: for the US and particularly China, their big industrial sectors use Silver in various processes; in India, consumers’ demand for the precious metal for jewellery also plays a key role in setting prices.
Silver prices tend to follow Gold’s moves. When Gold prices rise, Silver typically follows suit, as their status as safe-haven assets is similar. The Gold/Silver ratio, which shows the number of ounces of Silver needed to equal the value of one ounce of Gold, may help to determine the relative valuation between both metals. Some investors may consider a high ratio as an indicator that Silver is undervalued, or Gold is overvalued. On the contrary, a low ratio might suggest that Gold is undervalued relative to Silver.
Copper price confirmed its surrender to the previously suggested positivity by settling within the bullish channel frequently and surpassing 4.6800$ barrier now, to notice the beginning of recording the positive targets by touching 4.7800$ now.
The continuous positive momentum provided by the major indicators will increase the efficiency of the bullish track, to expect attacking 4.8100$ recorded high soon, while surpassing it will start targeting new positive stations by rallying towards 4.9100$ and face the bullish channel’s resistance line.
The expected trading range for today is between 4.6800$ and 4.9100$
Trend forecast: Bullish
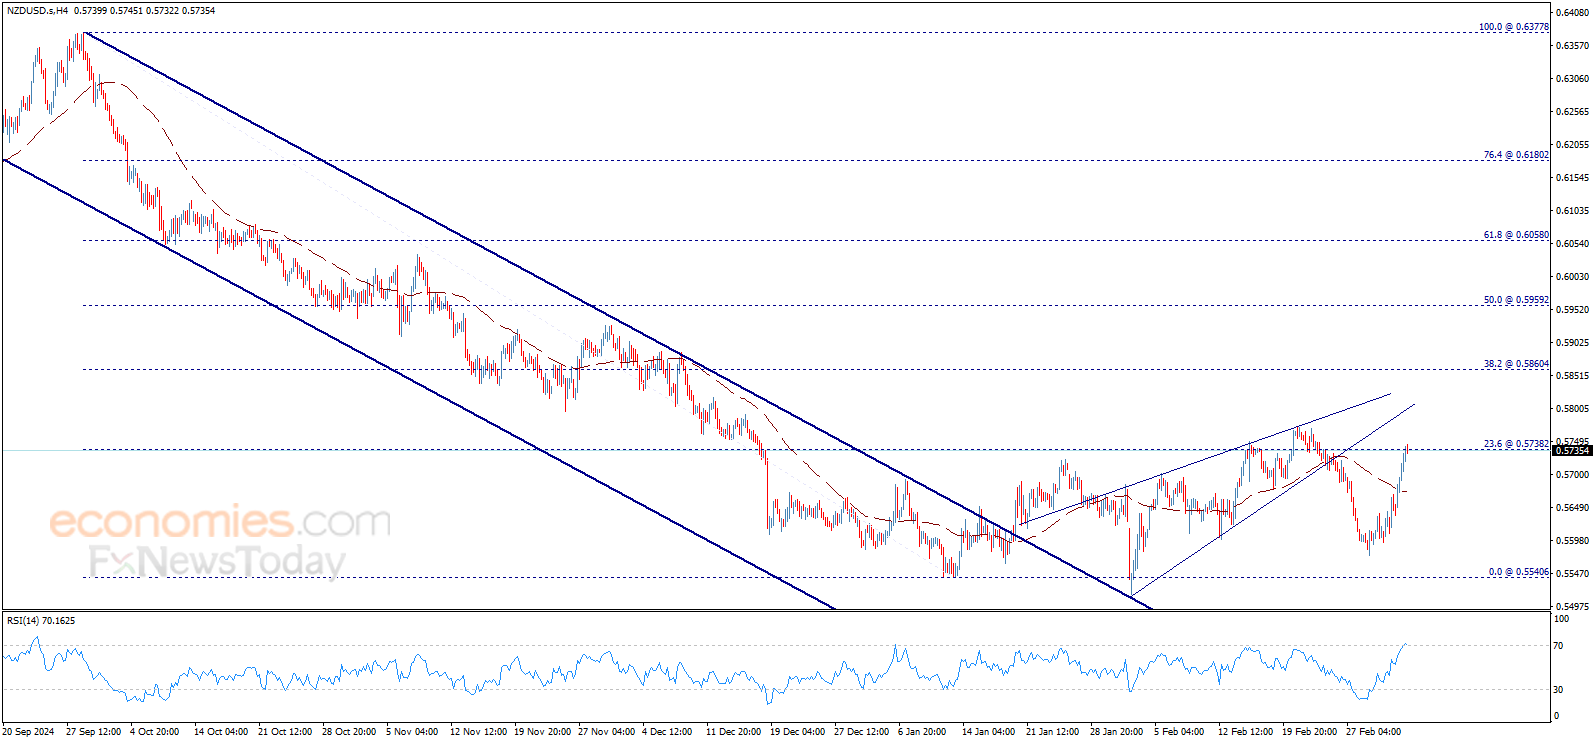
The NZDUSD price provided clear positive trades yesterday, as it breached 0.5655$ level to reach the key resistance 0.5738$ and settle around it, to hint the attempt to return to the correctional bullish track, but we notice that the RSI lost its positive momentum and might push the price to decline again.
To get our more detailed analysis and 100% accurate signals provided by Best Trading Signal, subscribe to Economies.com VIP Club through the link below!
GBP/USD extended its rally into a third consecutive day on Wednesday and gained nearly 0.8%. The pair is already up about 2.5% this week as it trades at its highest level since November, above 1.2900.
The table below shows the percentage change of British Pound (GBP) against listed major currencies this week. British Pound was the strongest against the US Dollar.
| USD | EUR | GBP | JPY | CAD | AUD | NZD | CHF | |
|---|---|---|---|---|---|---|---|---|
| USD | -3.95% | -2.47% | -1.12% | -0.76% | -2.05% | -2.34% | -1.29% | |
| EUR | 3.95% | 1.43% | 2.72% | 3.13% | 1.88% | 1.48% | 2.59% | |
| GBP | 2.47% | -1.43% | 1.38% | 1.68% | 0.44% | 0.05% | 1.14% | |
| JPY | 1.12% | -2.72% | -1.38% | 0.56% | -0.90% | -1.21% | -0.19% | |
| CAD | 0.76% | -3.13% | -1.68% | -0.56% | -1.14% | -1.60% | -0.53% | |
| AUD | 2.05% | -1.88% | -0.44% | 0.90% | 1.14% | -0.39% | 0.69% | |
| NZD | 2.34% | -1.48% | -0.05% | 1.21% | 1.60% | 0.39% | 1.09% | |
| CHF | 1.29% | -2.59% | -1.14% | 0.19% | 0.53% | -0.69% | -1.09% |
The heat map shows percentage changes of major currencies against each other. The base currency is picked from the left column, while the quote currency is picked from the top row. For example, if you pick the British Pound from the left column and move along the horizontal line to the US Dollar, the percentage change displayed in the box will represent GBP (base)/USD (quote).
The positive shift seen in risk mood forced the US Dollar (USD) to stay under pressure midweek, allowing GBP/USD to gather further bullish momentum. News of US President Donald Trump granting the US automative industry a one-month exemption from 25% tariffs imposed on Canada and Mexico, and planning to do the same for some agricultural products, helped the risk mood improve on Wednesday.
In the meantime, Pound Sterling also benefitted from hawkish Bank of England (BoE) commentary. While testifying before the UK Treasury Select Committee on Wednesday, BoE policymaker Megan Greene said it is appropriate to maintain a cautious and gradual approach to removing monetary restrictiveness. “The evidence points against more rapid cuts in the bank rate for me,” Greene added.
In the second half of the day, the US Department of Labor will publish the weekly Initial Jobless Claims data. Markets expect the number of first-time applications for unemployment benefits to decline to 235,000 from 242,000. A bigger-than-expected drop in this data could support the USD with the immediate reaction. Investors, however, could refrain from taking large positions ahead of Friday’s highly-anticipated February employment report.
The Relative Strength Index (RSI) indicator on the daily chart holds near 80 and GBP/USD trades above the upper limit of the ascending regression channel, highlighting overbought conditions.
On the downside, 1.2870 (upper limit of the ascending channel) aligns as first support before 1.2800 (200-day Simple Moving Average) and 1.2750 (mid-point of the ascending channel). Looking north, first resistance could be seen at 1.3000 (static level, round level) before 1.3040 (static level from November).
The Pound Sterling (GBP) is the oldest currency in the world (886 AD) and the official currency of the United Kingdom. It is the fourth most traded unit for foreign exchange (FX) in the world, accounting for 12% of all transactions, averaging $630 billion a day, according to 2022 data. Its key trading pairs are GBP/USD, also known as ‘Cable’, which accounts for 11% of FX, GBP/JPY, or the ‘Dragon’ as it is known by traders (3%), and EUR/GBP (2%). The Pound Sterling is issued by the Bank of England (BoE).
The single most important factor influencing the value of the Pound Sterling is monetary policy decided by the Bank of England. The BoE bases its decisions on whether it has achieved its primary goal of “price stability” – a steady inflation rate of around 2%. Its primary tool for achieving this is the adjustment of interest rates. When inflation is too high, the BoE will try to rein it in by raising interest rates, making it more expensive for people and businesses to access credit. This is generally positive for GBP, as higher interest rates make the UK a more attractive place for global investors to park their money. When inflation falls too low it is a sign economic growth is slowing. In this scenario, the BoE will consider lowering interest rates to cheapen credit so businesses will borrow more to invest in growth-generating projects.
Data releases gauge the health of the economy and can impact the value of the Pound Sterling. Indicators such as GDP, Manufacturing and Services PMIs, and employment can all influence the direction of the GBP. A strong economy is good for Sterling. Not only does it attract more foreign investment but it may encourage the BoE to put up interest rates, which will directly strengthen GBP. Otherwise, if economic data is weak, the Pound Sterling is likely to fall.
Another significant data release for the Pound Sterling is the Trade Balance. This indicator measures the difference between what a country earns from its exports and what it spends on imports over a given period. If a country produces highly sought-after exports, its currency will benefit purely from the extra demand created from foreign buyers seeking to purchase these goods. Therefore, a positive net Trade Balance strengthens a currency and vice versa for a negative balance.
Oil prices will likely remain around current levels or even lower this year, analysts and economists in the monthly Reuters poll said last week.
Sufficient oil supply and spare capacity within the OPEC+ group will be enough to keep prices in the low $70s per barrel, the experts said.
Supply shocks would be balanced out with the 5 million barrels per day (bpd) of spare capacity that OPEC+ currently has, mostly within the Middle Eastern producers in OPEC.
Major trade and geopolitical developments since last week are likely to put additional downward pressure on oil prices—the tariffs on Canada and Mexico and the higher tariff on Chinese imports into the U.S., and the possibility of some eased sanctions on Russia.
The four dozen analysts participating in the Reuters poll last week saw Brent Crude prices averaging $74.63 per barrel in 2025, slightly higher compared to the forecast of $74.57 in January. For WTI Crude, analysts expect an average 2025 price of $70.66 per barrel, up from $70.40 in January.
At the time the survey was carried out, oil prices were more or less trading around these levels.
But early this week, oil slumped after the Trump Administration confirmed that tariffs on Canada and Mexico are going ahead as planned on March 4, and the tariff on Chinese goods is lifted to 20% from 10%. Canada and Mexico tariffs are at 25%, with Canadian energy facing a lower, 10%, import tariff.
Economic Fallout from Tariffs
On the first trading day of March, major Wall Street indexes turned sharply lower after the Trump Administration announced that the tariffs on Canada and Mexico, and higher levies on China are going into effect on Tuesday.
The S&P 500 index fell by nearly 2% for the steepest one-day drop so far this year. The broad-based index has erased nearly all the 6% gain since Election Day and is now only 1% higher compared to early November when President Donald Trump was elected. The Dow Jones Industrial Average (DJIA) slumped by 1.5%, and the Nasdaq composite dipped by 2.6%.
The rally in the weeks since November has been largely due to hopes that the Trump Administration would boost U.S. businesses and the economy.
But tariffs could undermine the growth plans of many businesses, and the economy is likely to slow down, analysts say.
A weakening economy, the world’s largest at that, could dampen oil demand in the U.S. and globally—that’s why the market hasn’t been very bullish about oil prices in recent weeks.
Some estimates have even started to point to the U.S. economy contracting in the first quarter. The GDPNow model of Atlanta Fed, not an official forecast but a running estimate of real GDP growth based on available economic data, shows a forecast of real annual GDP growth for Q1 at a negative -2.8% on March 3, down from a -1.5% forecast on February 28. The estimate was revised down after releases from the US Census Bureau and the Institute for Supply Management. The GDPNow forecast of first-quarter real personal consumption expenditures growth and real private fixed investment growth fell from 1.3% and 3.5%, respectively, to 0.0% and 0.1%.
Supply and Demand Uncertainties
Amid all the tariff noise, forecasters have not downgraded—yet—their estimates of global oil demand growth this year. Demand is generally expected to rise by between 1 million bpd and 1.4 million bpd, with OPEC being the most bullish with 1.4 million bpd growth projection for both 2025 and 2026.
The “healthier oil market outlook”, OPEC said on Monday, allowed the OPEC+ producers to “proceed with a gradual and flexible return of the 2.2 mbd voluntary adjustments starting on 1st April, 2025, while remaining adaptable to evolving conditions.”
Initially, OPEC+ will return 138,000 bpd to the market in April, the group confirmed this week, but noted that the increase may be paused or reversed subject to market conditions.
The gradual return of OPEC+ supply and the expected non-OPEC+ output growth this year are set to keep oil from price spikes, analysts say.
The U.S. “maximum pressure” campaign on Iran with the goal to reduce Iranian oil exports to zero could be offset by lower demand growth in case of economic downturn and potential easing of some U.S. sanctions on Russia as the Trump Administration pivoted from supporting Ukraine to siding with Moscow about possible pathways to end the war.
Risk-Off Oil Market Sentiment
With all the unknowns about the tariff fallout on economies and oil trade flows due to sanctions being tightened on some and eased on others, money managers and other hedge funds are currently in a risk-off mood and are dumping bullish positions in the two most traded petroleum futures contracts, Brent and WTI.
In the week to February 25, selling of crude oil was “particularly aggressive,” Ole Hansen, Head of Commodity Strategy at Saxo Bank, said on Monday in a commentary on the latest Commitment of Traders report.
The U.S. benchmark contract, WTI Crude, saw the biggest selling spree, not only in the latest reporting week, but also in the past five weeks.
The net long position – the difference between bullish and bearish bets – in WTI slumped to the lowest level in nearly 15 years, at 67,600 contracts at end-February, down from 250,000 contracts hedge funds held as of January 21.
“During this five-week period, the combined net long in WTI (CME and ICE) and Brent has almost halved to 260k contracts, as the technical outlook continued to deteriorate amid worries about a global trade war’s impact on demand and OPEC+ considers when to start tapering production cuts,” Hansen said.
By Tsvetana Paraskova for Oilprice.com
More Top Reads From Oilprice.com
Palo Alto Networks’ stock price (PANW) rose in the intraday levels, amid the dominance of the main upward trend in the medium term, as a positive divergence formed in the RSI after reaching oversold levels compared to the stock’s movements, sending out positive signals, but the price is hurt by negative pressure from the 50-day SMA, which could curb upcoming gains.
Therefore we expect the price to rise and target the pivotal resistance of $208.40, provided the support of $178.80 holds on.
Trend forecast for today: Likely Bullish
XAU/USD trades near a fresh weekly high of $2,929.65, with higher highs in sight. The bright metal benefited from the broad US Dollar’s (USD) weakness, the latter affected by tepid United States (US) data and President Donald Trump’s massive tariffs on trade partners.
President Trump addressed Congress late on Tuesday and played down the potential negative effects of his latest round of tariffs. “. There’ll be a little disturbance, but we’re okay with that. It won’t be much,” Trump said, adding that reciprocal tariffs on trading partners will come into effect on April 2
Still, US Commerce Secretary Howard Lutnick suggested Trump’s administration may reduce or even roll back tariffs on the two neighbouring countries, spurring risk appetite throughout the first half of the day and harming the USD.
The Greenback fell further after the release of the US ADP Employment Change report, showing that the private sector added 77K new positions in February, much worse than the previous 183K or the expected 140K. The ISM Services Purchasing Managers’ Index (PMI), on the other contrary, jumped to 53.5 in February from 52.8 in the previous month while surpassing expectations of 52.6.
The focus now shifts to the European Central Bank (ECB) expected to deliver another 25 basis points (bps) interest rates cut when it announces its decision on monetary policy on Thursday. Other than that, investors will keep an eye on trade-war developments.
The daily chart for XAU/USD shows it trades around its daily opening, while an intraday dip was quickly reverted, suggesting buyers are taking advantage of dips. The same chart shows Gold develops above all its moving averages, with a flat 20 Simple Moving Average (SMA) providing near-term support at around $2,906.25. Technical indicators, in the meantime, have turned directionless, with the Momentum indicator stuck around its 100 level.
The near-term picture shows the risk skews to the upside. In the 4-hour chart, the XAU/USD pair is holding at the upper end of its recent range while advancing above all its moving averages. A bullish 20 SMA provides intraday support in the $2,890 area while advancing below a still flat 100 SMA. Finally, technical indicators turned firmly north within positive levels, reflecting persistent buying interest.
Support levels: 2,894.25 2,876.90 2,858.70
Resistance levels: 2,927.90 2,941.40 2,956.10
If the $4.55 price level is exceeded, then natural gas could reach the next higher target zone around $4.70 to $4.72. Subsequently, the 38.2% Fibonacci retracement of the full decline that began from the 2022 peak of $10.03 is at $4.77. Since that measurement is based on a long-term pattern, it is potentially significant with a good chance that strong resistance might be seen there.
The advance from the late-January swing low of $2.99 is in its second leg up following a clear test of support on Monday at the day’s low of $3.74. That low generated a higher swing low. There is the confluence of several indicators identifying the $3.74 price zone as potentially significant support. Given the sharp advance since that swing low. Including a breakout to a new trend high yesterday, natural gas seems to be indicating it may go higher and possibly break out to a new trend high.
When adding a rising ABCD pattern (purple) to the current advance, it shows a potential initial target at the 78.6% extension of $4.93. Whether it is reached or not, the ABCD pattern shows the potential for higher prices. Possible targets from the ABCD pattern are identified when there is price symmetry between the CD leg of the pattern and the AB leg, or a harmonic relationship between the two swings. The targets identify potential resistance levels.
Alternatively, a decline below today’s low of $4.23 will show short-term weakness that could lead to a lower pullback to test support levels. Tuesday’s low at $4.06 could see support and if it fails, a test of the 20-Day MA at $3.88 currently, becomes possible.
For a look at all of today’s economic events, check out our economic calendar.
March 5, 2025 – Written by Frank Davies
STORY LINK Pound to Euro Forecast: GBP Slips vs EUR amid Eurozone Economic Optimism
Pound Sterling (EUR) weakened against the Euro (EUR) on Wednesday as the common currency gained strength from positive economic news.
At the time of writing, the Pound Euro (GBP/EUR) exchange rate was trading at around €1.2002, down roughly 0.4%from Wednesday’s opening levels.
On Wednesday, the Euro (EUR) rose against most of its counterparts, supported by news that the anticipated members of Germany’s next coalition have reached a deal on a debt brake.
The Euro also benefited from a weakening US Dollar, due to their inverse relationship.
Furthermore, despite a mixed set of economic data from the Eurozone, including a worse-than-expected services PMI and a better-than-expected PPI release, the single currency maintained its strength.
On Wednesday, the Pound (GBP) remained resilient against most of its major peers after the release of the UK’s latest services PMI.
The finalised index for February remained in expansion territory,(a reading above 50) with a reading of 51, up from 50.8, though slightly below the expected 51.1.

Despite this, Sterling held its strength and even made slight gains against some of its counterparts.
Looking ahead to Thursday, the primary factor influencing the Pound Euro exchange rate will likely be the European Central Bank’s (ECB) upcoming interest rate decision.
The ECB is widely anticipated to cut interest rates by 25 basis points. However, if this rate cut is accompanied by dovish forward guidance, indicating a more cautious stance on future monetary policy, the Euro could
weaken as the trading session progresses.
On the other hand, the Pound may lack a clear direction on Thursday, as there is no scheduled UK economic data to provide guidance. This could lead to Sterling trading in a more rangebound manner, influenced more
by market sentiment and external factors.
International Money Transfer? Ask our resident FX expert a money transfer question or try John’s new, free, no-obligation personal service! ,where he helps every step of the way,
ensuring you get the best exchange rates on your currency requirements.
TAGS: Pound Euro Forecasts
Silver price (XAG/USD) struggles to extend its upside above the key resistance of $32.40 in Wednesday’s North American session. The white metal remains broadly firm as United States (US) President Donald Trump-led-global trade war has intensified due to counter-tariffs on China, Canada, and Mexico.
Escalating trade war tensions have increased uncertainty over the global economic outlook. Such a scenario improves the appeal of precious metals such as Silver.
Meanwhile, a sharp sell-off in the US Dollar (USD) is also a favorable scenario for the Silver price. The US Dollar Index (DXY), which tracks the Greenback’s value against six major currencies, plunges to near 104.50, the lowest level seen in almost four months. The Greenback weakens as investors worry about the US economic outlook due to escalating tariff war.
During North American trading hours on Wednesday, weak US ADP Employment Change data for February has also weighed on the US Dollar. The ADP reported that private employers added 77K fresh workers, lower than estimates of 140K and the former release of 186K. Soft labor demand in the US private sector is expected to prompt Fed dovish bets, which had already increased lately.
According to the CME FedWatch tool, the likelihood for the Fed to reduce interest rates in June has increased to 85% from 70% recorded a week ago.
Silver price moves higher to near the key resistance of $32.40 plotted from the December 12 high. The asset climbs above the 20-day Exponential Moving Average (EMA), which trades around $31.85.
The 14-day Relative Strength Index (RSI) oscillates inside the 40.00-60.00 range, suggesting a sideways trend.
Looking down, the upward-sloping trendline from the August 8 low of $26.45 will act as key support for the Silver price around $30.00. While, the February 14 high of $33.40 will be the key barrier.
Silver is a precious metal highly traded among investors. It has been historically used as a store of value and a medium of exchange. Although less popular than Gold, traders may turn to Silver to diversify their investment portfolio, for its intrinsic value or as a potential hedge during high-inflation periods. Investors can buy physical Silver, in coins or in bars, or trade it through vehicles such as Exchange Traded Funds, which track its price on international markets.
Silver prices can move due to a wide range of factors. Geopolitical instability or fears of a deep recession can make Silver price escalate due to its safe-haven status, although to a lesser extent than Gold’s. As a yieldless asset, Silver tends to rise with lower interest rates. Its moves also depend on how the US Dollar (USD) behaves as the asset is priced in dollars (XAG/USD). A strong Dollar tends to keep the price of Silver at bay, whereas a weaker Dollar is likely to propel prices up. Other factors such as investment demand, mining supply – Silver is much more abundant than Gold – and recycling rates can also affect prices.
Silver is widely used in industry, particularly in sectors such as electronics or solar energy, as it has one of the highest electric conductivity of all metals – more than Copper and Gold. A surge in demand can increase prices, while a decline tends to lower them. Dynamics in the US, Chinese and Indian economies can also contribute to price swings: for the US and particularly China, their big industrial sectors use Silver in various processes; in India, consumers’ demand for the precious metal for jewellery also plays a key role in setting prices.
Silver prices tend to follow Gold’s moves. When Gold prices rise, Silver typically follows suit, as their status as safe-haven assets is similar. The Gold/Silver ratio, which shows the number of ounces of Silver needed to equal the value of one ounce of Gold, may help to determine the relative valuation between both metals. Some investors may consider a high ratio as an indicator that Silver is undervalued, or Gold is overvalued. On the contrary, a low ratio might suggest that Gold is undervalued relative to Silver.