The main category of Forex News.
You can use the search box below to find what you need.
[wd_asp id=1]
The main category of Forex News.
You can use the search box below to find what you need.
[wd_asp id=1]
Gold price (XAU/USD) attracts some buyers to around $2,870 during the early Asian session on Monday. The uncertainty and ongoing Russia and Ukraine conflicts continue to underpin the precious metal. Traders will keep an eye on the US February ISM Manufacturing Purchasing Managers Index (PMI), which is due later on Monday.
According to the state RIA news agency, an oil refinery in the Russian city of Ufa has caught fire. The regional branch of Russia’s emergency ministry reported that residents in nearby areas face no danger from the blaze. However, the cause of the fire is yet to be determined.
Over the weekend, US President Donald Trump criticized Ukrainian President Volodymyr Zelenskyy for being “disrespectful” and canceled the signing of a minerals deal that would have brought Ukraine closer to resolving its conflict with Russia. Investors will closely monitor the developments surrounding Russia’s headlines. Any signs of escalating tensions could boost the Gold price, a traditional safe-haven asset.
On the other hand, the renewed US Dollar (USD) demand might cap the upside for the yellow metal. US inflation data came in line with expectations, suggesting the US Federal Reserve (Fed) might adopt a cautious stance on further rate cuts.
The US Personal Consumption Expenditures (PCE) Price Index climbed 2.5% YoY in January, compared to 2.6% in December, the US Bureau of Economic Analysis reported on Friday. Meanwhile, the core PCE Price Index, which excludes volatile food and energy prices, climbed 2.6% on a yearly basis in January, down from 2.9% in December. Both figures came in line with market expectations.
Gold has played a key role in human’s history as it has been widely used as a store of value and medium of exchange. Currently, apart from its shine and usage for jewelry, the precious metal is widely seen as a safe-haven asset, meaning that it is considered a good investment during turbulent times. Gold is also widely seen as a hedge against inflation and against depreciating currencies as it doesn’t rely on any specific issuer or government.
Central banks are the biggest Gold holders. In their aim to support their currencies in turbulent times, central banks tend to diversify their reserves and buy Gold to improve the perceived strength of the economy and the currency. High Gold reserves can be a source of trust for a country’s solvency. Central banks added 1,136 tonnes of Gold worth around $70 billion to their reserves in 2022, according to data from the World Gold Council. This is the highest yearly purchase since records began. Central banks from emerging economies such as China, India and Turkey are quickly increasing their Gold reserves.
Gold has an inverse correlation with the US Dollar and US Treasuries, which are both major reserve and safe-haven assets. When the Dollar depreciates, Gold tends to rise, enabling investors and central banks to diversify their assets in turbulent times. Gold is also inversely correlated with risk assets. A rally in the stock market tends to weaken Gold price, while sell-offs in riskier markets tend to favor the precious metal.
The price can move due to a wide range of factors. Geopolitical instability or fears of a deep recession can quickly make Gold price escalate due to its safe-haven status. As a yield-less asset, Gold tends to rise with lower interest rates, while higher cost of money usually weighs down on the yellow metal. Still, most moves depend on how the US Dollar (USD) behaves as the asset is priced in dollars (XAU/USD). A strong Dollar tends to keep the price of Gold controlled, whereas a weaker Dollar is likely to push Gold prices up.
The AUDCAD price started to activate the previously waited negative track by crawling below 50% Fibonacci correction level at 0.9030 yesterday, surpassing the EMA50 to start targeting the negative stations by reaching 0.8970.
We notice stochastic attempt to crawl towards the oversold areas to increase the chances of gathering the negative momentum to ease the mission of targeting the target at 0.8940, while surpassing it will extend trades towards 0.8900 direct, to form the next main target for the current trades.
The expected trading range for today is between 0.8940 and 0.9010
Trend forecast: Bearish
The AUDCAD price started to activate the previously waited negative track by crawling below 50% Fibonacci correction level at 0.9030 yesterday, surpassing the EMA50 to start targeting the negative stations by reaching 0.8970.
We notice stochastic attempt to crawl towards the oversold areas to increase the chances of gathering the negative momentum to ease the mission of targeting the target at 0.8940, while surpassing it will extend trades towards 0.8900 direct, to form the next main target for the current trades.
The expected trading range for today is between 0.8940 and 0.9010
Trend forecast: Bearish
The AUDCAD price started to activate the previously waited negative track by crawling below 50% Fibonacci correction level at 0.9030 yesterday, surpassing the EMA50 to start targeting the negative stations by reaching 0.8970.
We notice stochastic attempt to crawl towards the oversold areas to increase the chances of gathering the negative momentum to ease the mission of targeting the target at 0.8940, while surpassing it will extend trades towards 0.8900 direct, to form the next main target for the current trades.
The expected trading range for today is between 0.8940 and 0.9010
Trend forecast: Bearish
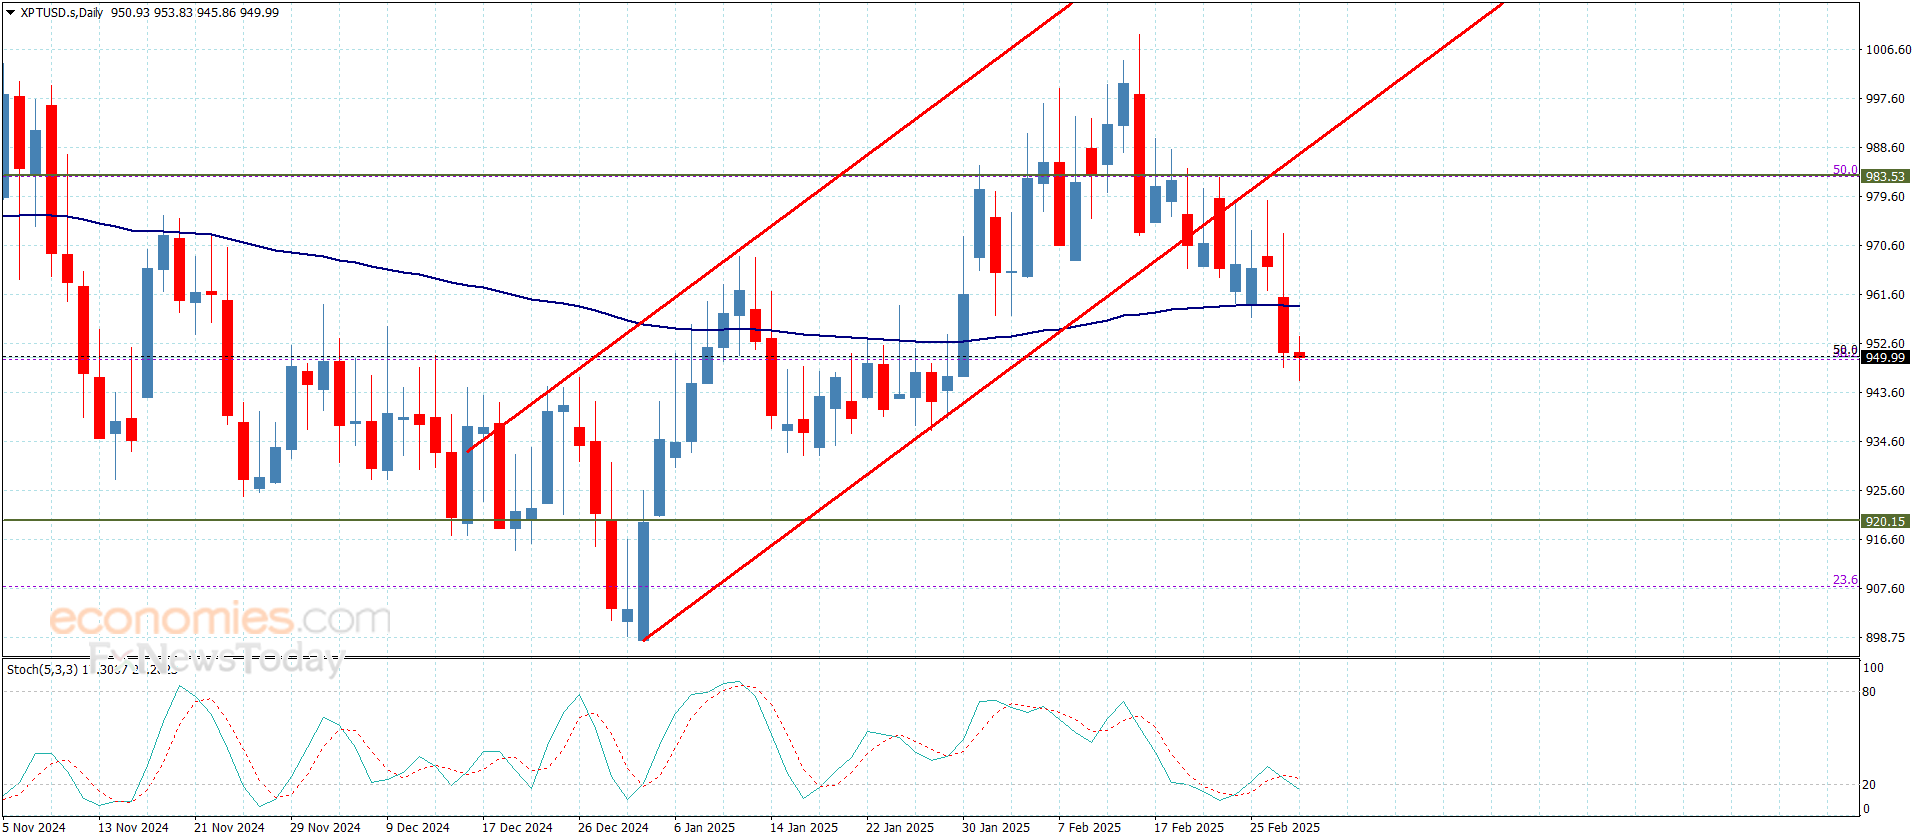
Platinum price resumed the negative attempts, surpassing the first target at 950.00$, confirming its preparation to provide more negative attempts on the near-term and medium-term basis.
Also, the EMA50 forms additional barrier now at 960.00$, and stochastic provides the negative momentum, to increase the chances of attacking 941.00$ level, while breaking it might extend losses towards 920.00$ on the near-term basis.
The expected trading range for today is between 941.00$ and 960.00$
Trend forecast: Bearish
Vietnam’s commodity markets are bracing for fluctuation as both coffee and pepper prices are forecasted for March 2, 2025. The latest updates indicate mixed trends, with coffee prices showing signs of instability and pepper prices experiencing a slight rebound.
According to the latest information from Giacaphe.com, as of March 1, 2025, the Robusta coffee prices on the London exchange have seen notable declines. Prices went down by $46 to $61 per ton, with May 2025 delivery prices settling at $5,330 per ton, and prices for subsequent deliveries also reflecting downward trends. Notably, the prices for July and September deliveries are recorded at $5,290 and $5,228 respectively. Conversely, the Arabica coffee market on New York experienced minor fluctuations, with prices peaking and dipping around 342.00 to 379.05 cents per pound, representing delicate balance amid broader market forces.
Meanwhile, the domestic coffee market has also seen price adjustments. Reports suggest coffee prices across the Central Highlands dropped slightly by 500 đồng/kg, resulting in average prices hovering around 130,000 đồng/kg. Specifically, prices are noted at 130,000 đồng/kg for Đắk Lắk, 128,000 đồng/kg for Lâm Đồng, and 130,000 đồng/kg for Gia Lai. This reflects market corrections following earlier price hikes.
Experts predict relative stability for March 2, with forecasts indicating prices are likely to maintain between 128,000 and 130,000 đồng/kg. A spokesperson from Giacaphe.com remarked, “Prices are expected to stabilize between 128,000 – 130,000 đồng/kg depending on the locality, with short-term decreases anticipated due to high supply pressures.” Overall, the potential of Robusta prices to decrease by about $100 to $150 per ton could loom over the market if demand does not rebound swiftly.
On the pepper front, price adjustments have been more favorable. Following previous declines, pepper prices have started to rebound, showing increases between 1,000 and 2,000 đồng/kg across various regions. The average purchase price for black pepper has reached around 158,000 đồng/kg, with notable rises reported from Đắk Nông and Bình Phước, where prices now stand at 159,000 and 158,000 đồng/kg respectively.
The Vietnam Pepper Association (VPSA) has indicated some challenges remain—specifically, delays due to adverse weather conditions impacting harvest schedules. “The import demand from the US, EU, and China remains subdued, partly due to depleted stockpiles from the previous harvest and delays of the new one,” noted the VPSA. This could influence future price dynamics as Vietnam approaches its harvest season.
Recent market activity, reflected through the Ministry of Industry and Trade analyses, points to rising export prices, providing hope for local producers and signaling potentially favorable market conditions amid global fluctuations. Export prices for Vietnamese black pepper are pegged at approximately 6,900 USD/ton, with white pepper accumulating prices around 9,900 USD/ton.
The global market dynamics remain volatile. Reports from the International Pepper Community (IPC) highlight contrasting performance among exporting nations. For example, Indonesia’s prices have seen declines; black pepper is quoted at 7,235 USD/ton, reflecting losses of up to $63 per ton, contrasting the unexpected increases from Malaysia, where prices surged by $200 per ton.
Forecasts suggest the pepper market will likely stabilize around these higher prices, with strategic moves on inventory management from local exporters to mitigate risks from overarching global trends expected to yield different impacts on the domestic market.
Looking forward, it is clear both coffee and pepper markets must navigate upcoming challenges tied to both climatic factors and global economic trends. With input from analysts and traders, farmers are advised to prepare for potential volatility, maintaining vigilance over price shifts as the year progresses. Both sectors, especially as the coffee harvest commences, could see significant impacts from foreign import interests, offering glimpse trajectories moving through 2025.
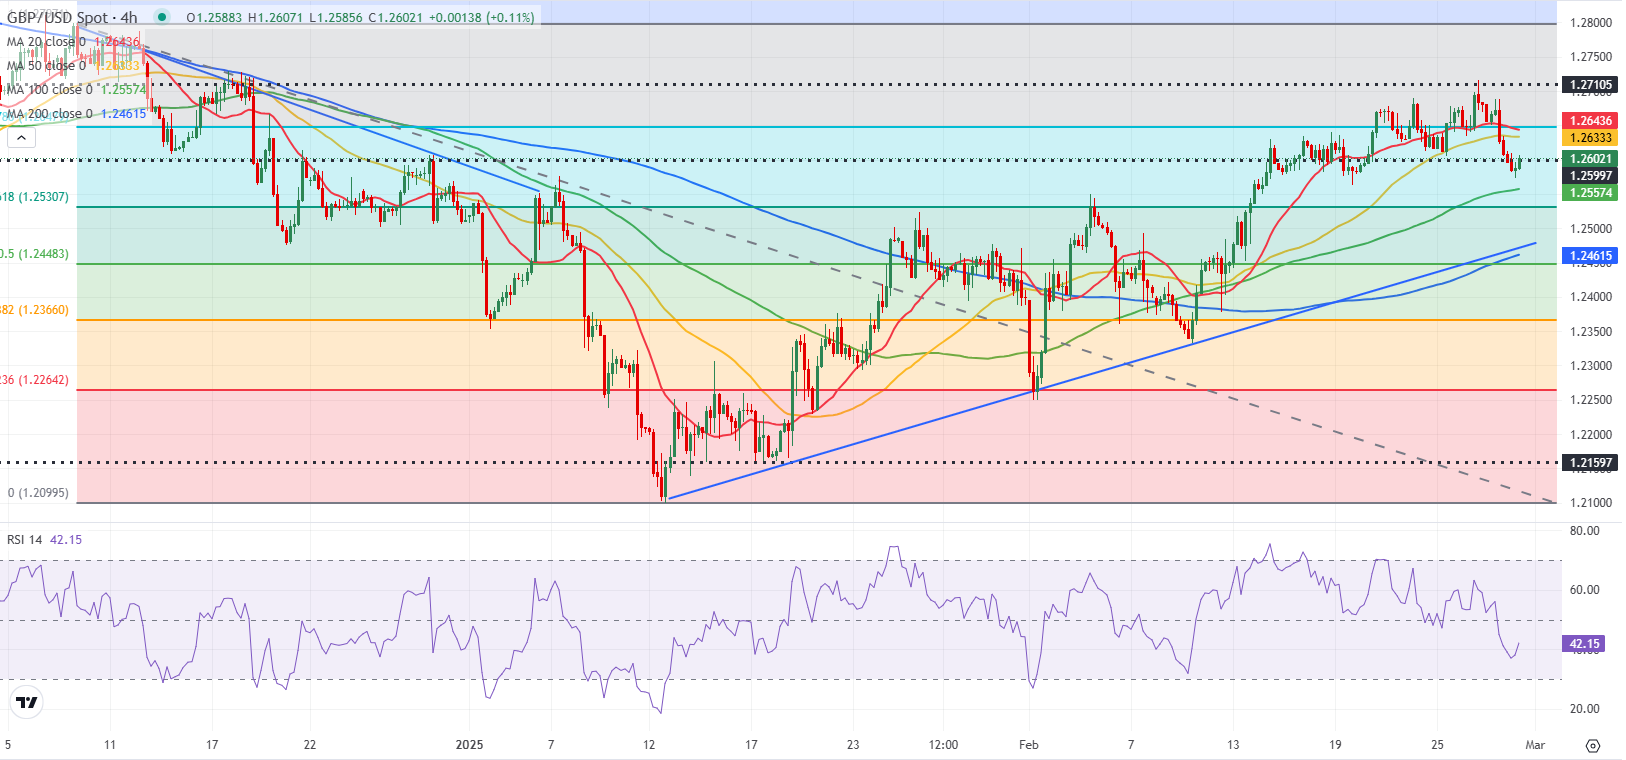
The Pound Sterling (GBP) extends its downside move to near 1.2570 against the US Dollar (USD) in Friday’s European session. The GBP/USD pair faces pressure as the US Dollar gains further amid a risk-off market mood. The US Dollar Index (DXY), which tracks the Greenback’s value against six major currencies, moves higher to 107.45.
Market participants are cautious as President Donald Trump has announced more levies on China and provided more clarification on the timeline for 25% import duties on Canada and Mexico and reciprocal tariffs. Read more…
GBP/USD seems to have entered a consolidation phase near 1.2600 after losing more than 0.5% on Thursday as investors move to the sidelines while waiting for January inflation data from the US.
The US Dollar (USD) benefited from safe-haven flows in the American session on Thursday and gathered strength against its major rivals. Read more…
Gold price settles at the waited target at 2868.80$, which represents 23.6% Fibonacci correction level for the rise from 2583.75$ to 2956.90$, and as we mentioned in our last technical update, breaking this level will push the price to achieve more bearish correction on the intraday and short-term basis.
For more: please follow us on Telegram channel.
Silver ended the week on a lower note, down almost 4%, as traders booked profits amid US recession jitters following the release of crucial US data. At the time of writing, the XAG/USD trades at $31.13, down 0.32%.
The grey metal had shown signs of consolidation after failing to decisively clear the $33.00 on a daily closing basis, which could’ve exacerbated a rally towards the $34.00 figure. Instead, XAG/USD spot price cleared the 100-day Simple Moving Average (SMA) at $31.20, opening the door to test the 50-day SMA at $30.89.
Although bears pushed prices lower, buyers reclaimed $31.00. Nevertheless, the Relative Strength Index (RSI) shows sellers are gathering momentum.
Therefore, XAG/USD’s first support would be the 50-day SMA at $30.89 on further weakness. A breach of the latter will expose the 200-day SMA at $30.47. If sellers conquer those two levels, the trend shifts downwards, and bears would be poised to challenge the January 27 daily through at $29.70.
Silver is a precious metal highly traded among investors. It has been historically used as a store of value and a medium of exchange. Although less popular than Gold, traders may turn to Silver to diversify their investment portfolio, for its intrinsic value or as a potential hedge during high-inflation periods. Investors can buy physical Silver, in coins or in bars, or trade it through vehicles such as Exchange Traded Funds, which track its price on international markets.
Silver prices can move due to a wide range of factors. Geopolitical instability or fears of a deep recession can make Silver price escalate due to its safe-haven status, although to a lesser extent than Gold’s. As a yieldless asset, Silver tends to rise with lower interest rates. Its moves also depend on how the US Dollar (USD) behaves as the asset is priced in dollars (XAG/USD). A strong Dollar tends to keep the price of Silver at bay, whereas a weaker Dollar is likely to propel prices up. Other factors such as investment demand, mining supply – Silver is much more abundant than Gold – and recycling rates can also affect prices.
Silver is widely used in industry, particularly in sectors such as electronics or solar energy, as it has one of the highest electric conductivity of all metals – more than Copper and Gold. A surge in demand can increase prices, while a decline tends to lower them. Dynamics in the US, Chinese and Indian economies can also contribute to price swings: for the US and particularly China, their big industrial sectors use Silver in various processes; in India, consumers’ demand for the precious metal for jewellery also plays a key role in setting prices.
Silver prices tend to follow Gold’s moves. When Gold prices rise, Silver typically follows suit, as their status as safe-haven assets is similar. The Gold/Silver ratio, which shows the number of ounces of Silver needed to equal the value of one ounce of Gold, may help to determine the relative valuation between both metals. Some investors may consider a high ratio as an indicator that Silver is undervalued, or Gold is overvalued. On the contrary, a low ratio might suggest that Gold is undervalued relative to Silver.
The EUR/JPY pair rallies to near 157.00 in the North American session on Friday. The pair strengthens as the Japanese Yen (JPY) is underperforming across the board after the release of the soft Tokyo Consumer Price Index (CPI) data for February.
The table below shows the percentage change of Japanese Yen (JPY) against listed major currencies today. Japanese Yen was the strongest against the New Zealand Dollar.
| USD | EUR | GBP | JPY | CAD | AUD | NZD | CHF | |
|---|---|---|---|---|---|---|---|---|
| USD | -0.08% | 0.06% | 0.66% | -0.16% | 0.31% | 0.52% | 0.31% | |
| EUR | 0.08% | 0.15% | 0.75% | -0.06% | 0.40% | 0.62% | 0.40% | |
| GBP | -0.06% | -0.15% | 0.59% | -0.22% | 0.25% | 0.46% | 0.24% | |
| JPY | -0.66% | -0.75% | -0.59% | -0.80% | -0.35% | -0.14% | -0.35% | |
| CAD | 0.16% | 0.06% | 0.22% | 0.80% | 0.46% | 0.68% | 0.46% | |
| AUD | -0.31% | -0.40% | -0.25% | 0.35% | -0.46% | 0.21% | -0.00% | |
| NZD | -0.52% | -0.62% | -0.46% | 0.14% | -0.68% | -0.21% | -0.22% | |
| CHF | -0.31% | -0.40% | -0.24% | 0.35% | -0.46% | 0.00% | 0.22% |
The heat map shows percentage changes of major currencies against each other. The base currency is picked from the left column, while the quote currency is picked from the top row. For example, if you pick the Japanese Yen from the left column and move along the horizontal line to the US Dollar, the percentage change displayed in the box will represent JPY (base)/USD (quote).
Statistics Bureau of Japan reported that the Tokyo headline CPI decelerated significantly to 2.9% from 3.4% in January. In the same period, the Tokyo CPI ex. Fresh Food rose by 2.2%, slower than estimates of 2.3% and the former release of 2.5%. Soft Tokyo CPI data is likely to weigh on market expectations that the Bank of Japan (BoJ) will raise interest rates again this year.
Meanwhile, the Euro (EUR) outperforms its major peers despite fears that United States (US) President Donald Trump’s tariff agenda will be unfavorable for the Eurozone economy. On Wednesday, Trump threatened to impose 25% tariffs on cars and other things imported from the Eurozone sooner.
On the domestic front, hotter-than-expected flash German Harmonized Index of Consumer Prices (HICP) data for February is unlikely to ease market expectations that the European Central Bank (ECB) will reduce its Deposit Facility rate by 25 basis points (bps) to 2.5% in the policy meeting on Thursday.
German HICP rose steadily by 2.8%, faster than estimates of 2.7% on year. Month-on-month HICP grew at a faster pace of 0.6% than expectations of 0.5%. In January, the underlying inflation data deflated by 0.2%.
EUR/JPY recovers strongly after revisiting an almost seven-month low of 155.15 on Friday. However, the near-term outlook of the cross is still bearish as the 20-day Exponential Moving Average (EMA) is sloping downwards to near 158.00.
The 14-day Relative Strength Index (RSI) bounced back to the 40.00-60.00 range, which indicates that bearish momentum has ended. However, the negative bias remains intact.
More recovery in the EUR/JPY pair above the February 25 high of 157.30 would allow it to gain further towards the 20-day EMA around 158.00, followed by the February 19 high of 159.14.
On the flip side, a downside move by the pair below the intraday low of 154.80 would expose it to the August 5 low of 154.40 and the 19-month low of 153.17.
The Japanese Yen (JPY) is one of the world’s most traded currencies. Its value is broadly determined by the performance of the Japanese economy, but more specifically by the Bank of Japan’s policy, the differential between Japanese and US bond yields, or risk sentiment among traders, among other factors.
One of the Bank of Japan’s mandates is currency control, so its moves are key for the Yen. The BoJ has directly intervened in currency markets sometimes, generally to lower the value of the Yen, although it refrains from doing it often due to political concerns of its main trading partners. The BoJ ultra-loose monetary policy between 2013 and 2024 caused the Yen to depreciate against its main currency peers due to an increasing policy divergence between the Bank of Japan and other main central banks. More recently, the gradually unwinding of this ultra-loose policy has given some support to the Yen.
Over the last decade, the BoJ’s stance of sticking to ultra-loose monetary policy has led to a widening policy divergence with other central banks, particularly with the US Federal Reserve. This supported a widening of the differential between the 10-year US and Japanese bonds, which favored the US Dollar against the Japanese Yen. The BoJ decision in 2024 to gradually abandon the ultra-loose policy, coupled with interest-rate cuts in other major central banks, is narrowing this differential.
The Japanese Yen is often seen as a safe-haven investment. This means that in times of market stress, investors are more likely to put their money in the Japanese currency due to its supposed reliability and stability. Turbulent times are likely to strengthen the Yen’s value against other currencies seen as more risky to invest in.