The main category of Forex News.
You can use the search box below to find what you need.
[wd_asp id=1]
The main category of Forex News.
You can use the search box below to find what you need.
[wd_asp id=1]
– Written by
John Cameron
STORY LINK Pound Sterling Forecast: GBP/USD Nears $1.32 ahead of Crucial US Payrolls
The Pound US Dollar (GBP/USD) exchange rate moved lower on Thursday, with escalating geopolitical tensions driving investors towards safer assets.
At the time of writing, GBP/USD was trading at $1.3212, having fallen by almost 0.4% over the course of the day.
The US Dollar (USD) strengthened on Thursday as rising geopolitical tensions and renewed concerns over oil prices prompted investors to seek the safety of the ‘Greenback’.
Market anxiety grew following a Ukrainian strike on a Russian oil facility, while US President Donald Trump threatened to ‘blow up’ Iran if negotiations failed to produce a favourable deal.
The developments fuelled demand for safe-haven assets.
The US Dollar maintained its gains into the afternoon, even after the latest ISM manufacturing PMI report fell short of expectations.
The index slipped to 54.5 in September from 54.6, missing forecasts of 55.
Get better rates and lower fees on your next international money transfer.
Compare TorFX with top UK banks in seconds and see how much you could save.
Nevertheless, the figures still indicated that US manufacturing activity expanded at a solid pace last month, despite the slight loss of momentum.
The Pound (GBP) struggled to gain traction on Thursday, as a lack of significant UK economic releases offered little to guide Sterling.
The day’s main data point was the final UK manufacturing PMI for September, which was revised down marginally to 51.9.
While this marked an improvement on August’s reading of 51.7, it fell short of the initial estimate of 52.
The modest downgrade did little to encourage demand for the Pound, while broader risk aversion added to the pressure on the increasingly risk-sensitive currency.
Attention turns to Friday’s US non-farm payrolls report, which could set the tone for the GBP/USD exchange rate heading into the weekend.

The US economy is forecast to have created 90,000 jobs in September, down sharply from August’s 162,000 but still a respectable result by recent standards.
A reading in line with expectations could provide modest support for the US Dollar.
However, a significant deviation from forecasts could trigger a sharper reaction.
Stronger-than-expected job growth may lift the ‘Greenback’, while a weaker result could send it lower as markets reassess the outlook for Federal Reserve interest rate hikes.
With little UK economic data due on Friday, the Pound is likely to take its cues from broader market sentiment and developments overseas.
International Money Transfer? Ask our resident FX expert a money transfer question or try John’s new, free, no-obligation personal service! ,where he helps every step of the way,
ensuring you get the best exchange rates on your currency requirements.
TAGS: Pound Dollar Forecasts
According to the latest IndexBox report on the global Coffee Creamer market, the market enters 2026 with broader demand fundamentals, more disciplined procurement behavior, and a more regionally diversified supply architecture.
The global coffee creamer market is undergoing a structural transformation as it moves toward 2035, shifting from a commoditized, volume-led category to one where value growth is increasingly driven by premiumization, plant-based innovation, and functional benefits. Historically anchored in powdered and liquid dairy formats sold through mainstream retail, the category now faces a widening bifurcation: a price-sensitive core under pressure from private label, and a fast-growing premium frontier where claims around health, clean-label ingredients, and barista-grade performance command higher margins.
This report provides a strategic analysis of the market from 2026 to 2035, examining demand drivers, segment dynamics, competitive intensity, and regional outlooks. It covers key trends such as the mainstreaming of dairy-free and lactose-free options, the rise of e-commerce and direct-to-consumer channels, and the evolving role of foodservice and office coffee service. The analysis is designed for brand owners, category managers, investors, and market entrants seeking a clear read on where growth sits, which brands control the category, and how pricing, promotion, and route-to-market shape commercial success. The forecast horizon extends to 2035, with historical context from 2012 to 2025.
The baseline scenario for the global coffee creamer market through 2035 anticipates moderate but steady value growth, with a compound annual growth rate (CAGR) of 4.2% from 2026 to 2035, and the market index reaching 152 by 2035 (2025=100). This outlook assumes continued premiumization in developed markets, gradual recovery in emerging economies, and sustained innovation in plant-based and functional creamers. Volume growth will be slower, particularly in North America and Western Europe, where per-capita consumption is mature and private label penetration is high.
However, value growth will be supported by consumers trading up to premium liquid creamers, barista-style products, and fortified options. In Asia-Pacific, rising coffee culture and urbanization will drive both volume and value, though local taste preferences and price sensitivity will shape product formats. The market will face headwinds from commodity price volatility, regulatory pressures on sugar and fat content, and intense competition from private label. Nevertheless, opportunities abound in clean-label, low-sugar, and high-protein creamers, as well as in e-commerce and foodservice channels.
The baseline scenario does not assume major disruptive events but recognizes that supply chain disruptions or economic downturns could alter the trajectory. Overall, the market is expected to remain resilient, with premiumization and plant-based innovation as the primary engines of value creation.
Supermarkets and hypermarkets remain the dominant channel for coffee creamer sales, accounting for the largest share of volume and value. In this segment, demand is driven by routine household purchases, with shoppers typically buying creamer as part of their regular grocery basket. The shelf space is increasingly divided between private label and branded products, with private label gaining ground in the value tier. However, premium and plant-based creamers are driving value growth, as consumers seek healthier and more sophisticated options. Retailers are responding by expanding their assortments of dairy-free and functional creamers, often placing them in dedicated health or natural sections.
Promotional activity is intense, particularly in the mainstream tier, where brands use price discounts and multi-buy offers to defend share. Looking ahead to 2035, the retail channel will remain critical, but its growth will be value-driven rather than volume-driven. The key demand-side indicators to watch include private-label penetration rates, the share of premium SKUs, and the velocity of plant-based products. Retailers’ ability to curate assortments that cater to diverse need states—from everyday value to indulgent premium—will determine their success. Current trend: Stable but shifting toward premium and plant-based.
Major trends: Expansion of plant-based and dairy-free creamer sets, Growth of private label in the value tier, Increased shelf space for functional and clean-label creamers, Promotional intensity in the mainstream tier, and Rise of multi-pack and single-serve formats.
Representative participants: Nestlé S.A, Danone S.A, FrieslandCampina, Lactalis Group, and Califia Farms.
The foodservice and office coffee service (OCS) segment is a vital channel for coffee creamer, encompassing restaurants, cafes, hotels, and workplace coffee stations. Demand here is driven by out-of-home coffee consumption, which has rebounded post-pandemic and continues to grow. In foodservice, creamer is often provided in single-serve pods, bulk liquid, or powdered formats, with operators seeking cost-effective yet quality solutions. The segment is witnessing a shift toward premium and plant-based creamers as consumers expect the same quality in cafes as they do at home. OCS providers are increasingly offering dairy-free and flavored creamers to cater to diverse workplace preferences.
The segment’s growth is tied to the overall health of the foodservice industry, which is expected to expand steadily through 2035, particularly in emerging markets. Key demand indicators include the number of coffee-serving establishments, office occupancy rates, and the adoption of premium creamer options in foodservice. Operators that can balance cost and quality while offering variety will capture share. However, this segment is also sensitive to economic cycles, as discretionary spending on out-of-home coffee can decline during downturns. Current trend: Recovering and innovating with premium options.
Major trends: Recovery of foodservice traffic post-pandemic, Adoption of plant-based creamers in cafes and restaurants, Growth of single-serve and portion-control formats, Premiumization in office coffee service, and Sustainability initiatives driving packaging changes.
Representative participants: Nestlé S.A, Danone S.A, Kerry Group, Cargill, Incorporated, and Arla Foods.
E-commerce and direct-to-consumer (DTC) channels are the fastest-growing route to market for coffee creamer, albeit from a smaller base. This segment is driven by convenience, discovery, and the ability to access niche products not available in local stores. Online shoppers for creamer tend to be younger, more health-conscious, and willing to pay a premium for specialty items such as barista-grade, organic, or functional creamers. Subscription models are gaining traction, particularly for liquid creamers that require regular replenishment. The segment’s growth is supported by the expansion of e-grocery platforms, improved cold-chain logistics, and social media marketing.
However, profitability is challenged by high customer acquisition costs and the logistics of shipping liquid products. Looking to 2035, e-commerce is expected to increase its share of the market, especially in urban areas where delivery infrastructure is robust. Key demand indicators include online grocery penetration, subscription retention rates, and the share of premium SKUs sold online. Brands that invest in digital marketing and seamless fulfillment will be well-positioned to capture this growth. Current trend: Fast-growing, especially for premium and niche products.
Major trends: Rise of subscription-based creamer delivery, Growth of direct-to-consumer brands, Increased online grocery penetration, Social media influence on purchase decisions, and Innovation in packaging for e-commerce shipping.
Representative participants: Califia Farms, Oatly Group AB, Elmhurst 1925, Nestlé S.A, and Danone S.A.
Convenience stores and gas stations represent a significant channel for coffee creamer, primarily through the sale of single-serve creamers and ready-to-drink coffee beverages. This segment caters to consumers seeking immediate consumption and convenience, often during commutes or travel. Demand is driven by the frequency of coffee purchases at these locations, which remains robust despite competition from drive-thru coffee chains. The creamer offerings in convenience stores are typically limited to mainstream brands and private label, with a focus on shelf-stable liquid and powdered formats. However, there is a growing opportunity for premium and plant-based single-serve creamers as consumers seek healthier options on the go.
The segment’s growth will be influenced by trends in mobility, fuel prices, and the expansion of convenience store foodservice. Key demand indicators include foot traffic, coffee attachment rates, and the share of premium creamers in the mix. To succeed, brands must ensure availability and visibility in these high-traffic locations, often through partnerships with convenience store chains. Current trend: Steady, with focus on single-serve and on-the-go.
Major trends: Growth of single-serve liquid creamers, Expansion of fresh coffee programs in convenience stores, Demand for dairy-free options on the go, Promotional bundling with coffee purchases, and Sustainability concerns driving packaging innovation.
Representative participants: Nestlé S.A, Danone S.A, FrieslandCampina, Lactalis Group, and Dean Foods (Dairy Farmers of America).
The ‘other channels’ segment encompasses vending machines, travel (airlines, trains), and institutional settings such as hospitals, schools, and corporate cafeterias. While smaller in share, this segment is important for brand visibility and trial. Demand is driven by the need for convenient, shelf-stable creamer options that can be easily dispensed. In vending, powdered creamers dominate due to their long shelf life and low cost, but there is a gradual shift toward liquid and plant-based options as vending operators upgrade their offerings. In travel and institutional settings, creamer is often provided as part of a beverage service, with a focus on cost and reliability.
The segment’s growth will be modest, tied to the recovery of travel and institutional foodservice. Key demand indicators include vending machine placements, airline passenger volumes, and institutional meal counts. Opportunities exist for brands that can offer sustainable, single-serve packaging and cater to dietary restrictions. However, this segment is highly price-sensitive and often subject to contract negotiations, limiting premiumization potential. Current trend: Niche but stable, with potential in travel and institutional.
Major trends: Upgrade of vending machines to offer premium creamers, Recovery of travel and institutional foodservice, Demand for sustainable packaging in travel, Growth of plant-based options in institutions, and Consolidation of vending operators.
Representative participants: Nestlé S.A, Danone S.A, Cargill, Incorporated, Kerry Group, and Arla Foods.
Interactive table based on the Store Companies dataset for this report.
| # | Company | Headquarters | Focus | Scale | Note |
|---|---|---|---|---|---|
| 1 | Nestlé | Vevey, Switzerland | Coffee-Mate brand | Global leader | Pioneered non-dairy creamer |
| 2 | Danone | Paris, France | International Dairy brand | Global | Major dairy-based creamer player |
| 3 | The WhiteWave Foods Company (Danone) | Denver, Colorado, USA | Silk, International Delight brands | Global | Plant-based & flavored creamers |
| 4 | Lactalis | Laval, France | President, Parmalat brands | Global | Major dairy group with creamer products |
| 5 | Saputo Inc. | Montreal, Canada | Dairy-based creamers | Global | Major dairy processor with creamer lines |
| 6 | Dean Foods | Dallas, Texas, USA | Dairy Pure, private label | National (US) | Was major US dairy fluid processor |
| 7 | Chobani | Norwich, New York, USA | Plant-based & dairy creamers | Major (US) | Growing plant-based creamer segment |
| 8 | Califia Farms | Los Angeles, California, USA | Plant-based creamers | Significant (US) | Leading almond/oat milk creamer brand |
| 9 | HP Hood LLC | Lynnfield, Massachusetts, USA | Dairy & plant-based creamers | Major (US) | Owns Planet Oat creamers |
| 10 | Kerry Group | Tralee, Ireland | Ingredients & private label | Global | Major B2B ingredient supplier |
| 11 | FrieslandCampina | Amersfoort, Netherlands | Dairy ingredients & brands | Global | Supplier of dairy-based creamer ingredients |
| 12 | Super Group Ltd | Singapore | Non-dairy creamer manufacturer | Asia-Pacific | Major OEM/private label manufacturer |
| 13 | Ripple Foods | San Francisco, California, USA | Pea protein-based creamers | Growing (US) | Plant-based, protein-focused |
| 14 | Dunkin’ Brands (Inspire Brands) | Canton, Massachusetts, USA | Branded retail creamers | Major (US) | Licensed brand for retail creamers |
| 15 | Starbucks Corporation | Seattle, Washington, USA | Branded retail creamers | Global | Licensed brand (typically by Nestlé) |
| 16 | Private Label (Various) | Unknown | Store-brand creamers | Global | Collective major market share |
| 17 | So Delicious Dairy Free (Danone) | Eugene, Oregon, USA | Plant-based creamers | Significant (US) | Coconut milk & oat creamers |
| 18 | Natra | Barcelona, Spain | Cocoa & creamer ingredients | Global | Major B2B cocoa/creamer blends supplier |
| 19 | Laird Superfood | Sisters, Oregon, USA | Plant-based creamer powders | Niche (US) | Functional, coconut milk-based powders |
| 20 | Cargill | Wayzata, Minnesota, USA | Ingredients & oils | Global | Supplier of oils/fats for creamers |
| 21 | Rich Products Corporation | Buffalo, New York, USA | Foodservice & retail | Global | Major in foodservice creamers |
| 22 | Grocery Manufacturers (Thailand) | Bangkok, Thailand | Non-dairy creamer OEM | Asia | Major private label manufacturer |
| 23 | Alpro (Danone) | Ghent, Belgium | Plant-based creamers | Europe | Leading plant-based brand in Europe |
| 24 | Oatly Group AB | Malmö, Sweden | Oat-based creamers | Global | Specialist oat milk creamer brand |
| 25 | Elmhurst 1925 | Elmaford, New York, USA | Plant-based creamers | Niche (US) | Milked nuts, oat creamers |
Asia-Pacific is the largest and fastest-growing region for coffee creamer, driven by rising coffee consumption, urbanization, and expanding middle class. Local taste preferences favor powdered and flavored creamers, but demand for premium and plant-based options is emerging in urban centers. Key markets include China, Japan, and Southeast Asia. Direction: Growing.
North America is a mature but high-value market, with growth driven by premiumization and plant-based creamers. Private label penetration is high, pressuring branded players. The U.S. and Canada are key markets, with a strong coffee culture and demand for functional and clean-label products. Direction: Stable with value growth.
Europe is a mature market with a strong coffee culture, particularly in Western Europe. Demand is shifting toward plant-based and organic creamers, with private label dominant in the value tier. Eastern Europe offers growth potential as coffee consumption rises. Key markets include Germany, the UK, and France. Direction: Moderate growth.
Latin America is a growing market for coffee creamer, driven by increasing coffee consumption and urbanization. Brazil and Mexico are key markets, with a preference for powdered creamers. However, economic volatility and price sensitivity limit premiumization. Plant-based options are nascent but gaining interest. Direction: Growing.
The Middle East & Africa region is an emerging market for coffee creamer, with growth driven by coffee culture and population growth. The UAE and Saudi Arabia are key markets, with a preference for premium and flavored creamers. However, distribution challenges and economic disparities limit widespread adoption. Direction: Emerging.
In the baseline scenario, IndexBox estimates a 4.2% compound annual growth rate for the global coffee creamer market over 2026-2035, bringing the market index to roughly 152 by 2035 (2025=100).
Note: indexed curves are used to compare medium-term scenario trajectories when full absolute volumes are not publicly disclosed.
For full methodological details and benchmark tables, see the latest IndexBox Coffee Creamer market report.
Rabobank is preparing to give greater weight to Dollar resilience in its EUR/USD forecasts, arguing that Europe’s own weaknesses have helped sustain the US currency’s advance.
The Euro to US Dollar exchange rate traded around 1.1308 on Thursday, down 0.17% from Wednesday’s close, following a 2.50% decline during September.
Euro to Dollar (EUR/USD): 1.130841 (-0.17%)
Pound to Dollar (GBP/USD): 1.324686 (-0.13%)
Dollar to Yen (USD/JPY): 157.92549 (+0.23%)
The bank plans to publish revised projections on Friday, 2 October, after its below-consensus forecasts converged with market expectations.
“We will be looking to publish revised forecasts for EUR/USD tomorrow with more emphasis on USD resilience.”
Rabobank attributes much of the Dollar’s summer strength to the reversal from expectations of Federal Reserve cuts to rate increases.
But higher European interest rates have failed to deliver comparable support for the Euro.
“Even though the ECB brought forward its tightening cycle, and despite the resilience of the Eurozone economy this year, the market is concerned about growth risks in view of the Eurozone’s position as an energy importer.”
Investors entered the Iran war with bullish Euro positions, encouraged by Germany’s plans to expand defence and infrastructure spending.
Rabobank says those positions were rapidly unwound as the conflict began.

France’s fiscal difficulties add to the problem, with public debt reaching 119% of GDP at the end of June ahead of its contentious 2027 Budget.
However, Rabobank cautions against treating French bond-market stress as automatic selling pressure on the Euro.
“To date, French budget woes have not had a significant impact on the single currency since sellers of French bonds have been content to roll into other EUR denominated paper.”
The broader concern is that energy costs, political uncertainty and competitive pressure from China reduce the Euro’s attraction as an alternative to the Dollar.
Friday’s forecast update will show how far Rabobank translates that assessment into revised exchange-rate targets.
Our currency coverage draws on live market data, official economic releases and published bank research.
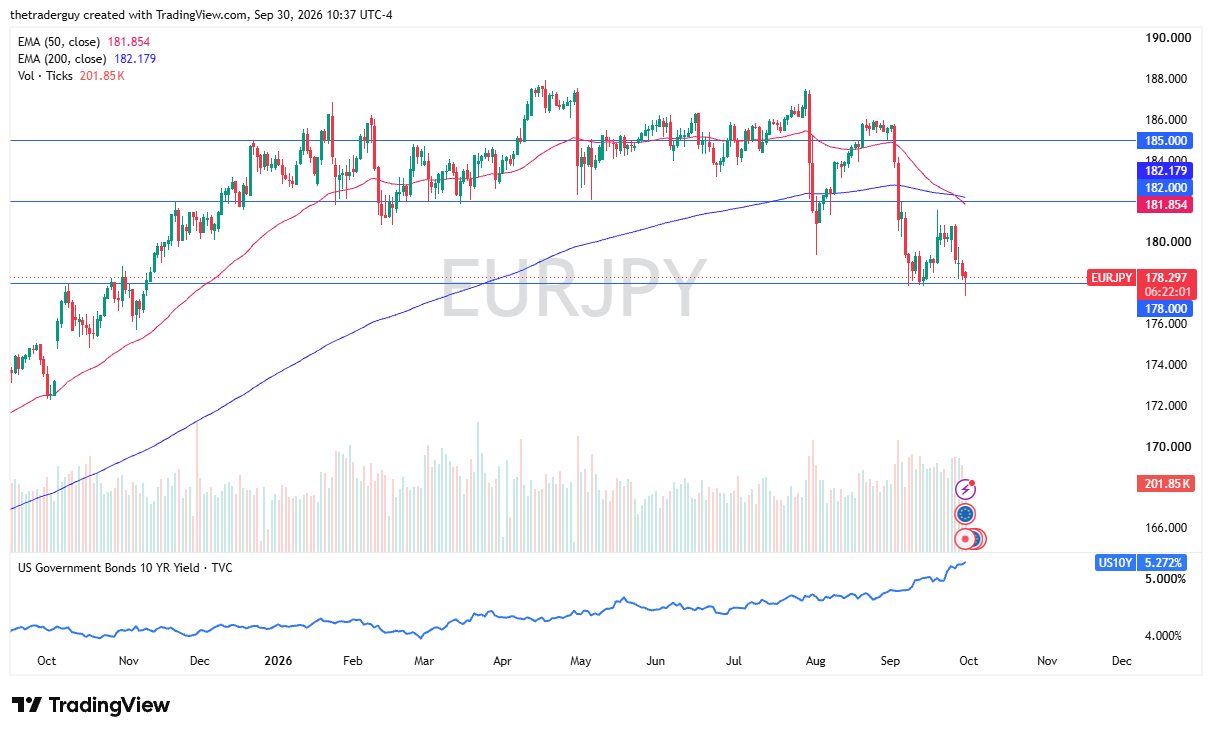
The EUR/JPY pair fell early on Wednesday, as we broke below a significant support level in the form of 178 yen.
However, it looks like the buyers are returning.
The euro dropped a bit during the early part of the trading session against the Japanese yen, threatening the ¥178 level, but it has turned around to show a bit of a hammer. The hammer suggests that the ¥178 level is likely to continue to be a bit of a floor.

The ¥181 level above has been resistance lately, and it is worth noting that the interest rate differential continues to favor the European Union. The Japanese, I think, are basically in a situation where they cannot raise rates anytime soon, at least not easily, because of the massive amount of debt that country has.
We have seen some interventions by the Bank of Japan, but I think those are basically to slow the market down. It is not really a situation where they plan on turning things around. Another thing that could come into play is if we get a bit of a situation where energy really flows into the European Union, that releases some of the concerns and could have this market rolling from here.
The market breaking down below the low of the Wednesday trading session then opens up a drop down to the ¥176 level, maybe the ¥175 level. Ultimately, I like buying dips in the Japanese yen-related pairs and collecting the swap at the end of every day. I am still a carry trader despite the interventions, although I am the first to admit I am much more comfortable going against the franc than the yen. But this is still essentially the same setup.
Begin trading our daily forecasts and analysis. Here is a list of Forex brokers in Japan to work with.
Christopher Lewis is a technical analyst and market commentator at DailyForex with more than two decades of trading experience in Forex and other leveraged markets. Based in Columbus, Ohio, he specializes in chart-based analysis of major currency pairs, stock indices, commodities, and energy markets, focusing on clear support and resistance levels, trend structure, and risk management. Christopher produces daily written and video analysis for traders who rely on technical setups to navigate volatile market conditions
As seen on: Pairs Of Aces Podcast,The Trader Guy, FXEmpire
Platinum price updates for Mumbai show the current rates as ₹52,790 (10g),
₹5,27,900 (100g), and ₹52,79,000 (1kg). Over October, prices changed
frequently. The 100g rate peaked at ₹5,27,900 and dropped to
₹5,27,900. For 1kg, it fluctuated between
₹52,79,000 and ₹52,79,000.
The cost of platinum is influenced by mining output, global market demand, and
geopolitical stability. Industrial reliance—mainly in cars and electronics—drives
additional volatility. Shifts in currency, especially the US dollar, as well as
macroeconomic indicators like inflation and interest rate policies, strongly shape its
pricing.
U.S. Dollar Index rallied as traders focused on ISM Manufacturing PMI report. The report indicated that ISM Manufacturing PMI decreased from 54.6 in August to 54.5 in September, compared to analyst forecast of 55. Numbers above 50 show expansion. The report missed analyst expectations but showed that U.S. economy remained in great shape, which was bullish for the American currency.
Traders also focused on the Initial Jobless Claims report. The report showed that 197,000 Americans filed for unemployment benefits in a week, compared to analyst consensus of 200,000.
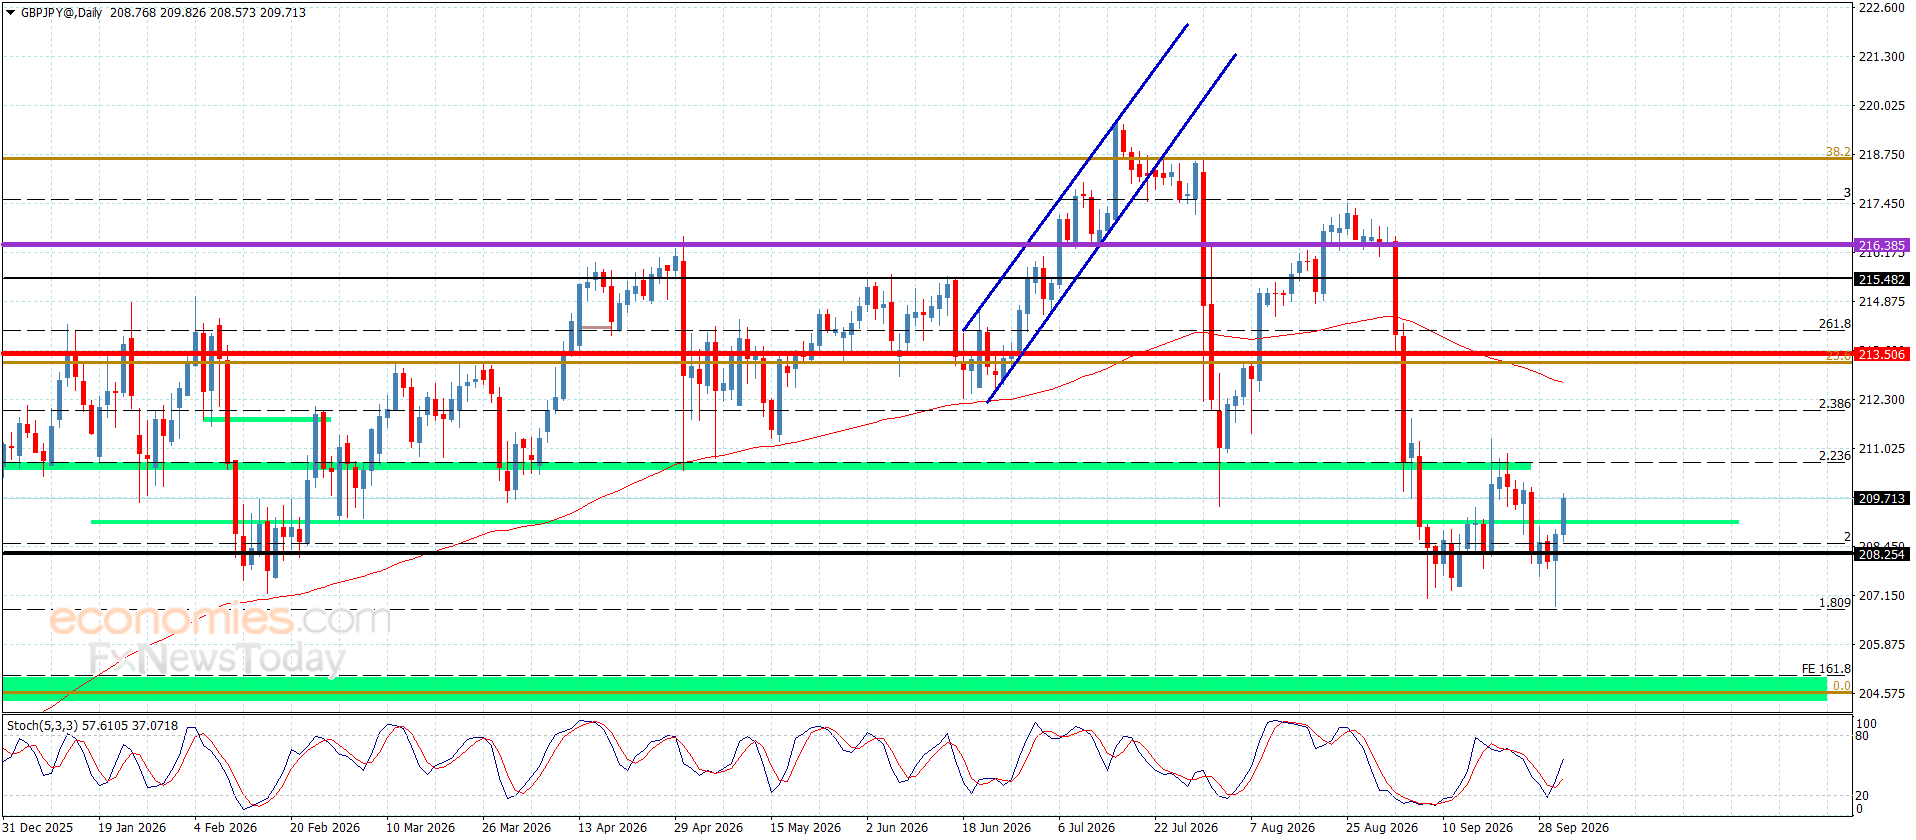
The pair’s price touched 206.85 during its latest bearish move before reacting to the positive signals from the Stochastic indicator, recovering some of its losses by surging back above 208.10 and recording further gains toward 209.70.
We expect the price to experience some instability at present, as the main indicators remain in conflict, while the price continues to trade below the barrier near 210.45. A return to sustained trading below 208.10 would increase the chances of forming bearish waves, potentially bringing renewed pressure on the barrier at 206.80.
The expected trading range for today is between 208.10 and 210.00.
Trend forecast: Volatile within the bearish path.
The U.S. dollar has fallen against the Japanese yen during trading on Wednesday as we continue to see a lot of volatility in the bond markets.
Quite frankly, part of what we are seeing is a situation where traders are looking to see whether or not the Federal Reserve will have to continue hiking rates.
The fact that the core PCE numbers came out lower than anticipated does suggest that maybe the Federal Reserve may not have to be as aggressive as once feared. That being said, I only read so much into that, and I recognize that traders will continue to see this as a market that remains held hostage by interest-rate expectations out of the United States, along with energy inflation, which has a lot to do with that as well. Then, of course, there is the Bank of Japan and whether or not they are going to get involved in the market.
The recent USD/JPY action that we had seen coming from Japan intervening in the currency market to save the Japanese yen has rattled the market, but now we find ourselves sitting just below the 200-day EMA and the 50-day EMA near the ¥158 level. With that being said, I like the idea of taking advantage of short-term dips to continue to buy into this market, as we see a lot of upward pressure on the U.S. dollar from the longer-term standpoint.
But perhaps more importantly, we have a situation where the Japanese will be hard-pressed to truly hike rates with any type of seriousness over the next several months, if not years. After all, the debt levels in Japan are historically bad, and they are only getting worse. It becomes very difficult to finance those debts at those extraordinarily high levels.
So, with that being said, I still favor going against the Japanese yen, although I do recognize that there could be some problems along the way.
Want to trade our USD/JPY forex analysis and predictions? Here’s a list of forex brokers in Japan to check out.
Christopher Lewis is a technical analyst and market commentator at DailyForex with more than two decades of trading experience in Forex and other leveraged markets. Based in Columbus, Ohio, he specializes in chart-based analysis of major currency pairs, stock indices, commodities, and energy markets, focusing on clear support and resistance levels, trend structure, and risk management. Christopher produces daily written and video analysis for traders who rely on technical setups to navigate volatile market conditions
As seen on: Pairs Of Aces Podcast,The Trader Guy, FXEmpire
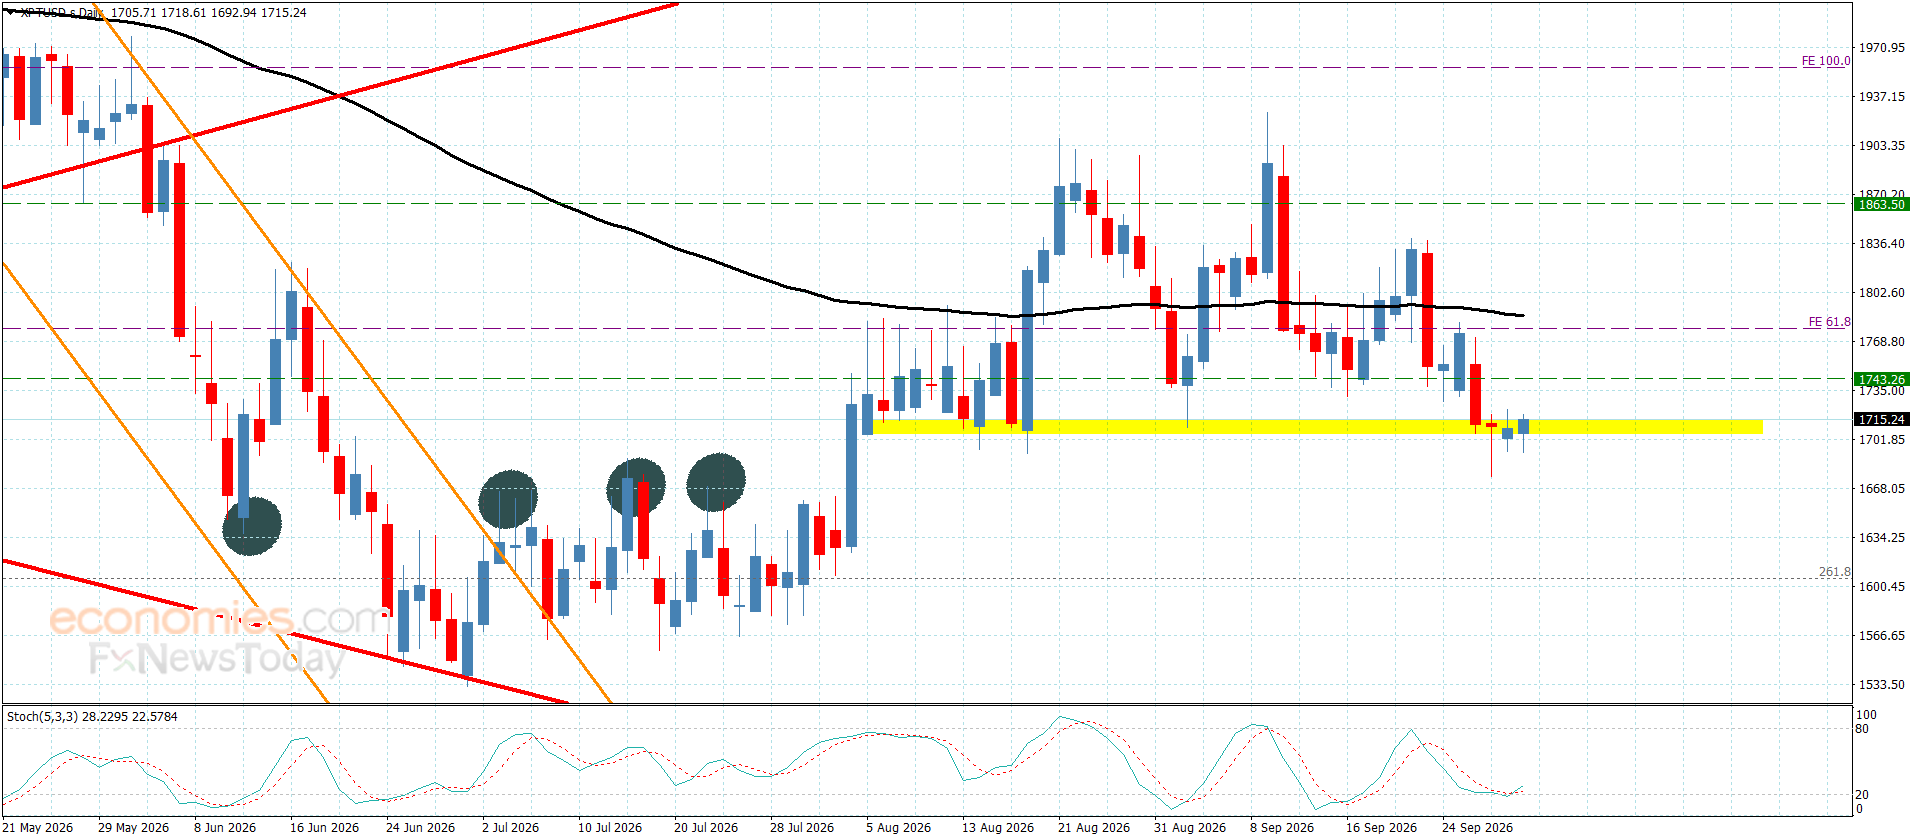
Platinum price shown little change since yesterday’s trading session, continuing to fluctuate near the support level at $1,705.00, weighed down by negative pressure reflected in the main indicators maintaining negative momentum, in addition to repeated stability below the barrier at $1,840.00.
Accordingly, we will maintain our bearish outlook for the near-term trading, awaiting confirmation of a break below the current support, after which the price could begin targeting the next bearish levels, initially moving toward $1660.00 and $1605.00.
The expected trading range for today is between $1660.00 and $1750.00.
Trend forecast: Bearish
The EUR/USD is currently at 1.1301 on the 2 hour chart. I see that the pair broke 1.1312 support. Below the support, I see no major support until 1.1283. Once that level is broken, then support is located at 1.1256, and 1.1230.
From the recent movement of EUR/USD, the pair has formed a series of lower highs and lower lows. Because of this, the overall trend is down. A break of 1.1283 changes the trend to up, and then 1.1312 is the first major resistance.
The first support I am watching is 1.1283. Expect 1.1256 below. Limit orders to buy are now filled at 1.1312, above which 1.1350 and 1.1373 become key levels.
RSI is near the 30 level and is in the bearish territory, signaling that further declines may be limited. I am bearish and expect downside to the 1.1312/50 area, which is reinforced by a lower trendline, and a bearish channel. A move above the 1.1373 area changes the near-term bias. I shall wait for a break below 1.1283 for another target at 1.1256.