The main category of Forex News.
You can use the search box below to find what you need.
[wd_asp id=1]
The main category of Forex News.
You can use the search box below to find what you need.
[wd_asp id=1]
With the continued upward momentum in the financial markets, the question arises whether the Dow Jones Industrial Average could reach 50,000 points in the near future.
Despite the index setting new record highs in 2024, sustaining this rally requires a set of economic and political factors that bolster market optimism.
Despite the index’s strong performance last year, factors such as tightening monetary policy, escalating geopolitical tensions, and declining earnings of major companies could trigger a sharp correction, pushing the index to test the 40,000 point level again.
With Donald Trump’s return to the White House in 2025, his trade policies have begun reshaping the economic landscape; he has imposed new tariffs on Chinese and European imports, creating trade tensions that negatively affected multinational companies listed in the index.
Although some sectors such as energy and defense benefit, additional tariffs have increased inflationary pressures, and the Federal Reserve has maintained a tight monetary policy, which has driven up borrowing costs.
The Federal Reserve faces a delicate balancing act amid inflationary pressures and economic uncertainty; any rate cuts could channel liquidity into the stock market and support the index, while tightening monetary policy might trigger a sharp correction and force a retest of 40,000 points.
The Dow Jones Industrial Average is one of the most important stock market indices on the New York Stock Exchange, tracking the performance of 30 of Wall Street’s largest industrial companies. Established in 1896, it serves as a gauge of the health of the American economy.
Factors influencing the Dow include macroeconomic conditions, monetary and fiscal policies, geopolitical situations, the performance of major companies, investor sentiment, innovation and technology, and unforeseen events such as natural disasters and global crises.
The index is trading near its all-time high (around 45,000 points), which entails high risk, although lower interest rates may mitigate that risk.
There are several ways to invest in the Dow, including:
It is unlikely to crash this year, especially given that it comprises high-quality stocks closely tied to the performance of the American economy.
The Dow Jones Industrial Average embarks on a long-term bullish journey, as illustrated by the chart below, having recorded an all-time high reaching approximately 45,150 points. It then encountered strong resistance there, which forced a modest downward correction, and is now attempting to resume its upward movement near that peak.
The 50-day moving average provides underlying support for the industrial index, enhancing the prospects for the continuation of the bullish trend. However, there is an alternate view in which the index’s recent inability to break above that peak might indicate a negative technical setup, potentially forcing a short- to medium-term correction, as shown in the daily chart scenario.
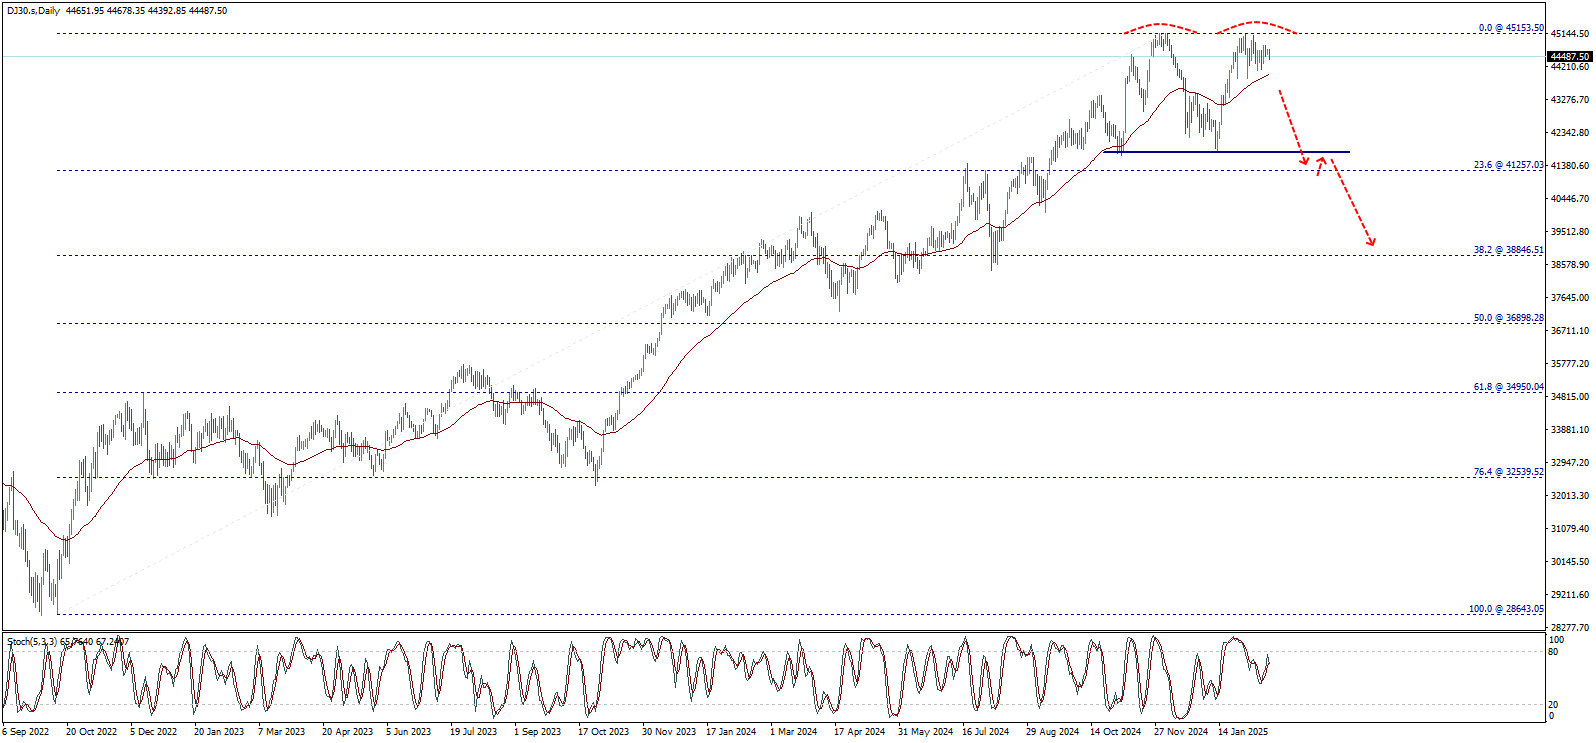
Should the index fail to surpass the 45,150-point level, it may initiate a downward wave targeting the 23.6% Fibonacci retracement level calculated from 28,643.05 up to the aforementioned peak. A closer examination of the daily chart reveals that reaching this level could lead the index to form a double-top pattern, which would trigger further short-term correction with the next target around 38,846.50 as a subsequent downside milestone.
The pivotal points to watch are support at 44,000 and resistance at 45,150; a break below this support would confirm the start of a bearish correction and the potential completion of the negative pattern, whereas a break above resistance would allow the index to resume its main upward trend.
Furthermore, on the intraday timeframes, the index is confined within a symmetrical triangle pattern since the end of last month. A break above the triangle’s resistance at 44,740 would serve as the first positive catalyst for a return to the primary bullish trend and nullify any negative potential affecting the index.
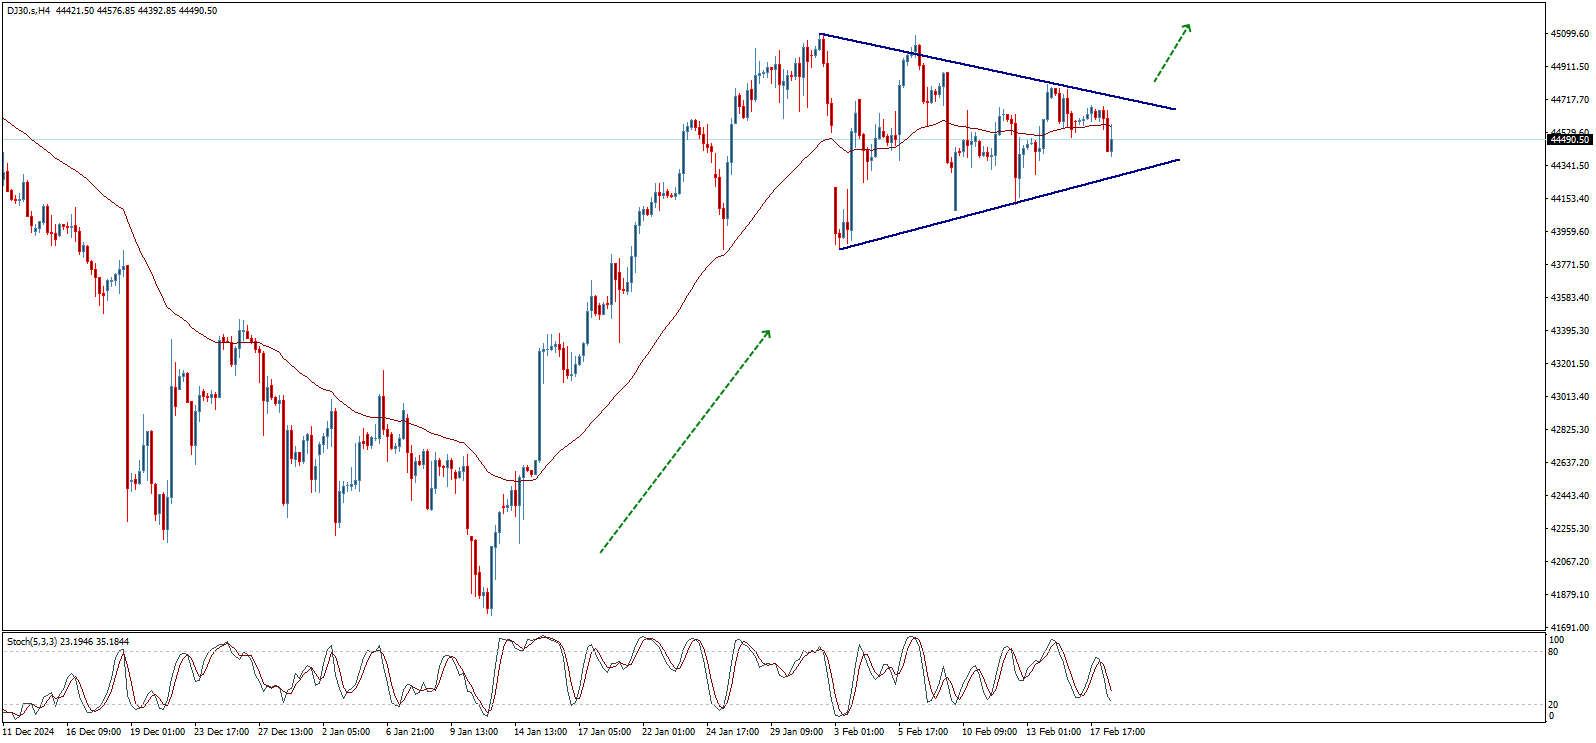
Overall, the long-term upward trend remains in place and active, and the index needs to break through levels of 44,740 and then 45,150 to pave the way for new historic highs that could reach 46,000 and then 46,500 points in the coming period. Conversely, a break below 44,000 will put the index under downward pressure and shift the short-term and intraday trend toward a decline, potentially testing support levels around 41,260 initially; breaking this support would confirm an extended bearish correction targeting 38,846.50 as the next downside objective.
Finally, the key technical analysis indicates that the long-term bullish trend is likely to continue if the index can overcome these obstacles. Securing levels above 44,740 followed by 45,150 will open the door to achieving new historic levels, while a break below 44,000 would signal a shift to a bearish path.
On the other hand, if the index fails to confirm a breach of 78.90 (note: this figure appears to be an error in the original text and is likely unrelated to the Dow) and instead experiences a downward rebound breaking the 74.60 level (another unrelated figure), it will force a transition into a downtrend with additional losses potentially reaching levels around 23,375 before any new attempt to rise. (These figures seem to be mixed with other asset analyses and might require further clarification.)
The USD/JPY outlook suggests a scramble for safety in the yen as market participants worry about Trump’s tariffs. At the same time, stalled talks between Russia and Ukraine have lowered the likelihood of a near-term end to the war.
-If you are interested in forex day trading then have a read of our guide to getting started-
The yen soared to new highs on Thursday as traders scrambled for safe assets amid economic and geopolitical uncertainty. The global economy is under threat as Trump marches on with new tariffs. On Tuesday, the US president announced a likely 25% tariff on automobiles that will affect most major economies, especially the Eurozone. These new tariffs follow duties on steel, aluminum, and Chinese goods. At the same time, markets expect a 25% tariff on Mexico and Canada in March.
The tariffs might ignite a global trade war that would negatively impact the global economy. Consequently, risk appetite will continue dropping, supporting safer currencies like the yen and the US dollar.
Elsewhere, the FOMC meeting minutes revealed that policymakers were worried Trump’s tariffs would lead to a spike in inflation. Therefore, there is a high chance the Fed will keep interest rates elevated.
At the same time, tensions between Russia and Ukraine have increased since Trump’s recent involvement. Ukraine is now accusing Russia and the US of secret deals that have caused a pause in planned talks. Continued geopolitical tensions will increase demand for the traditionally safe yen.
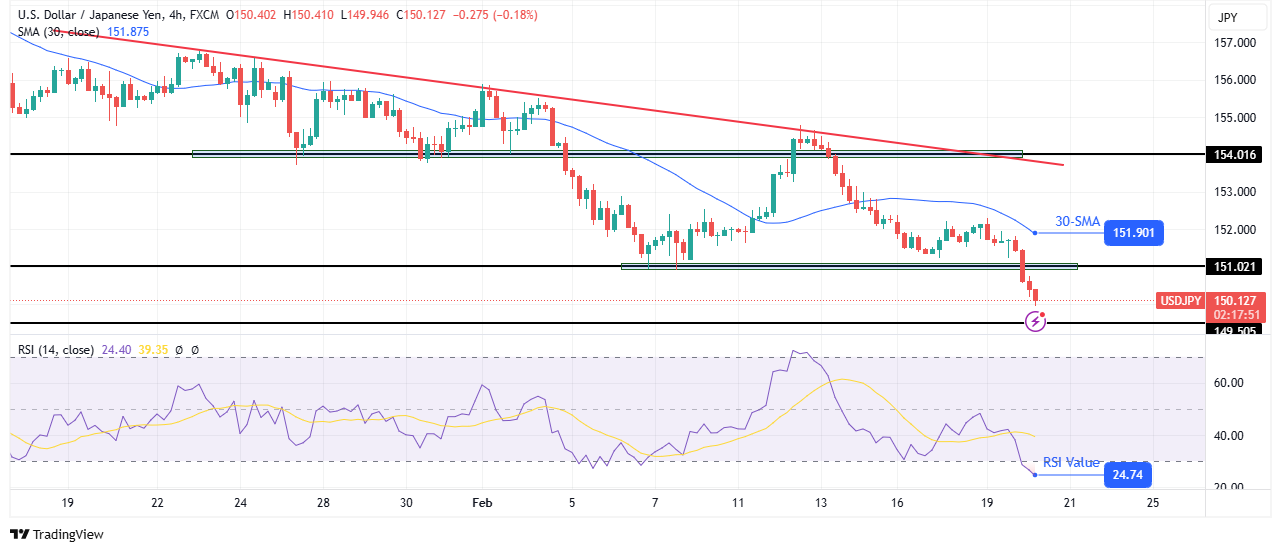
On the technical side, the USD/JPY price has collapsed further and broken below the 151.02 support level. This move has pushed the price far below the 30-SMA, indicating a strong bearish lead. At the same time, the RSI has dipped into the oversold region, indicating solid bearish momentum.
-Are you looking for the best AI Trading Brokers? Check our detailed guide-
Bears took charge when the price met its resistance trendline. The reversal was sharp, pushing the price below the 30-SMA. Moreover, bears confirmed a continuation of the downtrend when the price broke below 151.01 to make a lower low.
Given the strong bearish bias, USD/JPY might soon reach the 149.50 level. However, since the RSI is in the oversold region, the price might soon pause before continuing lower.
Looking to trade forex now? Invest at eToro!
67% of retail investor accounts lose money when trading CFDs with this provider. You should consider whether you can afford to take the high risk of losing your money.
Silver price (XAG/USD) surges almost 1.5% to near $33.20 in European trading hours on Thursday. The white metal strengthens as investors remain concerned over deepening global trade tensions. United States (US) President Donald Trump announced on Wednesday that he is planning to impose tariffs on lumber, cars, semiconductors, and pharmaceuticals over the next month or sooner.
Market participants expect President Trump’s tariffs would lead to a global trade war, which would result in an economic slowdown across the globe.
Meanwhile, Donald Trump has also ordered his team to prepare reciprocal tariffs, which are expected to be unveiled in April.
On the geopolitical front, Ukraine President Volodymyr Zelenskyy feeling left out of Russia-US peace talks to end the war in Ukraine has raised some uncertainty. Ukrainian leader has condemned US Trump for initiating peace talks with Russia without his involvement in discussing the issue in Saudi Arabia.
Signs of a slowdown in the Russia-Ukraine peace talks would boost demand for safe-haven assets, such as Silver.
Meanwhile, the safe-haven demand of the US Dollar has remained weak even though traders becoming increasingly confident that the Federal Reserve (Fed) will keep interest rates in the current range of 4.25%-4.50% for longer. The US Dollar Index (DXY), which tracks the Greenback’s value against six major currencies, declines to near 106.90.
Silver price is inch far from revisiting an over three-month high of $33.40, which it posted on February 14. The outlook of the white metal is bullish as the 50-day Exponential Moving Average (EMA) has been sloping higher, which trades around $31.28.
The 14-day Relative Strength Index (RSI) oscillates in the 60.00-80.00 range, suggesting that the momentum is strongly bullish.
Looking down, the upward-sloping trendline from the August 8 low of $26.45 will act as key support for the Silver price around $30.00. While, the October 22 high of $34.87 will be the key barrier.
Silver is a precious metal highly traded among investors. It has been historically used as a store of value and a medium of exchange. Although less popular than Gold, traders may turn to Silver to diversify their investment portfolio, for its intrinsic value or as a potential hedge during high-inflation periods. Investors can buy physical Silver, in coins or in bars, or trade it through vehicles such as Exchange Traded Funds, which track its price on international markets.
Silver prices can move due to a wide range of factors. Geopolitical instability or fears of a deep recession can make Silver price escalate due to its safe-haven status, although to a lesser extent than Gold’s. As a yieldless asset, Silver tends to rise with lower interest rates. Its moves also depend on how the US Dollar (USD) behaves as the asset is priced in dollars (XAG/USD). A strong Dollar tends to keep the price of Silver at bay, whereas a weaker Dollar is likely to propel prices up. Other factors such as investment demand, mining supply – Silver is much more abundant than Gold – and recycling rates can also affect prices.
Silver is widely used in industry, particularly in sectors such as electronics or solar energy, as it has one of the highest electric conductivity of all metals – more than Copper and Gold. A surge in demand can increase prices, while a decline tends to lower them. Dynamics in the US, Chinese and Indian economies can also contribute to price swings: for the US and particularly China, their big industrial sectors use Silver in various processes; in India, consumers’ demand for the precious metal for jewellery also plays a key role in setting prices.
Silver prices tend to follow Gold’s moves. When Gold prices rise, Silver typically follows suit, as their status as safe-haven assets is similar. The Gold/Silver ratio, which shows the number of ounces of Silver needed to equal the value of one ounce of Gold, may help to determine the relative valuation between both metals. Some investors may consider a high ratio as an indicator that Silver is undervalued, or Gold is overvalued. On the contrary, a low ratio might suggest that Gold is undervalued relative to Silver.
EUR/USD moves sideways below 1.0450 after closing the previous three days in negative territory. In the absence of high-tier data releases, the risk mood could influence the pair’s action in the second half of the day.
The table below shows the percentage change of Euro (EUR) against listed major currencies this week. Euro was the weakest against the Japanese Yen.
| USD | EUR | GBP | JPY | CAD | AUD | NZD | CHF | |
|---|---|---|---|---|---|---|---|---|
| USD | 0.57% | -0.18% | -1.25% | 0.25% | -0.40% | -0.20% | 0.33% | |
| EUR | -0.57% | -0.60% | -1.85% | -0.22% | -0.89% | -0.65% | -0.14% | |
| GBP | 0.18% | 0.60% | -1.16% | 0.38% | -0.23% | -0.05% | 0.46% | |
| JPY | 1.25% | 1.85% | 1.16% | 1.50% | 0.89% | 1.31% | 1.56% | |
| CAD | -0.25% | 0.22% | -0.38% | -1.50% | -0.62% | -0.43% | 0.08% | |
| AUD | 0.40% | 0.89% | 0.23% | -0.89% | 0.62% | 0.24% | 0.75% | |
| NZD | 0.20% | 0.65% | 0.05% | -1.31% | 0.43% | -0.24% | 0.51% | |
| CHF | -0.33% | 0.14% | -0.46% | -1.56% | -0.08% | -0.75% | -0.51% |
The heat map shows percentage changes of major currencies against each other. The base currency is picked from the left column, while the quote currency is picked from the top row. For example, if you pick the Euro from the left column and move along the horizontal line to the US Dollar, the percentage change displayed in the box will represent EUR (base)/USD (quote).
The minutes of the Federal Reserve’s (Fed) January policy meeting showed late Wednesday that some policymakers cited potential changes in trade and immigration policy as having potential to hinder the disinflation process. Although investors largely ignored this publication, the cautious market stance helped the US Dollar (USD) hold its ground and didn’t allow EUR/USD to stage a rebound.
Later in the day, the US Department of Labor will publish the weekly Initial Jobless Claims data. Markets expect the number of first-time applications for unemployment benefits to rise to 215,000 in the week ending February 15 from 213,000 in the previous week. A reading at or below 200,000 could support the USD with the immediate reaction and cause EUR/USD to stretch lower. On the other hand, a print above 230,000 could have the opposite impact on the pair’s action.
Meanwhile, US stock index futures were last seen losing between 0.2% and 0.3%. A bearish opening in Wall Street, followed by a sharp decline in main equity indexes, could allow the USD to benefit from safe-haven flows and open the door for an extended slide in EUR/USD.
The Relative Strength Index (RSI) indicator on the 4-hour chart stays below 50, highlighting a lack of buyer interest.
On the downside, 1.0390-1.0400 (100-period Simple Moving Average (SMA), 50-day SMA, Fibonacci 50% retracement of the latest downtrend) aligns as the first support area before 1.0370 (200-period SMA) and 1.0350 (Fibonacci 38.2% retracement).
In case EUR/USD climbs above 1.0440 (Fibonacci 61.8% retracement) and confirms this level as support, technical sellers could be discouraged. Above this resistance, 1.0500-1.0510 (round level, Fibonacci 78.6% retracement) and 1.0550 (static level) could be seen as next hurdles.
The Euro is the currency for the 19 European Union countries that belong to the Eurozone. It is the second most heavily traded currency in the world behind the US Dollar. In 2022, it accounted for 31% of all foreign exchange transactions, with an average daily turnover of over $2.2 trillion a day. EUR/USD is the most heavily traded currency pair in the world, accounting for an estimated 30% off all transactions, followed by EUR/JPY (4%), EUR/GBP (3%) and EUR/AUD (2%).
The European Central Bank (ECB) in Frankfurt, Germany, is the reserve bank for the Eurozone. The ECB sets interest rates and manages monetary policy. The ECB’s primary mandate is to maintain price stability, which means either controlling inflation or stimulating growth. Its primary tool is the raising or lowering of interest rates. Relatively high interest rates – or the expectation of higher rates – will usually benefit the Euro and vice versa. The ECB Governing Council makes monetary policy decisions at meetings held eight times a year. Decisions are made by heads of the Eurozone national banks and six permanent members, including the President of the ECB, Christine Lagarde.
Eurozone inflation data, measured by the Harmonized Index of Consumer Prices (HICP), is an important econometric for the Euro. If inflation rises more than expected, especially if above the ECB’s 2% target, it obliges the ECB to raise interest rates to bring it back under control. Relatively high interest rates compared to its counterparts will usually benefit the Euro, as it makes the region more attractive as a place for global investors to park their money.
Data releases gauge the health of the economy and can impact on the Euro. Indicators such as GDP, Manufacturing and Services PMIs, employment, and consumer sentiment surveys can all influence the direction of the single currency. A strong economy is good for the Euro. Not only does it attract more foreign investment but it may encourage the ECB to put up interest rates, which will directly strengthen the Euro. Otherwise, if economic data is weak, the Euro is likely to fall. Economic data for the four largest economies in the euro area (Germany, France, Italy and Spain) are especially significant, as they account for 75% of the Eurozone’s economy.
Another significant data release for the Euro is the Trade Balance. This indicator measures the difference between what a country earns from its exports and what it spends on imports over a given period. If a country produces highly sought after exports then its currency will gain in value purely from the extra demand created from foreign buyers seeking to purchase these goods. Therefore, a positive net Trade Balance strengthens a currency and vice versa for a negative balance.
Gold price has entered a bullish consolidative mode early Thursday, just under record highs hitting near $2,950 on Wednesday. US President Donald Trump’s tariff talks continue to spook markets, with investors running for cover in the traditional store of value – Gold.
Trump on Wednesday said he will announce tariffs related to imports of timber, cars, semiconductors and pharmaceuticals “over the next month or sooner”, re-emphasizing his planned announced a day earlier about imposing auto tariffs “in the neighbourhood of 25%” and similar duties on semiconductors and pharmaceuticals.
Further, US Commerce Secretary Howard Lutnick said in a Fox News interview late Wednesday that President Trump’s “goal is simple: to abolish the Internal Revenue Service and let all the outsiders pay.”
These tariff threats remain a drag on the market’s appetite for risk, accentuated by a lack of policy support from the Chinese central bank and looming tensions between the US and the European Union (EU) over the Russia-Ukraine peace deal.
The US excluded Ukraine and the EU in its peace talks to end the Ukraine conflict with Russian top delegates. This has mounted pressure on the EU to form a clear and cohesive response to Trump’s decision to negotiate directly with Russia to end the war in Ukraine.
Meanwhile, the People’s Bank of China (PBOC) kept the one-year loan prime rate (LPR) unchanged at 3.1%, and the five-year LPR at 3.6% “as Beijing prioritizes financial stability over interest rate easing to bolster the economy,” per CNBC News.
Despite the tepid risk sentiment, the US Dollar (USD) struggles to gain ground, undermined by the recent decline in the US Treasury bond yields. US tariff threats boost the safe-haven flows into the US government bonds, weighing negatively on the Treasury yields.
Markets looked past the hawkish Minutes of the US Federal Reserve (Fed) January policy meeting as US tariff talks continue to hog the limelight. The Minutes showed on Wednesday that “many participants noted that the committee could hold the policy rate at a restrictive level if the economy remained strong and inflation remained elevated” in the face of Trump’s trade policies.
Looking ahead, the mid-tier US Jobless Claims data and speeches from Fed officials will likely play second fiddle to US tariff talks as the Republican President Trump continues to inject volatility into the markets.
Therefore, Gold price remains exposed to upside risks on Trump’s tariffs uncertainty and the market’s nervousness.
The short-term technical outlook for Gold price remains more or less the same.
The daily chart shows that Gold price hangs near the record high of $2,947. The 14-day Relative Strength Index (RSI) flatlines in the overbought territory, currently near 73, suggesting that there is some room to the upside before a correction kicks in.
Gold buyers await acceptance above the $2,950 barrier on a daily closing basis to extend the record rally. The next relevant resistance is seen at the $2,970 round level.
Conversely, a fresh pullback could call for a test of the $2,900 round level, below which the February 14 low of $2,877 will be threatened.
A firm break of that level will initiate a fresh downside toward the $2,850 psychological barrier.
Gold has played a key role in human’s history as it has been widely used as a store of value and medium of exchange. Currently, apart from its shine and usage for jewelry, the precious metal is widely seen as a safe-haven asset, meaning that it is considered a good investment during turbulent times. Gold is also widely seen as a hedge against inflation and against depreciating currencies as it doesn’t rely on any specific issuer or government.
Central banks are the biggest Gold holders. In their aim to support their currencies in turbulent times, central banks tend to diversify their reserves and buy Gold to improve the perceived strength of the economy and the currency. High Gold reserves can be a source of trust for a country’s solvency. Central banks added 1,136 tonnes of Gold worth around $70 billion to their reserves in 2022, according to data from the World Gold Council. This is the highest yearly purchase since records began. Central banks from emerging economies such as China, India and Turkey are quickly increasing their Gold reserves.
Gold has an inverse correlation with the US Dollar and US Treasuries, which are both major reserve and safe-haven assets. When the Dollar depreciates, Gold tends to rise, enabling investors and central banks to diversify their assets in turbulent times. Gold is also inversely correlated with risk assets. A rally in the stock market tends to weaken Gold price, while sell-offs in riskier markets tend to favor the precious metal.
The price can move due to a wide range of factors. Geopolitical instability or fears of a deep recession can quickly make Gold price escalate due to its safe-haven status. As a yield-less asset, Gold tends to rise with lower interest rates, while higher cost of money usually weighs down on the yellow metal. Still, most moves depend on how the US Dollar (USD) behaves as the asset is priced in dollars (XAU/USD). A strong Dollar tends to keep the price of Gold controlled, whereas a weaker Dollar is likely to push Gold prices up.
Copper price continued to provide negative pressures on 4.5300$ support line, affected by stochastic continuous negativity, to confirm postponing the bullish attempts, while we recommend to wait to break the current support to start targeting the correctional stations near 4.4600$ and 4.3900$.
On the other hand, failing to break will force the price to provide mixed sideways trades due to the continuous contradiction between the major indicators, in addition to 4.6800$ level that forms solid barrier against the attempts to regain the bullish bias.
The expected trading range for today is between 4.4600$ and 4.6200$
Trend forecast: Bearish
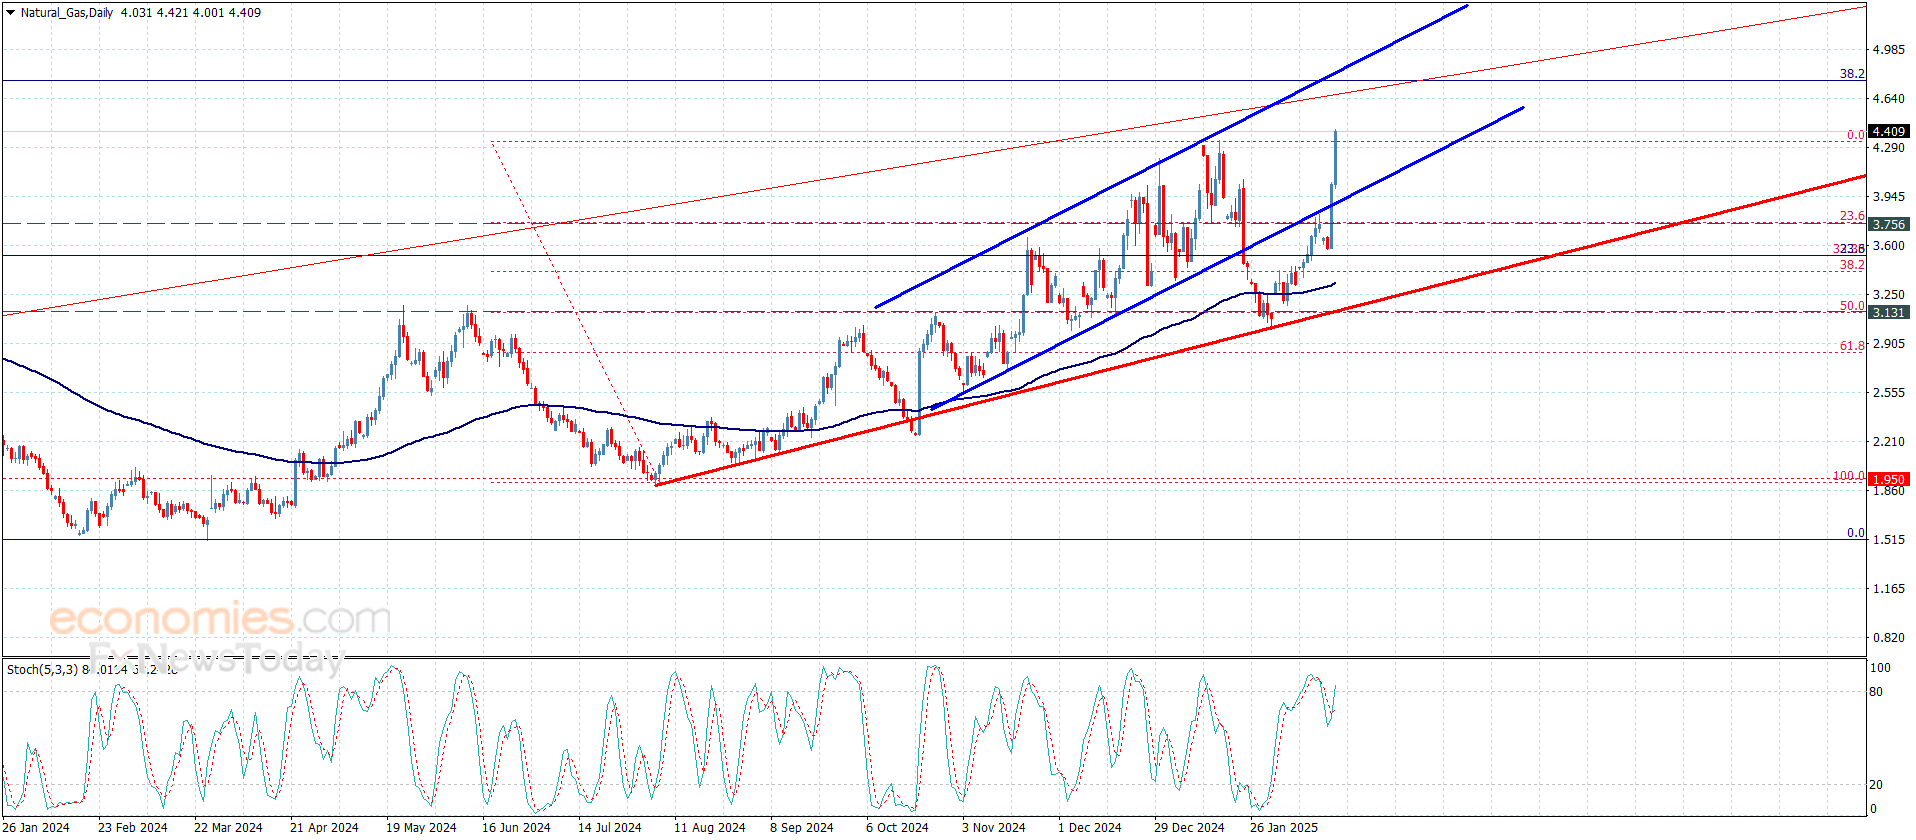
Natural gas price continued to form strong bullish waves yesterday, to notice surpassing 4.330$ barrier and record new gains by touching 4.480$ level.
We will depend on 4.330$ level forming additional support, noting that stochastic crawl towards the overbought areas will increase the positive pressures on the price, to expect targeting 4.650$ level soon, while surpassing it will extend trades towards the bullish channel’s resistance line at 4.810$.
The expected trading range for today is between 3.330$ and 4.650$
Trend forecast: Bullish
Copper price continued to provide negative pressures on 4.5300$ support line, affected by stochastic continuous negativity, to confirm postponing the bullish attempts, while we recommend to wait to break the current support to start targeting the correctional stations near 4.4600$ and 4.3900$.
On the other hand, failing to break will force the price to provide mixed sideways trades due to the continuous contradiction between the major indicators, in addition to 4.6800$ level that forms solid barrier against the attempts to regain the bullish bias.
The expected trading range for today is between 4.4600$ and 4.6200$
Trend forecast: Bearish
Silver (XAG/USD) rebounds from recent losses recorded in the previous session, trading around $32.80 per troy ounce during Asian hours on Thursday. The grey metal gains momentum due to its safe-haven appeal remains strong amid global uncertainties. US President Donald Trump recently proposed a 25% tariff on automobiles, along with duties on semiconductors and pharmaceuticals.
However, the non-interest-bearing Silver faced little downward pressure as investors digest the latest Federal Open Market Committee (FOMC) Meeting Minutes, released on Wednesday, which reaffirmed the decision to keep interest rates unchanged in January.
Fed policymakers stressed the importance of further assessing economic activity, labor market trends, and inflation before considering any rate adjustments. They agreed that clear evidence of declining inflation is essential before implementing rate cuts. Some officials also expressed concerns that potential changes in trade and immigration policies could hinder the disinflation process. Additionally, certain inflation expectation measures have risen in recent months.
Markets are currently pricing in one rate cut for the federal funds rate in 2025, with the possibility of a second. Federal Reserve Vice Chairman Philip Jefferson stated late Wednesday that the US central bank has time to deliberate on its next interest rate move, citing a resilient economy and inflation still above target. Meanwhile, Chicago Fed President Austan Goolsbee noted that while inflation has declined, it remains elevated, emphasizing that interest rates could be lowered further once inflation reaches a more acceptable level, according to Reuters.
The precious metal gained support from strong industrial demand from electrification and manufacturing. China’s addition of 357 gigawatts of solar and wind power in 2024 further underscored Silver’s critical role in renewable energy. Additionally, the People’s Bank of China (PBOC) opted to keep its Loan Prime Rates (LPRs) unchanged, with the one-year and five-year rates remaining at 3.10% and 3.60%, respectively, signaling a cautious approach to monetary stimulus.
Silver is a precious metal highly traded among investors. It has been historically used as a store of value and a medium of exchange. Although less popular than Gold, traders may turn to Silver to diversify their investment portfolio, for its intrinsic value or as a potential hedge during high-inflation periods. Investors can buy physical Silver, in coins or in bars, or trade it through vehicles such as Exchange Traded Funds, which track its price on international markets.
Silver prices can move due to a wide range of factors. Geopolitical instability or fears of a deep recession can make Silver price escalate due to its safe-haven status, although to a lesser extent than Gold’s. As a yieldless asset, Silver tends to rise with lower interest rates. Its moves also depend on how the US Dollar (USD) behaves as the asset is priced in dollars (XAG/USD). A strong Dollar tends to keep the price of Silver at bay, whereas a weaker Dollar is likely to propel prices up. Other factors such as investment demand, mining supply – Silver is much more abundant than Gold – and recycling rates can also affect prices.
Silver is widely used in industry, particularly in sectors such as electronics or solar energy, as it has one of the highest electric conductivity of all metals – more than Copper and Gold. A surge in demand can increase prices, while a decline tends to lower them. Dynamics in the US, Chinese and Indian economies can also contribute to price swings: for the US and particularly China, their big industrial sectors use Silver in various processes; in India, consumers’ demand for the precious metal for jewellery also plays a key role in setting prices.
Silver prices tend to follow Gold’s moves. When Gold prices rise, Silver typically follows suit, as their status as safe-haven assets is similar. The Gold/Silver ratio, which shows the number of ounces of Silver needed to equal the value of one ounce of Gold, may help to determine the relative valuation between both metals. Some investors may consider a high ratio as an indicator that Silver is undervalued, or Gold is overvalued. On the contrary, a low ratio might suggest that Gold is undervalued relative to Silver.
Delta Airlines’ stock price (DAL) fell in the intraday levels while trying to gather positive momentum to rise anew, as it leaned on the support of the 50-day SMA, amid the dominance of the main upward trend while the stock trades alongside the secondary short-term trend line, as a positive divergence forms in the RSI after reaching oversold levels compared to the stock’s movements, sending out positive signals.
Therefore we expect the stock to return higher and target the pivotal resistance of $69.98, provided the support of $60.40 holds on.
Trend forecast for today: Likely Bullish