The main category of Forex News.
You can use the search box below to find what you need.
[wd_asp id=1]
The main category of Forex News.
You can use the search box below to find what you need.
[wd_asp id=1]
Brent oil price managed to touch our waited target at 77.00$ and bounced downwards clearly from there, to head towards potential test to the key support 75.66$, making the bearish bias suggested for the upcoming sessions, noting that breaking the mentioned support will push the price to suffer additional losses that reach 74.00$.
Delta Airlines’ stock price (DAL) fell in the intraday levels while trying to gather positive momentum to rise anew, as it leaned on the support of the 50-day SMA, amid the dominance of the main upward trend while the stock trades alongside the secondary short-term trend line, as a positive divergence forms in the RSI after reaching oversold levels compared to the stock’s movements, sending out positive signals.
Therefore we expect the stock to return higher and target the pivotal resistance of $69.98, provided the support of $60.40 holds on.
Trend forecast for today: Likely Bullish
Spot Gold hit a fresh all-time high on Wednesday, changing hands at as high as $2,947.06 during European trading hours. The bright metal resumed its advance as the market mood soured after headlines related to United States (US) President Donald Trump.
Trump kick-started conversations with his Russian counterpart, Vladimir Putin, to restore the relationship between the two nations and work on a peace agreement with Ukraine. Trump, however, suggested that Ukrainian authorities are responsible for the ongoing war between the two Eastern Nations, angering President Volodymyr Zelenskyy.
Market players are also concerned about US President Trump threatening to impose more tariffs on a wide range of goods coming into the US.
Stock markets changed course, and Wall Street trades in the red, following a record high in the S&P 500 on Wednesday. As a result, demand for the US Dollar (USD) is firmer across the FX board.
Meanwhile, the Federal Open Market Committee (FOMC) is about to release the Minutes of the January meeting. The document may shed light on policymakers’ thinking when they decided to keep interest rates unchanged while hinting at future monetary policy decisions.
From a technical point of view, the daily chart for the XAU/USD pair shows it retreated from the aforementioned high, but the risk of a steeper slide remains limited. Technical indicators have barely retreated from extreme overbought readings and lack clear directional strength. At the same time, the pair develops far above all its moving averages, with a bullish 20 Simple Moving Average (SMA) providing dynamic support at around $2,845.00.
In the near term, and according to the 4-hour chart, the ongoing slide seems corrective, as despite retreating, XAU/USD remains above all its moving averages. A flat 20 SMA lies at around 2,913.05, providing immediate support, while the 100 and 200 SMAs maintain their upward slopes below it. Finally, technical indicators head lower but remain within positive levels, all of which limits the odds for a relevant downward extension.
Support levels: 2,913.05 2,909.60 2,897.10
Resistance levels: 2,947.10 2,960.00 2,975.00
Given the strong bullish momentum exhibited the past couple days and sustained buying throughout the day the current top is at risk of being tested as resistance with the possibility of a continuation breakout. If the advance can get above $4.37 there is a chance that the next higher target of $4.56 might be reached. There is also the possibility that the next higher target range, where there is the confluence of several indicators, could be reached.
Nonetheless, before higher targets can be approached a sustained breakout above the $4.37 trend high needs to be successful. Certainly, the rally from the $2.99 swing low from late-January has made significant progress so far. As of today’s high, natural gas had advanced by as much as $1.33 or 44.6% in 12 days. However, the bull trend may be in its final stages before demand slows.
It is interesting to note that today’s advance stopped at a trendline that previously represented support. A successful test of the line as resistance looks to have completed today. Nonetheless, what happens next will be telling. Either resistance continues to be seen around the trendline or a breakout above it occurs.
A pattern emerges when examining six previous natural gas upswings (measured moves) since April 2024. For comparison, the percentage price change is considered. The largest gain was the first sharp rally off the April low. That measured move resulted in a 99.6% increase in the price of natural gas.
Otherwise, there were two measured moves showing close to a 61% advance, two showing about a 32% gain, and one around 41%. Since the current advance has exceeded that performance, it shows relative strength in the current rally. A 61% gain from the $2.99 low would complete at $4.81.
For a look at all of today’s economic events, check out our economic calendar.
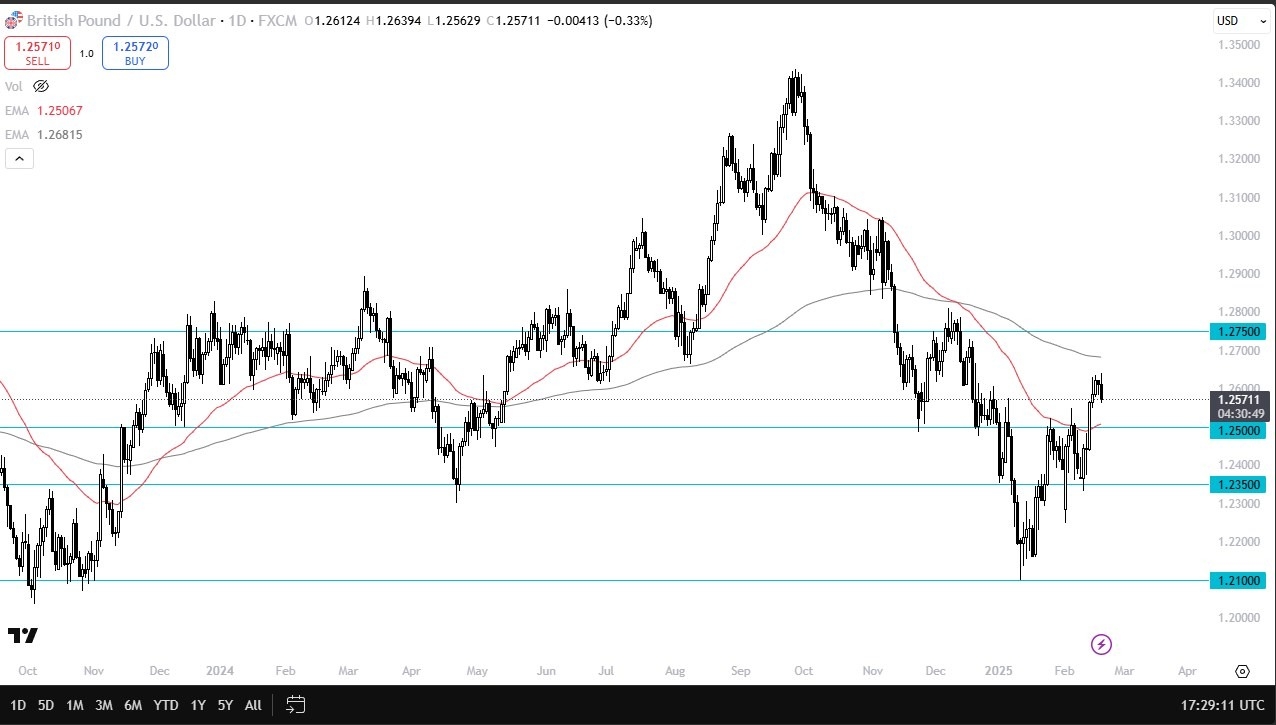
The Bank of England has started cutting rates already, so it’s a little bit of a confusing move until you look at the overall length of the trend and the fact that we got a little over extended and then realize that this bounce was probably needed.

Ultimately, this is a market that is currently stuck between the 50 day EMA and the 200 day EMA, which of course is an area where you see a lot of volatility and noisy trading in at times. If we were to drop from here and break down below the 1.25 level, we would not only be breaking down below a significant large round number, but also below the crucial 50 day EMA.
In that environment, I expect the British pound to not only drop to the 1.2350 level, but perhaps even the 1.21 level where we had bounced from. Alternatively, if we turn around and break above the 200 day EMA at the 1.27 region, then we test the 1.2750 level. Once we get beyond that, then I think the trend has completely changed. Right now, though, it looks like a bit of profit taking is going on and there is a lack of upward momentum.
Ready to trade the Forex GBP/USD analysis and predictions? Here are the best forex trading platforms UK to choose from
Microsoft Corp’s stock price (MSFT) rose mildly in the intraday levels after the support of $406.30 held on, as the stock tries to recoup some recent losses, while trying to vent off oversold saturation in the RSI, with negative pressure due to trading below the 50-day SMA, as the stock is hurt by piercing the upward secondary short-term trend line.
Therefore we expect the price to return lower, provided the aforementioned support of $406.30 held on, thus targeting the next pivotal support at $398.17.
Trend forecast for today: Likely Bearish
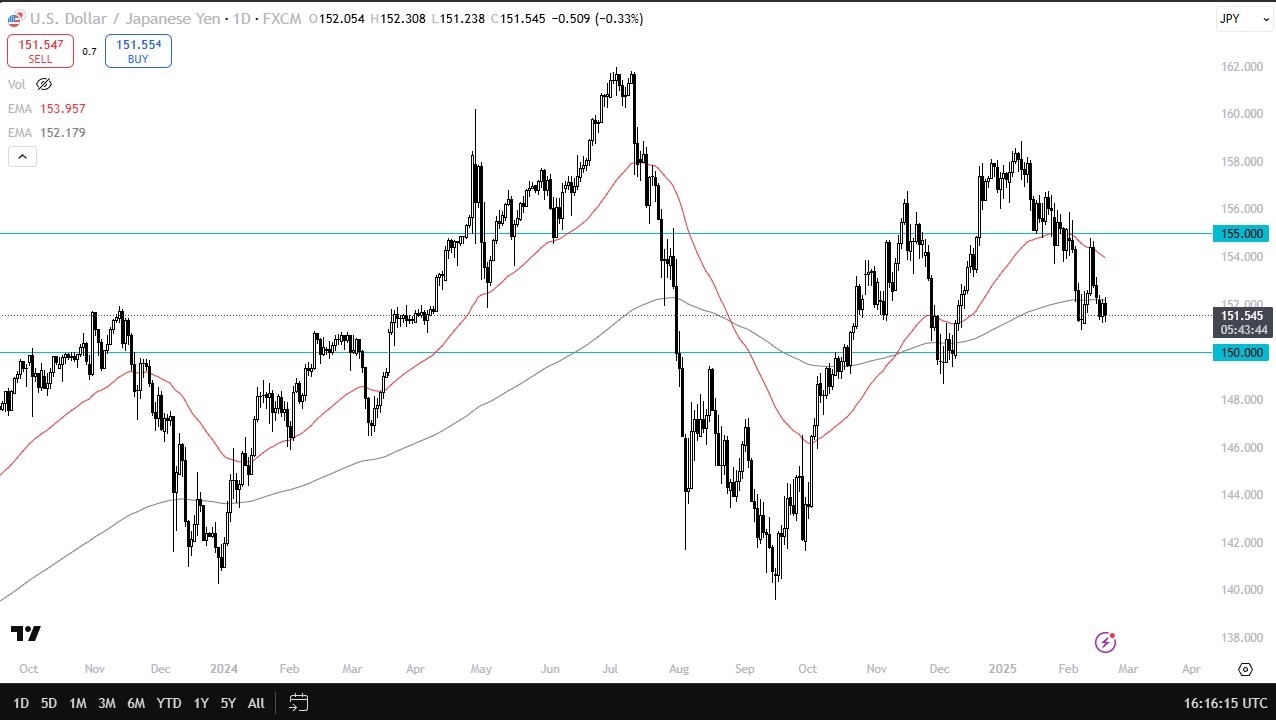
I believe that the technical analysis for this market is likely to continue to show signs of hesitation for momentum to the upside, but I don’t necessarily think it’s ready to break down significantly from here. The ¥150 level underneath is a major support level, and as long as we can stay above there, then I think you have a reasonable chance for the US dollar to pick up momentum, as the interest rate differential between the 2 currencies is fairly wide. Even if the Bank of Japan were to raise rates by 25 basis points, the reality is that you still get paid to hang on to this pair, and it is probably only a matter of time before the market starts focusing on that again.
Nonetheless, this is a market that hasn’t shown itself to be reliably bullish yet, and I need we need to get the market to close above the ¥152.50 level, and therefore if we take off above there, then the market could go looking to the 50 Day EMA, and then perhaps the ¥155 level after that. Anything above there would have the Japanese yen being eviscerated by the US dollar.
Ultimately, this is a market that I think continues to be very noisy, and choppy to say the least. However, I will keep an eye on that ¥150 level, as it is a large, round, psychologically significant figure, and an area that’s been both support and resistance, so therefore I think you’ve got a situation where noise and back and forth continues to be the case.
Want to trade our USD/JPY forex analysis and predictions? Here’s a list of forex brokers in Japan to check out.
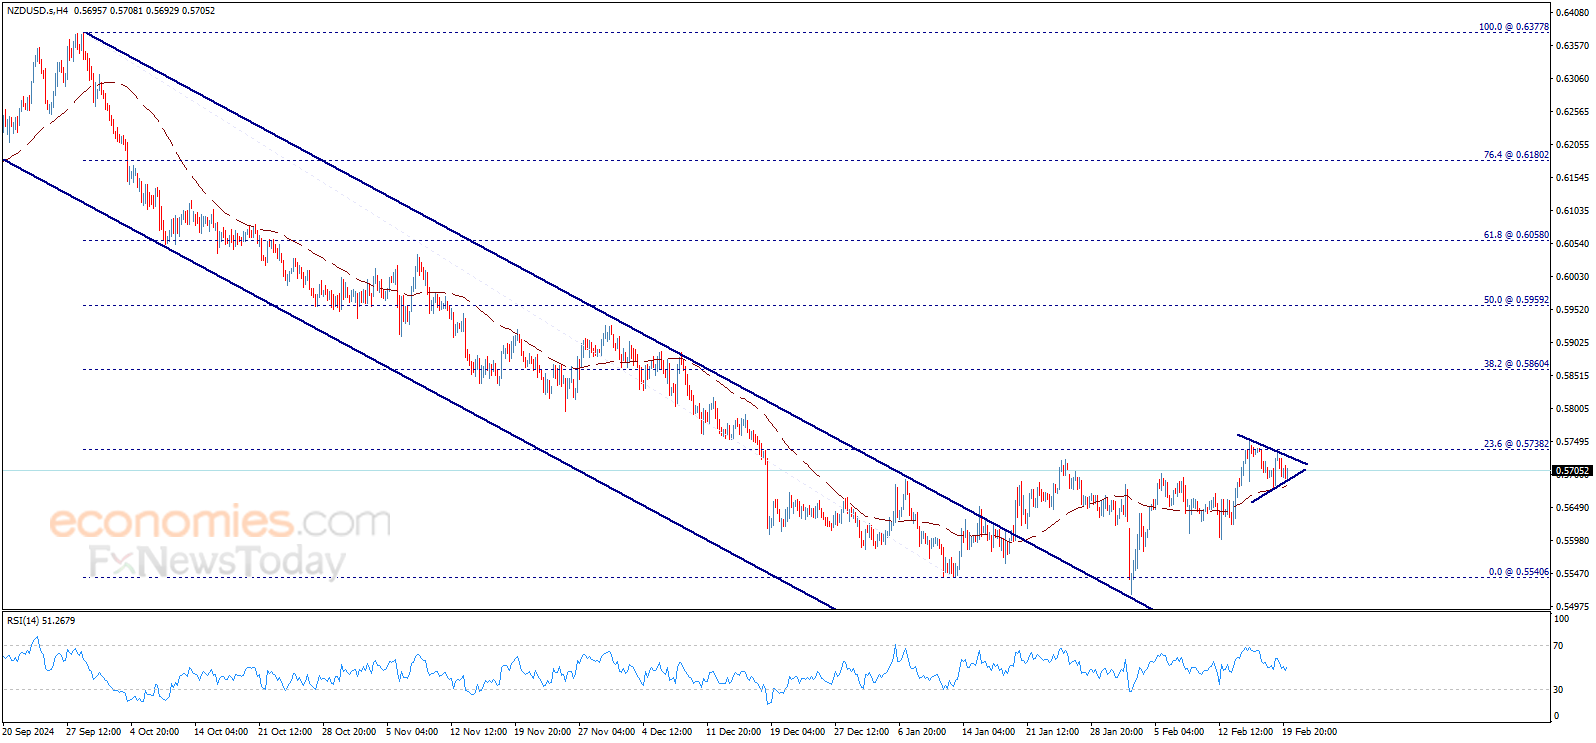
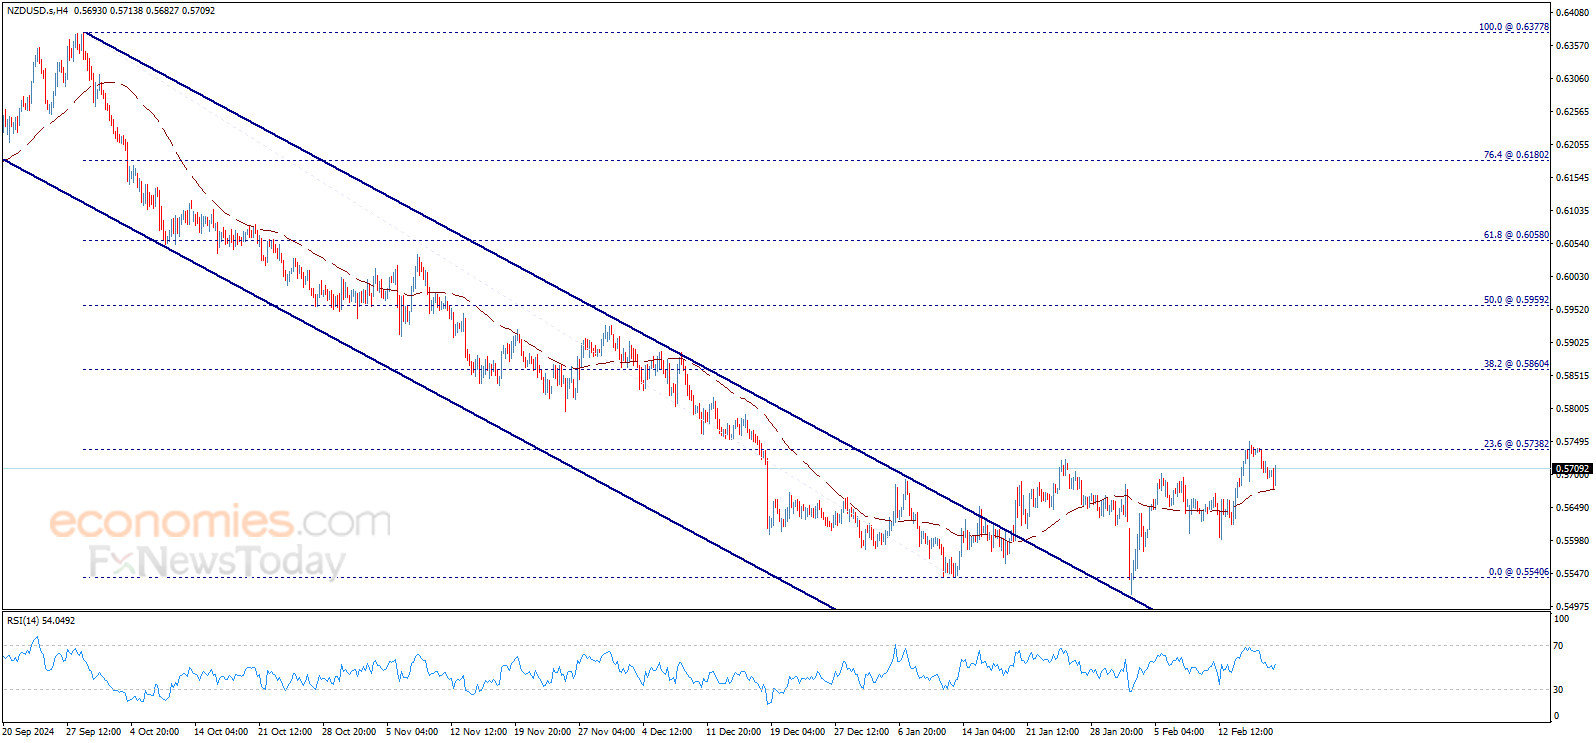
The NZDUSD price faced additional negative pressure to test the EMA50 that forms key support at 0.5670$, noticing that the price rebounds bullishly from there to reach the thresholds of 0.5738$ level, waiting to breach this level to confirm the continuation of the bullish wave in the upcoming sessions.
For more: please follow us on Telegram channel.
GBP/USD struggles to hold its ground and trades marginally lower on the day at around 1.2600 in the European session on Wednesday. The pair’s technical outlook highlights a loss of bullish momentum.
The table below shows the percentage change of British Pound (GBP) against listed major currencies this week. British Pound was the weakest against the Japanese Yen.
| USD | EUR | GBP | JPY | CAD | AUD | NZD | CHF | |
|---|---|---|---|---|---|---|---|---|
| USD | 0.66% | -0.06% | -0.35% | 0.17% | -0.04% | 0.03% | 0.51% | |
| EUR | -0.66% | -0.56% | -1.03% | -0.38% | -0.62% | -0.52% | -0.05% | |
| GBP | 0.06% | 0.56% | -0.38% | 0.18% | -0.00% | 0.04% | 0.52% | |
| JPY | 0.35% | 1.03% | 0.38% | 0.52% | 0.33% | 0.59% | 0.83% | |
| CAD | -0.17% | 0.38% | -0.18% | -0.52% | -0.19% | -0.14% | 0.34% | |
| AUD | 0.04% | 0.62% | 0.00% | -0.33% | 0.19% | 0.10% | 0.57% | |
| NZD | -0.03% | 0.52% | -0.04% | -0.59% | 0.14% | -0.10% | 0.48% | |
| CHF | -0.51% | 0.05% | -0.52% | -0.83% | -0.34% | -0.57% | -0.48% |
The heat map shows percentage changes of major currencies against each other. The base currency is picked from the left column, while the quote currency is picked from the top row. For example, if you pick the British Pound from the left column and move along the horizontal line to the US Dollar, the percentage change displayed in the box will represent GBP (base)/USD (quote).
The data published by the UK’s Office for National Statistics (ONS) showed on Wednesday that annual inflation in the UK, as measured by the change in the Consumer Price Index (CPI), climbed to 3% in January from 2.5% in December. This reading came in above the market expectation of 2.8%. Other details of the report showed that the Services CPI declined by 0.2% on a monthly basis, not allowing Pound Sterling to benefit from the stronger-than-forecast headline CPI reading.
In the second half of the day, the Federal Reserve (Fed) will release the minutes of the January policy meeting.
In case the publication shows that policymakers are willing to wait until the second half of the year before considering another rate cut, the immediate reaction could support the USD. On the other hand, investors could ignore this document if it just repeats that policymakers agree on the need for a cautious approach to policy easing. According to the CME FedWatch Tool, markets nearly fully price in a policy hold in March.
Meanwhile, investors will continue to pay close attention to risk perception. At the time of press, US stock index futures were trading flat. In case markets turn cautious with Wall Street opening on a bearish note, GBP/USD could continue to stretch lower.
The Relative Strength Index (RSI) indicator on the 4-hour chart declines toward 50, reflecting a loss of bullish momentum. On the downside, 1.2530 (Fibonacci 61.8% retracement level of the latest downtrend) aligns as first resistance before 1.2500 (round level, static level) and 1.2470 (100-period Simple Moving Average).
Looking north, first resistance could be spotted at 1.2650 (Fibonacci 78.6% retracement) before 1.2700-1.2710 (round level, static level).
The Pound Sterling (GBP) is the oldest currency in the world (886 AD) and the official currency of the United Kingdom. It is the fourth most traded unit for foreign exchange (FX) in the world, accounting for 12% of all transactions, averaging $630 billion a day, according to 2022 data. Its key trading pairs are GBP/USD, also known as ‘Cable’, which accounts for 11% of FX, GBP/JPY, or the ‘Dragon’ as it is known by traders (3%), and EUR/GBP (2%). The Pound Sterling is issued by the Bank of England (BoE).
The single most important factor influencing the value of the Pound Sterling is monetary policy decided by the Bank of England. The BoE bases its decisions on whether it has achieved its primary goal of “price stability” – a steady inflation rate of around 2%. Its primary tool for achieving this is the adjustment of interest rates. When inflation is too high, the BoE will try to rein it in by raising interest rates, making it more expensive for people and businesses to access credit. This is generally positive for GBP, as higher interest rates make the UK a more attractive place for global investors to park their money. When inflation falls too low it is a sign economic growth is slowing. In this scenario, the BoE will consider lowering interest rates to cheapen credit so businesses will borrow more to invest in growth-generating projects.
Data releases gauge the health of the economy and can impact the value of the Pound Sterling. Indicators such as GDP, Manufacturing and Services PMIs, and employment can all influence the direction of the GBP. A strong economy is good for Sterling. Not only does it attract more foreign investment but it may encourage the BoE to put up interest rates, which will directly strengthen GBP. Otherwise, if economic data is weak, the Pound Sterling is likely to fall.
Another significant data release for the Pound Sterling is the Trade Balance. This indicator measures the difference between what a country earns from its exports and what it spends on imports over a given period. If a country produces highly sought-after exports, its currency will benefit purely from the extra demand created from foreign buyers seeking to purchase these goods. Therefore, a positive net Trade Balance strengthens a currency and vice versa for a negative balance.
West Texas Intermediate (WTI) Oil price advances on Wednesday, according to FXStreet data. WTI trades at $72.24 per barrel, up from Tuesday’s close at $71.74.
Brent Oil Exchange Rate (Brent crude) is also up, advancing from the $75.45 price posted on Tuesday, and trading at $75.94.
WTI Oil is a type of Crude Oil sold on international markets. The WTI stands for West Texas Intermediate, one of three major types including Brent and Dubai Crude. WTI is also referred to as “light” and “sweet” because of its relatively low gravity and sulfur content respectively. It is considered a high quality Oil that is easily refined. It is sourced in the United States and distributed via the Cushing hub, which is considered “The Pipeline Crossroads of the World”. It is a benchmark for the Oil market and WTI price is frequently quoted in the media.
Like all assets, supply and demand are the key drivers of WTI Oil price. As such, global growth can be a driver of increased demand and vice versa for weak global growth. Political instability, wars, and sanctions can disrupt supply and impact prices. The decisions of OPEC, a group of major Oil-producing countries, is another key driver of price. The value of the US Dollar influences the price of WTI Crude Oil, since Oil is predominantly traded in US Dollars, thus a weaker US Dollar can make Oil more affordable and vice versa.
The weekly Oil inventory reports published by the American Petroleum Institute (API) and the Energy Information Agency (EIA) impact the price of WTI Oil. Changes in inventories reflect fluctuating supply and demand. If the data shows a drop in inventories it can indicate increased demand, pushing up Oil price. Higher inventories can reflect increased supply, pushing down prices. API’s report is published every Tuesday and EIA’s the day after. Their results are usually similar, falling within 1% of each other 75% of the time. The EIA data is considered more reliable, since it is a government agency.
OPEC (Organization of the Petroleum Exporting Countries) is a group of 12 Oil-producing nations who collectively decide production quotas for member countries at twice-yearly meetings. Their decisions often impact WTI Oil prices. When OPEC decides to lower quotas, it can tighten supply, pushing up Oil prices. When OPEC increases production, it has the opposite effect. OPEC+ refers to an expanded group that includes ten extra non-OPEC members, the most notable of which is Russia.
(An automation tool was used in creating this post.)