The main category of Forex News.
You can use the search box below to find what you need.
[wd_asp id=1]
The main category of Forex News.
You can use the search box below to find what you need.
[wd_asp id=1]
The EURJPY pair kept its consolidation near 158.60 since yesterday, taking advantage of stochastic additional negative momentum signals, to increase the chances of resuming the negative attack on the near-term basis.
Succeeding to break 158.60 and holding below it will open the way to target more negative stations, starting at 157.90 as a first station, followed by attempting to press on the additional support at 157.30.
The expected trading range for today is between 157.90 and 159.60
Trend forecast: Bearish
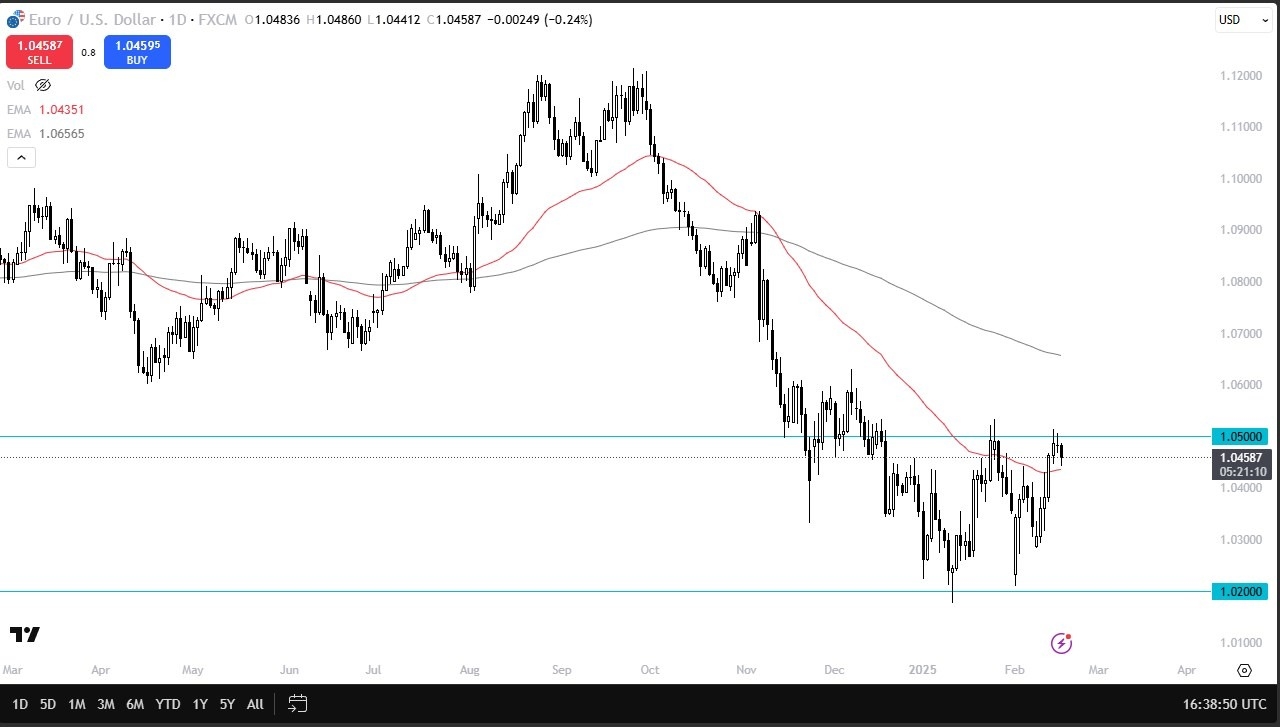
That being said, I think there is a significant amount of resistance on the way into the 1.06 level above, and therefore we need to be very cautious about trying to get bullish on this EUR/USD pair just yet. If we break down below the 50 day EMA on a daily close, I do think that we will probably revisit the overall consolidation. This is a departure from recent action, as we had seen nothing but bullish action, but now it looks like we are starting to get a little overextended.

This is a scenario where I think you’re looking for cheap US dollars and you might be getting them right now. The next couple of days should be important and it could give us an idea as to where we might go over the longer term.
At this point though, I’m not interested in buying the euro until we break above the 1.06 level, so I look at this with skepticism still, and I think that probably will continue to be the case going forward. The most obvious answer for me is to assume that we are still very much in consolidation, with 1.05 being the resistance area, and the 1.02 level underneath being massive support. This has been a nice rally, but when you look at the totality of the move, it really hasn’t changed much. It just looks like we’re flailing around and looking for some type of directionality.
Ready to trade our Forex daily forecast? We’ve shortlisted the best forex broker list for you to check out.
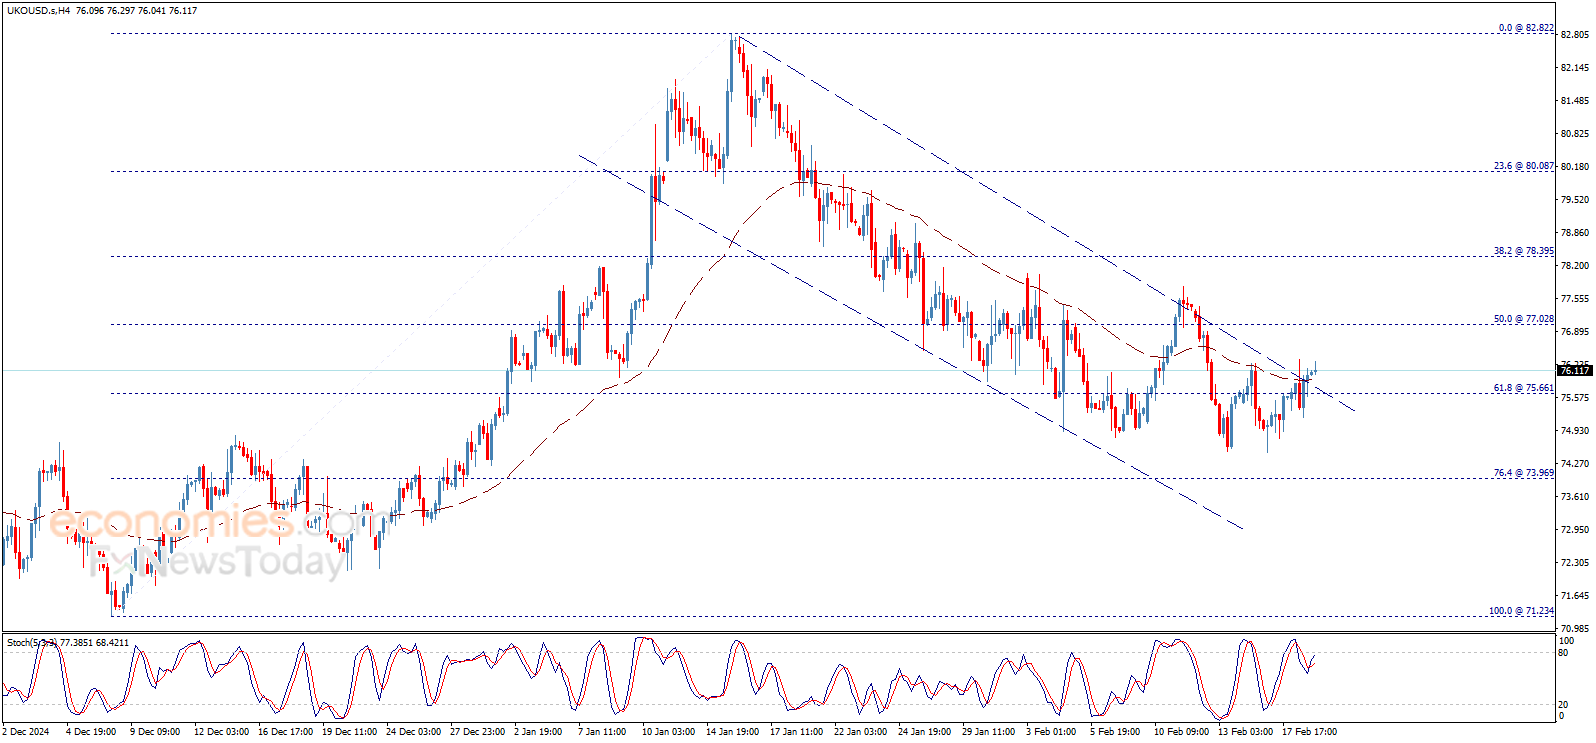
Crude oil price shows more bullish bias to trade around the EMA50, noticing that the price is forming positive pattern that might assist to continue the rise and breach the key resistance at 72.30$ to open the way to achieve more gains in the upcoming sessions, but we notice that the technical indicators provide negative signals that might push the price to decline again.
For more: please follow us on Telegram channel.
Platinum price surrendered to stochastic negativity this morning, to notice moving towards the minor bullish channel’s support line at 971.00$, hinting postponing the bullish attempts until gathering the positive momentum again.
We expect to get sideways trades now, noting that facing additional negative pressures might force it to crawl below the current support line to suffer losses by moving towards 958.00$ followed by attempting to test the next support at 950.00$, while rallying above 983.00$ again will reinforce the chances of renewing the bullish attempts, to target 1005.00$ as a first positive station.
The expected trading range for today is between 960.00$ and 983.00$
Trend forecast: Bearish temporarily
All eyes are on today’s economic news. If the actual NFP is below the forecast (169K), it will strengthen the expectations of the Fed rate…
The GBPUSD price didn’t show any strong move in the previous sessions, to continue moving around 1.2605$ level, thus, no change to the expected bullish trend scenario for the upcoming period, which targets 1.2680$ followed by 1.2765$ levels as next positive stations, reminding you that breaking 1.2605$ and holding below it will push the price to start bearish wave that targets 1.2525$ followed by 1.2415$ areas mainly.
For more: please follow us on Telegram channel.
Further signs of strength could lead to continued bullish behavior within the next pullback or consolidation. The recent advance has continued to show signs of strength as it advanced, with the more significant being the reclaim of both the 20-Day and 50-Day MAs.
It is interesting to note that earlier in today’s trading session natural gas began the trading session by gapping down and then falling to successfully test support around the 50-Day MA with the day’s low of $3.55. That initial decline provided bearish signals on a drop below the lows of each of the past two days. The market clearly recognized the 50-Day MA price area as the buyers clearly took back control.
There are also a couple signs of strength to be aware of on the weekly chart (not shown). The three-week high at $3.83 was exceeded today, as well as the 200-Week MA, which is at $3.91. Today’s closing price should be above each of those price levels and will therefore confirm the strength of the breakouts.
Despite strong bullish indications a pullback could come following a test of the 78.6% retracement, as noted above. There is also a former weekly high at $4.05. It provides a little more attention to that price area. Even if the $4.06 price level is exceeded to the upside the current advance is getting extended.
As of today’s high, natural gas was up by $1.02 or 34.2% from the recent $2.99 swing low. Certainly, it can go higher, but today’s spike is not happening at the beginning of the rally and therefore there might be early signs of exhaustion that has not yet been fully registered by the market.
Gold price is up on Tuesday, with XAU/USD approaching the $2,930 mark in the American session. The bright metal resumed its advance after falling to $2,876.93 on Friday, up for a second consecutive day and closing into the record high at $2,942.76 posted this month.
The US Dollar (USD) fell away from investors’ radar amid an improved mood, based on hopes that the Russia-Ukraine war would soon end. Russian and United States (US) delegations met in Riyadh to hold peace talks, although without the presence of Ukrainian leaders.
“No decisions about Ukraine without Ukraine … Europe must have a seat at the table when decisions about Europe are being made,” Ukraine’s President Volodymyr Zelensky said at the Munich Security Conference over the weekend. Nevertheless, diplomats from the US and Russia have hailed the meeting in Saudi Arabia as positive.
Meanwhile, Canada reported that the January Consumer Price Index (CPI) rose by 1.9% over the last twelve months, up from the December reading of 1.8%, and it matched analysts’ expectations. On a monthly basis, prices rose 0.1%, higher than the -0.4% posted in December. The optimistic figures further backed the market mood.
From a technical point of view, the daily chart for XAU/USD shows buyers regained control. Technical indicators resumed their advances after correcting extreme overbought conditions, while the pair develops above all bullish moving averages. Additionally, the 20 Simple Moving Average (SMA) maintains its firmly bullish slope far above the 100 and 200 SMA, which also head north.
In the near term, and according to the 4-hour chart, XAU/USD has room to extend its advance. The pair recovered above a flat 20 SMA, now providing support at around $2,909.60. The 100 and 200 SMAs, in the meantime, accelerated north far below the shorter one, reflecting buyers’ dominance. Finally, technical indicators regained their upward strength, although the Momentum indicator remains below its 100 line.
Support levels: 2,909.60 2,897.10 2,876,90
Resistance levels: 2,942.75 2,960.00 2,975.00
The NZDCAD price formed correctional bullish rebound recently after facing 50% Fibonacci correction level at 0.8035, in addition to stochastic rally towards 80 level, to notice recording some gains by settling near 0.8105.
Note that the current rebound won’t affect the main bearish track due to the frequent stability below 0.8240 resistance line in addition to the MA55 crawl below this resistance, thus, we will keep waiting to gather the negative momentum to manage to renew the pressure on 0.8035 level, while breaking it will open the way to target new negative stations, starting at 0.7980 as a first additional target.
The expected trading range for today is between 0.8035 and 0.8145
Trend forecast: Bearish
EUR/USD stays on the back foot and declines toward 1.0450 in the European session on Tuesday. The pair’s technical outlook points to a loss of bullish momentum but a positive shift in risk mood could help it limit its losses.
The table below shows the percentage change of Euro (EUR) against listed major currencies this week. Euro was the weakest against the Japanese Yen.
| USD | EUR | GBP | JPY | CAD | AUD | NZD | CHF | |
|---|---|---|---|---|---|---|---|---|
| USD | 0.34% | -0.17% | -0.23% | 0.07% | -0.11% | 0.20% | 0.13% | |
| EUR | -0.34% | -0.36% | -0.60% | -0.17% | -0.38% | -0.05% | -0.12% | |
| GBP | 0.17% | 0.36% | -0.15% | 0.19% | 0.04% | 0.31% | 0.25% | |
| JPY | 0.23% | 0.60% | 0.15% | 0.29% | 0.14% | 0.63% | 0.32% | |
| CAD | -0.07% | 0.17% | -0.19% | -0.29% | -0.16% | 0.12% | 0.06% | |
| AUD | 0.11% | 0.38% | -0.04% | -0.14% | 0.16% | 0.33% | 0.26% | |
| NZD | -0.20% | 0.05% | -0.31% | -0.63% | -0.12% | -0.33% | -0.06% | |
| CHF | -0.13% | 0.12% | -0.25% | -0.32% | -0.06% | -0.26% | 0.06% |
The heat map shows percentage changes of major currencies against each other. The base currency is picked from the left column, while the quote currency is picked from the top row. For example, if you pick the Euro from the left column and move along the horizontal line to the US Dollar, the percentage change displayed in the box will represent EUR (base)/USD (quote).
Following a three-day weekend in the US, trading conditions are starting to normalize on Tuesday. The benchmark 10-year US Treasury bond yield gains nearly 1% on the day above 4.5%, supporting the US Dollar (USD) and weighing on EUR/USD early Tuesday.
Meanwhile, US stock index futures were last seen rising between 0.2% and 0.4%. In case Wall Street opens on a bullish note, the USD could lose interest and help EUR/USD hold its ground. Since the US economic calendar will not feature any high-tier data releases, investors could remain focused on risk perception in the second half of the day.
On Wednesday, the Federal Reserve (Fed) will release the minutes of the January policy meeting. Preliminary February HCOB Manufacturing and Services Purchasing Managers’ Index (PMI) for the Eurozone and Germany on Friday could be the next data releases that could influence the Euro’s valuation.
The Relative Strength Index (RSI) indicator on the 4-hour chart declines toward 50 and EUR/USD closed the two 4-hour candles below the 20-period Simple Moving Average (SMA), reflecting a loss of bullish momentum.
Looking south, first support could be spotted at 1.0440 (Fibonacci 61.8% retracement level of the latest downtrend) before 1.0400 (100-period SMA, Fibonacci 50% retracement) and 1.0365 (200-period SMA). On the downside, resistances align at 1.0500-1.0510 (round level, Fibonacci 78.6% retracement), 1.0550 (static level) and 1.0600 (static level, beginning point of the downtrend).
The Euro is the currency for the 19 European Union countries that belong to the Eurozone. It is the second most heavily traded currency in the world behind the US Dollar. In 2022, it accounted for 31% of all foreign exchange transactions, with an average daily turnover of over $2.2 trillion a day. EUR/USD is the most heavily traded currency pair in the world, accounting for an estimated 30% off all transactions, followed by EUR/JPY (4%), EUR/GBP (3%) and EUR/AUD (2%).
The European Central Bank (ECB) in Frankfurt, Germany, is the reserve bank for the Eurozone. The ECB sets interest rates and manages monetary policy. The ECB’s primary mandate is to maintain price stability, which means either controlling inflation or stimulating growth. Its primary tool is the raising or lowering of interest rates. Relatively high interest rates – or the expectation of higher rates – will usually benefit the Euro and vice versa. The ECB Governing Council makes monetary policy decisions at meetings held eight times a year. Decisions are made by heads of the Eurozone national banks and six permanent members, including the President of the ECB, Christine Lagarde.
Eurozone inflation data, measured by the Harmonized Index of Consumer Prices (HICP), is an important econometric for the Euro. If inflation rises more than expected, especially if above the ECB’s 2% target, it obliges the ECB to raise interest rates to bring it back under control. Relatively high interest rates compared to its counterparts will usually benefit the Euro, as it makes the region more attractive as a place for global investors to park their money.
Data releases gauge the health of the economy and can impact on the Euro. Indicators such as GDP, Manufacturing and Services PMIs, employment, and consumer sentiment surveys can all influence the direction of the single currency. A strong economy is good for the Euro. Not only does it attract more foreign investment but it may encourage the ECB to put up interest rates, which will directly strengthen the Euro. Otherwise, if economic data is weak, the Euro is likely to fall. Economic data for the four largest economies in the euro area (Germany, France, Italy and Spain) are especially significant, as they account for 75% of the Eurozone’s economy.
Another significant data release for the Euro is the Trade Balance. This indicator measures the difference between what a country earns from its exports and what it spends on imports over a given period. If a country produces highly sought after exports then its currency will gain in value purely from the extra demand created from foreign buyers seeking to purchase these goods. Therefore, a positive net Trade Balance strengthens a currency and vice versa for a negative balance.