The main category of Forex News.
You can use the search box below to find what you need.
[wd_asp id=1]
The main category of Forex News.
You can use the search box below to find what you need.
[wd_asp id=1]
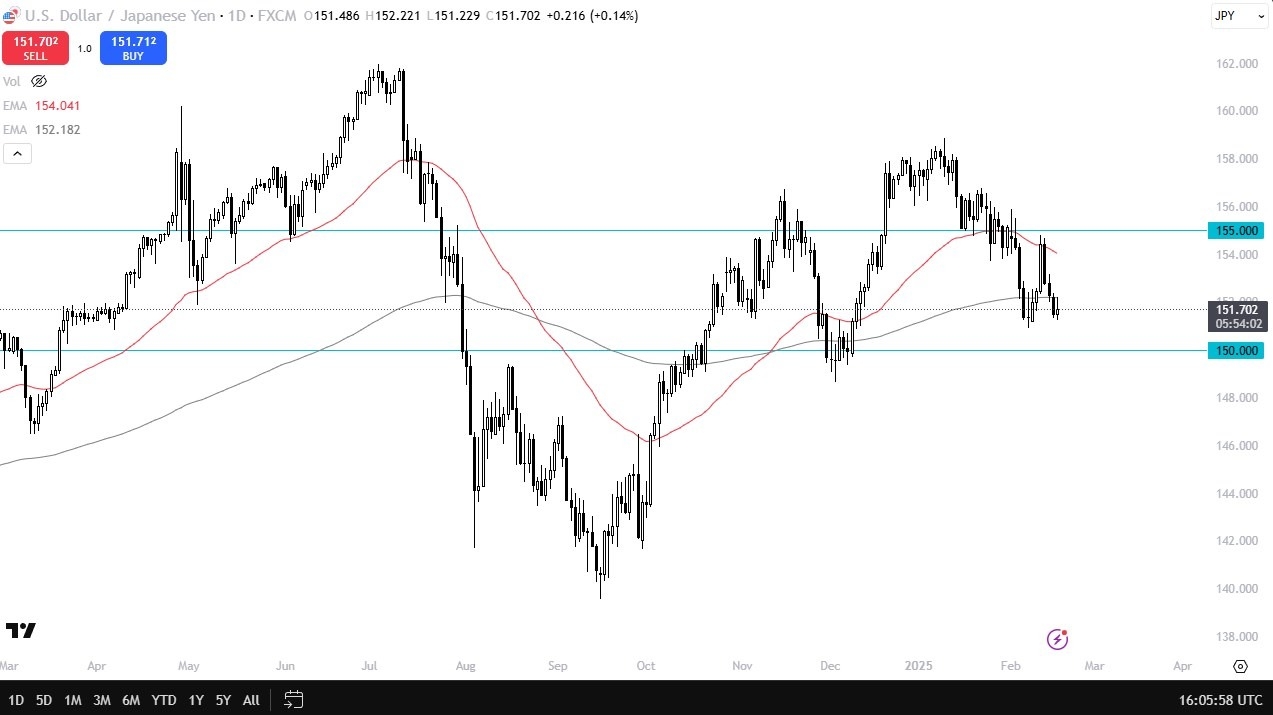
Ultimately, the yields in Japan have been rising, and that has a major influence on the Japanese yen itself. The Bank of Japan is suddenly worried about inflation, and that of course comes into the picture as well. Ultimately though, the interest rate differential is still fairly wide, so while we have seen the Japanese yen appreciate against the US dollar, I suspect this is more of a “repricing” of interest rate differentials than anything else. It’ll be interesting to see on this plays out, but I do think that we are in the midst of trying to find the bottom near the ¥150 level.

The technical analysis for this USD/JPY pair suggests that we are getting close to forming some type of potential bottom, but we haven’t seen the bounce to reaffirm this. It’s worth noting that the 200 Day EMA sits just above, and it did offer a significant amount of resistance on the attempted recovery for the Tuesday session. Because of this, I think you’ve got a situation where the market is probably going to continue to go back and forth and try to sort out where to go next. In other words, volatility is probably going to be a feature, not a bug in this trading environment.
If we were to break down below the ¥150 level, that would be an extraordinarily negative sign, but right now I don’t see that happening easily. On the other hand, I think the breaking higher is going to take a little bit of effort, so with that being said, I suspect that short-term range bound trading will eventually be what we settle into.
Want to trade our USD/JPY forex analysis and predictions? Here’s a list of forex brokers in Japan to check out.
Nu Holdings’ stock price (NU) fell in the intraday levels with negative pressure due to negative signals from the RSI after reaching overbought levels, amid the dominance of the upward trend in the medium term, with positive support from trading above the 50-day SMA, as the stock tries to collect profits and gather positive momentum to rise anew.
Therefore we expect the price to return higher and target the pivotal resistance of $16.15, provided it settles above $13.19.
Trend forecast for today: Likely Bullish
EUR/USD stays on the back foot and trades below 1.0450 after closing in the negative territory on Tuesday. The pair’s short-term technical outlook highlights a bearish tilt.
The table below shows the percentage change of Euro (EUR) against listed major currencies this week. Euro was the weakest against the Japanese Yen.
| USD | EUR | GBP | JPY | CAD | AUD | NZD | CHF | |
|---|---|---|---|---|---|---|---|---|
| USD | 0.48% | -0.25% | -0.36% | 0.08% | -0.18% | -0.16% | 0.56% | |
| EUR | -0.48% | -0.57% | -0.87% | -0.30% | -0.57% | -0.54% | 0.18% | |
| GBP | 0.25% | 0.57% | -0.19% | 0.27% | 0.05% | 0.03% | 0.75% | |
| JPY | 0.36% | 0.87% | 0.19% | 0.44% | 0.22% | 0.42% | 0.89% | |
| CAD | -0.08% | 0.30% | -0.27% | -0.44% | -0.23% | -0.24% | 0.48% | |
| AUD | 0.18% | 0.57% | -0.05% | -0.22% | 0.23% | 0.03% | 0.74% | |
| NZD | 0.16% | 0.54% | -0.03% | -0.42% | 0.24% | -0.03% | 0.72% | |
| CHF | -0.56% | -0.18% | -0.75% | -0.89% | -0.48% | -0.74% | -0.72% |
The heat map shows percentage changes of major currencies against each other. The base currency is picked from the left column, while the quote currency is picked from the top row. For example, if you pick the Euro from the left column and move along the horizontal line to the US Dollar, the percentage change displayed in the box will represent EUR (base)/USD (quote).
EUR/USD came under modest bearish pressure in the American session on Tuesday as markets adopted a cautious stance. US President Donald Trump said late Tuesday that they are looking to impose tariffs on car imports “in the neighborhood of 25%” as early as April 2. He also noted that they are also planning to charge similar duties on pharmaceutical and semiconductor imports.
Meanwhile, European Central Bank (ECB) policymaker Fabio Panetta said early Wednesday that the signs of weakness in the Eurozone economy seem to be more persistent than anticipated, making it difficult for the Euro to stay resilient against its rivals.
Later in the American session, the Federal Reserve will publish the minutes of the January policy meeting. According to the CME FedWatch Tool, markets see virtually no chance of a rate cut in March. This publication is unlikely to influence the market pricing of the Fed rate outlook in a significant way. Hence, the risk perception could continue to drive the US Dollar’s valuation and impact EUR/USD’s action. At the time of press, US stock index futures were trading marginally higher on the day. A bullish action in Wall Street after the opening bell could help EUR/USD hold its ground.
The Relative Strength Index (RSI) indicator on the 4-hour chart declined below 50, reflecting a bearish tilt in the short-term outlook.
On the downside, 1.0440 (Fibonacci 61.8% retracement level of the latest downtrend) aligns as a key pivot level. In case EUR/USD confirms this level as resistance, 1.0400 (100-period SMA, Fibonacci 50% retracement), 1.0370 (200-period SMA) and 1.0350 (Fibonacci 38.2% retracement) could be seen as next support levels.
Looking north, resistances could be spotted at 1.0500-1.0510 (round level, Fibonacci 78.6% retracement), 1.0550 (static level) and 1.0600 (static level, beginning point of the downtrend).
The Euro is the currency for the 19 European Union countries that belong to the Eurozone. It is the second most heavily traded currency in the world behind the US Dollar. In 2022, it accounted for 31% of all foreign exchange transactions, with an average daily turnover of over $2.2 trillion a day. EUR/USD is the most heavily traded currency pair in the world, accounting for an estimated 30% off all transactions, followed by EUR/JPY (4%), EUR/GBP (3%) and EUR/AUD (2%).
The European Central Bank (ECB) in Frankfurt, Germany, is the reserve bank for the Eurozone. The ECB sets interest rates and manages monetary policy. The ECB’s primary mandate is to maintain price stability, which means either controlling inflation or stimulating growth. Its primary tool is the raising or lowering of interest rates. Relatively high interest rates – or the expectation of higher rates – will usually benefit the Euro and vice versa. The ECB Governing Council makes monetary policy decisions at meetings held eight times a year. Decisions are made by heads of the Eurozone national banks and six permanent members, including the President of the ECB, Christine Lagarde.
Eurozone inflation data, measured by the Harmonized Index of Consumer Prices (HICP), is an important econometric for the Euro. If inflation rises more than expected, especially if above the ECB’s 2% target, it obliges the ECB to raise interest rates to bring it back under control. Relatively high interest rates compared to its counterparts will usually benefit the Euro, as it makes the region more attractive as a place for global investors to park their money.
Data releases gauge the health of the economy and can impact on the Euro. Indicators such as GDP, Manufacturing and Services PMIs, employment, and consumer sentiment surveys can all influence the direction of the single currency. A strong economy is good for the Euro. Not only does it attract more foreign investment but it may encourage the ECB to put up interest rates, which will directly strengthen the Euro. Otherwise, if economic data is weak, the Euro is likely to fall. Economic data for the four largest economies in the euro area (Germany, France, Italy and Spain) are especially significant, as they account for 75% of the Eurozone’s economy.
Another significant data release for the Euro is the Trade Balance. This indicator measures the difference between what a country earns from its exports and what it spends on imports over a given period. If a country produces highly sought after exports then its currency will gain in value purely from the extra demand created from foreign buyers seeking to purchase these goods. Therefore, a positive net Trade Balance strengthens a currency and vice versa for a negative balance.
The US Dollar (USD) is the official currency of the United States of America, and the ‘de facto’ currency of a significant number of other countries where it is found in circulation alongside local notes. It is the most heavily traded currency in the world, accounting for over 88% of all global foreign exchange turnover, or an average of $6.6 trillion in transactions per day, according to data from 2022. Following the second world war, the USD took over from the British Pound as the world’s reserve currency. For most of its history, the US Dollar was backed by Gold, until the Bretton Woods Agreement in 1971 when the Gold Standard went away.
The most important single factor impacting on the value of the US Dollar is monetary policy, which is shaped by the Federal Reserve (Fed). The Fed has two mandates: to achieve price stability (control inflation) and foster full employment. Its primary tool to achieve these two goals is by adjusting interest rates. When prices are rising too quickly and inflation is above the Fed’s 2% target, the Fed will raise rates, which helps the USD value. When inflation falls below 2% or the Unemployment Rate is too high, the Fed may lower interest rates, which weighs on the Greenback.
In extreme situations, the Federal Reserve can also print more Dollars and enact quantitative easing (QE). QE is the process by which the Fed substantially increases the flow of credit in a stuck financial system. It is a non-standard policy measure used when credit has dried up because banks will not lend to each other (out of the fear of counterparty default). It is a last resort when simply lowering interest rates is unlikely to achieve the necessary result. It was the Fed’s weapon of choice to combat the credit crunch that occurred during the Great Financial Crisis in 2008. It involves the Fed printing more Dollars and using them to buy US government bonds predominantly from financial institutions. QE usually leads to a weaker US Dollar.
Quantitative tightening (QT) is the reverse process whereby the Federal Reserve stops buying bonds from financial institutions and does not reinvest the principal from the bonds it holds maturing in new purchases. It is usually positive for the US Dollar.
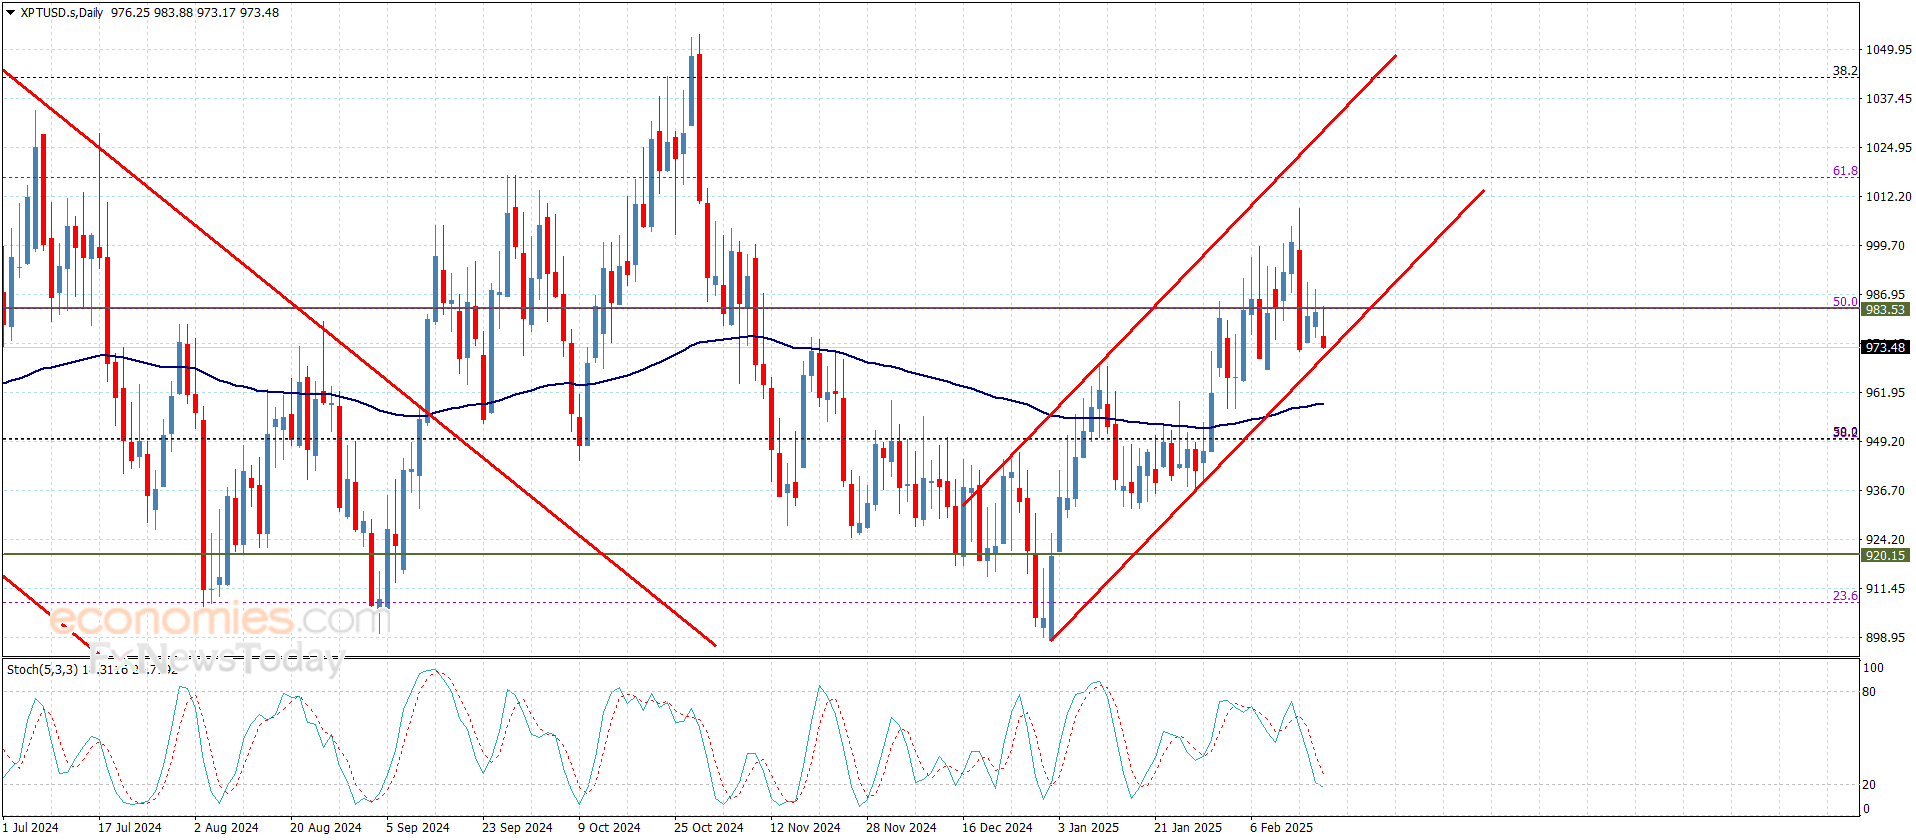
Platinum price surrendered to stochastic negativity this morning, to notice moving towards the minor bullish channel’s support line at 971.00$, hinting postponing the bullish attempts until gathering the positive momentum again.
We expect to get sideways trades now, noting that facing additional negative pressures might force it to crawl below the current support line to suffer losses by moving towards 958.00$ followed by attempting to test the next support at 950.00$, while rallying above 983.00$ again will reinforce the chances of renewing the bullish attempts, to target 1005.00$ as a first positive station.
The expected trading range for today is between 960.00$ and 983.00$
Trend forecast: Bearish temporarily
The Japanese yen has strengthened as a result as interest rates are going higher in Japan. But at the same time, you also have to recognize the fact that the interest rate differential between Great Britain and Japan are about a mile wide. So I think you’ve got a situation where buyers will try to pile back into this GBP/JPY pair sooner or later.Top Forex Brokers1 Get Started 74% of retail CFD accounts lose money Is Sterling Going to Rise Globally?This would be especially true if the British pound continues to strengthen against other currencies like the dollar, but we’ll just have to wait and see. Speaking of technical analysis, when you look at this, it’s hard not to notice that the 50-day EMA as well as the 200-day EMA is sitting just above and offering resistance. In this environment, we could see a scenario where if we can break above there, then it opens up a move to the 195 Yen level underneath the 190 yen level, I think it continues to be very important as support. And I do think that we try to hold that if we were to break down below there, then the 188 yen level could be an area of interest as well. But really, at this point in time, I think we are starting to stabilize and should eventually see some type of impulsive candlestick that we can follow.EURUSD Chart by TradingViewBegin trading our daily forecasts and analysis . Here is a list of Forex brokers in Japan to work with.
MENAFN19022025000131011023ID1109223225
Legal Disclaimer:
MENAFN provides the information “as is” without warranty of any kind. We do not accept any responsibility or liability for the accuracy, content, images, videos, licenses, completeness, legality, or reliability of the information contained in this article. If you have any complaints or copyright issues related to this article, kindly contact the provider above.
Platinum price surrendered to stochastic negativity this morning, to notice moving towards the minor bullish channel’s support line at 971.00$, hinting postponing the bullish attempts until gathering the positive momentum again.
We expect to get sideways trades now, noting that facing additional negative pressures might force it to crawl below the current support line to suffer losses by moving towards 958.00$ followed by attempting to test the next support at 950.00$, while rallying above 983.00$ again will reinforce the chances of renewing the bullish attempts, to target 1005.00$ as a first positive station.
The expected trading range for today is between 960.00$ and 983.00$
Trend forecast: Bearish temporarily
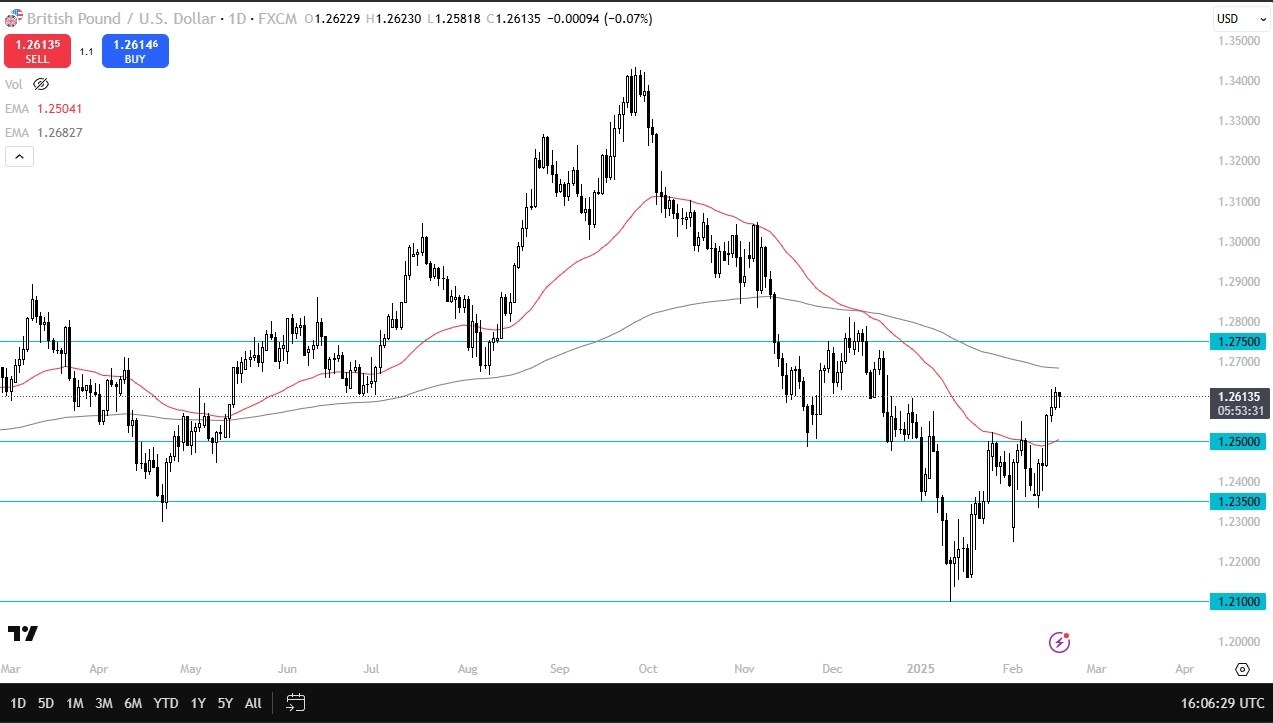
It’s worth thinking about the fact that the British pound has shot straight up in the air as of late, and while it has been a fairly impressive move, the reality is that we are still in a downtrend, if for no other reason than the fact that we are below the 200 Day EMA. Granted, it is only quite obvious by the time we break above there that the trend has changed, but it was such a massive plunge for the British pound that it will be interesting to see whether or not that is easily reversed.
As mentioned previously, we are sitting between the 50 Day EMA and the 200 Day EMA moving averages, both of which are widely followed. The 1.25 level below is significant support, while the 1.2750 level above is a major ceiling. If we can break above the 1.2750 level, then it opens up the possibility of a bigger move, but ultimately, I think that we have a situation that will continue to be very noisy, as the Federal Reserve is likely to stay tight, while the Bank of England may have to continue to move. It will have to be a “wait and see” situation as far as interest rate differential is concerned, but most of what’s moving this market here I believe is the US dollar itself, and interest rates in America as traders are starting to come into focus yet again. Expect noise in this general vicinity overall.
Ready to trade our daily Forex GBP/USD analysis? We’ve made this UK forex brokers list for you to check out
Silver (XAG/USD) attracts some dip-buyers in the vicinity of the $32.00 round figure and turns positive for the third consecutive day on Wednesday. The white metal climbs to a fresh weekly high during the first half of the European session, with bulls now looking to build on the momentum beyond the $33.00 mark.
From a technical perspective, the overnight sustained close above the $32.50-$32.55 hurdle confirmed a fresh breakout through a short-term trading range and favors bullish traders. This, along with positive oscillators on the daily chart, suggests that the path of least resistance for the XAG/USD remains to the upside and supports prospects for additional gains.
The white metal now seems poised to advance further towards last Friday’s swing high, around the $33.35-$33.40 zone before aiming to reclaim the $34.00 round-figure mark. The momentum could extend further towards the $34.45 intermediate hurdle and eventually lift the XAG/USD to the $35.00 neighborhood, or the multi-year peak touched in October.
On the flip side, any meaningful corrective pullback now seems to find decent support near the $32.00-$31.90 region. A further slide could be seen as a buying opportunity, which, in turn, should limit the downside for the XAG/USD near the $31.75-$31.70 horizontal zone. A convincing break below the latter might shift the near-term bias in favor of bearish traders.
The XAG/USD might then accelerate the fall towards retesting the 100-day Simple Moving Average (SMA), currently pegged near the $31.20 area, en route to the $31.00 round figure mark. Some follow-through should pave the way for a fall toward the next relevant support near the $30.25 region, the $30.00 psychological mark, and the $29.55-$29.50 horizontal zone.
Silver is a precious metal highly traded among investors. It has been historically used as a store of value and a medium of exchange. Although less popular than Gold, traders may turn to Silver to diversify their investment portfolio, for its intrinsic value or as a potential hedge during high-inflation periods. Investors can buy physical Silver, in coins or in bars, or trade it through vehicles such as Exchange Traded Funds, which track its price on international markets.
Silver prices can move due to a wide range of factors. Geopolitical instability or fears of a deep recession can make Silver price escalate due to its safe-haven status, although to a lesser extent than Gold’s. As a yieldless asset, Silver tends to rise with lower interest rates. Its moves also depend on how the US Dollar (USD) behaves as the asset is priced in dollars (XAG/USD). A strong Dollar tends to keep the price of Silver at bay, whereas a weaker Dollar is likely to propel prices up. Other factors such as investment demand, mining supply – Silver is much more abundant than Gold – and recycling rates can also affect prices.
Silver is widely used in industry, particularly in sectors such as electronics or solar energy, as it has one of the highest electric conductivity of all metals – more than Copper and Gold. A surge in demand can increase prices, while a decline tends to lower them. Dynamics in the US, Chinese and Indian economies can also contribute to price swings: for the US and particularly China, their big industrial sectors use Silver in various processes; in India, consumers’ demand for the precious metal for jewellery also plays a key role in setting prices.
Silver prices tend to follow Gold’s moves. When Gold prices rise, Silver typically follows suit, as their status as safe-haven assets is similar. The Gold/Silver ratio, which shows the number of ounces of Silver needed to equal the value of one ounce of Gold, may help to determine the relative valuation between both metals. Some investors may consider a high ratio as an indicator that Silver is undervalued, or Gold is overvalued. On the contrary, a low ratio might suggest that Gold is undervalued relative to Silver.
Silver (XAG/USD) attracts some dip-buyers in the vicinity of the $32.00 round figure and turns positive for the third consecutive day on Wednesday. The white metal climbs to a fresh weekly high during the first half of the European session, with bulls now looking to build on the momentum beyond the $33.00 mark.
From a technical perspective, the overnight sustained close above the $32.50-$32.55 hurdle confirmed a fresh breakout through a short-term trading range and favors bullish traders. This, along with positive oscillators on the daily chart, suggests that the path of least resistance for the XAG/USD remains to the upside and supports prospects for additional gains.
The white metal now seems poised to advance further towards last Friday’s swing high, around the $33.35-$33.40 zone before aiming to reclaim the $34.00 round-figure mark. The momentum could extend further towards the $34.45 intermediate hurdle and eventually lift the XAG/USD to the $35.00 neighborhood, or the multi-year peak touched in October.
On the flip side, any meaningful corrective pullback now seems to find decent support near the $32.00-$31.90 region. A further slide could be seen as a buying opportunity, which, in turn, should limit the downside for the XAG/USD near the $31.75-$31.70 horizontal zone. A convincing break below the latter might shift the near-term bias in favor of bearish traders.
The XAG/USD might then accelerate the fall towards retesting the 100-day Simple Moving Average (SMA), currently pegged near the $31.20 area, en route to the $31.00 round figure mark. Some follow-through should pave the way for a fall toward the next relevant support near the $30.25 region, the $30.00 psychological mark, and the $29.55-$29.50 horizontal zone.
Silver is a precious metal highly traded among investors. It has been historically used as a store of value and a medium of exchange. Although less popular than Gold, traders may turn to Silver to diversify their investment portfolio, for its intrinsic value or as a potential hedge during high-inflation periods. Investors can buy physical Silver, in coins or in bars, or trade it through vehicles such as Exchange Traded Funds, which track its price on international markets.
Silver prices can move due to a wide range of factors. Geopolitical instability or fears of a deep recession can make Silver price escalate due to its safe-haven status, although to a lesser extent than Gold’s. As a yieldless asset, Silver tends to rise with lower interest rates. Its moves also depend on how the US Dollar (USD) behaves as the asset is priced in dollars (XAG/USD). A strong Dollar tends to keep the price of Silver at bay, whereas a weaker Dollar is likely to propel prices up. Other factors such as investment demand, mining supply – Silver is much more abundant than Gold – and recycling rates can also affect prices.
Silver is widely used in industry, particularly in sectors such as electronics or solar energy, as it has one of the highest electric conductivity of all metals – more than Copper and Gold. A surge in demand can increase prices, while a decline tends to lower them. Dynamics in the US, Chinese and Indian economies can also contribute to price swings: for the US and particularly China, their big industrial sectors use Silver in various processes; in India, consumers’ demand for the precious metal for jewellery also plays a key role in setting prices.
Silver prices tend to follow Gold’s moves. When Gold prices rise, Silver typically follows suit, as their status as safe-haven assets is similar. The Gold/Silver ratio, which shows the number of ounces of Silver needed to equal the value of one ounce of Gold, may help to determine the relative valuation between both metals. Some investors may consider a high ratio as an indicator that Silver is undervalued, or Gold is overvalued. On the contrary, a low ratio might suggest that Gold is undervalued relative to Silver.
The GBPUSD price didn’t show any strong move in the previous sessions, to continue moving around 1.2605$ level, thus, no change to the expected bullish trend scenario for the upcoming period, which targets 1.2680$ followed by 1.2765$ levels as next positive stations, reminding you that breaking 1.2605$ and holding below it will push the price to start bearish wave that targets 1.2525$ followed by 1.2415$ areas mainly.
For more: please follow us on Telegram channel.