The main category of Forex News.
You can use the search box below to find what you need.
[wd_asp id=1]
The main category of Forex News.
You can use the search box below to find what you need.
[wd_asp id=1]
February 15, 2025 – Written by Frank Davies
STORY LINK GBP/USD Forecast: Pound Sterling Posts 2025 Best Rate on Dollar Retreat
Two elements have undermined the US Dollar (USD) over the last 24 hours, but the Pound Sterling (GBP) has made headway.
As markets closed, the Pound to Dollar exchange rate (GBP/USD) was seen trading at 1.25863, while the Dollar to Pound exchange rate (USD/GBP) was at 0.79452.
There has been some relief that the Administration has not moved immediately to impose reciprocal tariffs while lower yields have also undermined the US currency.
Although there are significant doubts surrounding the UK economy, the Pound has been one of the principal winners in global markets.
GBP/CHF, for example, hit 6-month highs just above 1.1400.
The Pound to Dollar (GBP/USD) exchange rate has strengthened to 2025 highs just below 1.2600.
UoB commented; “There has been a sharp increase in momentum, and we expect GBP to strengthen further.” It sees initial resistance at 1.2600 and 1.2650.

The Pound to Euro (GBP/EUR) exchange rate has edged above the 1.2000 level.
President Trump announced the potential for reciprocal tariffs on international trade partners overnight.
There will be no immediate move to impose tariffs with the Commerce Department engaged in complex calculations and an outcome is expected by April, although there could be a longer delay.
Rabobank commented; “Although the tariffs could cause upheaval in global trade, there is still plenty of hopium that world leaders will try to strike a deal with the US president.”
According to ING, “The outcome is likely to be perhaps some eye-wateringly large tariffs against some of the key countries with which the US runs a goods deficit. The EU will certainly be in the cross-hairs since it looks like Trump is using the threat of tariffs as leverage against the EU’s digital service tax.”
ING added, “We have already been using the assumption of peak trade pressure in the second quarter of this year. The above looks consistent with that and it’s why we think the dollar will move a little stronger into the second quarter. This means the current dollar dip should be a correction rather than a meaningful new trend.”
MUFG, however, is concerned that the Administration will be looking at non-tariff factors in deciding action.
In this context, the bank is also not convinced that the dollar retreat will be sustained; “Taking everything into consideration, we are not convinced that the initial US dollar sell-off on the back of investor relief that the “reciprocal tariffs” will not be implemented until at least April will be sustained for long.”
The headline US producer prices data was slightly stronger than expected, maintaining inflation concerns. However, The components that feed through into the PCE prices index were weaker than expected.
Given that the Federal Reserve targets the PCE prices index, the data offered some reassurance.
MUFG commented, “While it does not provide justification for the Fed to cut rates soon, it has helped to bring forward expectations for the timing of the next Fed rate cut a little.”
International Money Transfer? Ask our resident FX expert a money transfer question or try John’s new, free, no-obligation personal service! ,where he helps every step of the way,
ensuring you get the best exchange rates on your currency requirements.
TAGS: Pound Dollar Forecasts
Crude oil price settles around 71.50$ level, fluctuating near the bearish channel’s resistance line that appears on the chart, while the EMA50 forms continuous negative pressure against the price, to support the chances of declining again in the upcoming sessions.
For inquiries, Contact Us.
Silver price provides more bullish bias to approach the intraday bullish channel’s resistance line that appears on the chart, which meets the waited target at 32.86$, getting continuous positive support by the EMA50, to reinforce the chances of continuing the rise in the upcoming sessions.
For inquiries, Contact Us.
Further weakness towards lower potential support levels may follow a drop below today’s low of $3.64. Potential support around the 20-Day and 50-Day MA, currently from $3.53 to $3.56 will likely be tested. Notice that the 20-Day line crossed below the 50-Day line today. That relationship should continue to provide clues going forward. Natural gas completed a $1.38 or 31.6% bearish correction at the $2.99 low two weeks ago. Given the subsequent $0.81 or 27% advance, as of today’s high, it wouldn’t be surprising to see a rest before it may be ready to proceed higher.
Other price levels to watch for support include the prior interim swing high at $3.39 from early January and this week’s low at $3.35. The $3.39 price level is confirmed by the 50% retracement of the recent advance, which is $3.40. Further down is the 61.8% Fibonacci retracement at $3.03. The $3.30 price level is also the two-week low. Notice that in both cases, there are two indicators pointing to the same of similar price area.
In the bigger picture, long-term bullish signals triggered the last quarter of 2024. There was the breakout of a large symmetrical triangle pattern and a bullish reversal of the long-term downtrend. The expectation is for the bull trend starting from the low of $1.52 to eventually continue once the correction is complete.
Notice that the recent swing low that followed the $4.37, an almost two-year high, successfully found support around the initial bull breakout area of $3.02. The subsequent bullish reaction indicates the low was likely significant and it established a higher swing high for the price structure of the uptrend.
For a look at all of today’s economic events, check out our economic calendar.
Today’s price action will leave a small possible double top. The neckline and breakdown level were at Tuesday’s low of $2,864. However, that price area is currently the next potential support level. Another bearish piece of evidence from today is that it is a key reversal day that generated the second top of a possible double top pattern. Once the bearish evidence starts to stack up, the potential for a bearish correction strengthens.
Moreover, on the weekly chart, gold is set to complete a bearish shooting star candlestick pattern this week. Therefore, a bearish weekly reversal signal will be triggered on a drop below this week’s low of $2,853. That would put gold in a position to test the 20-Day MA, now at $2,817. Notice that since the 20-Day line was reclaimed in early-January, the price of gold has stayed above the line. The line has not been tested as support since then.
Certainly, it is likely to represent support during the current bearish correction, if it does continue. If not, the most recent new high breakout level is at $2,790 and support may be seen around that price area. There is also monthly support a little lower at $2,772. Those two price levels can be considered as a potential support range from $2,790 to $2,772.
Given current price patterns, including a bullish monthly breakout that triggered this month, a bearish correction should not negate the longer bullish pattern unless there is a drop below this month’s low of 2,772. Although the month is not yet complete, that low is also a weekly low and a drop below it is bearish on its own. However, for the intermediate bullish view to be retained the 20-Day MA should show support and lead to a bullish reversal.
For a look at all of today’s economic events, check out our economic calendar.
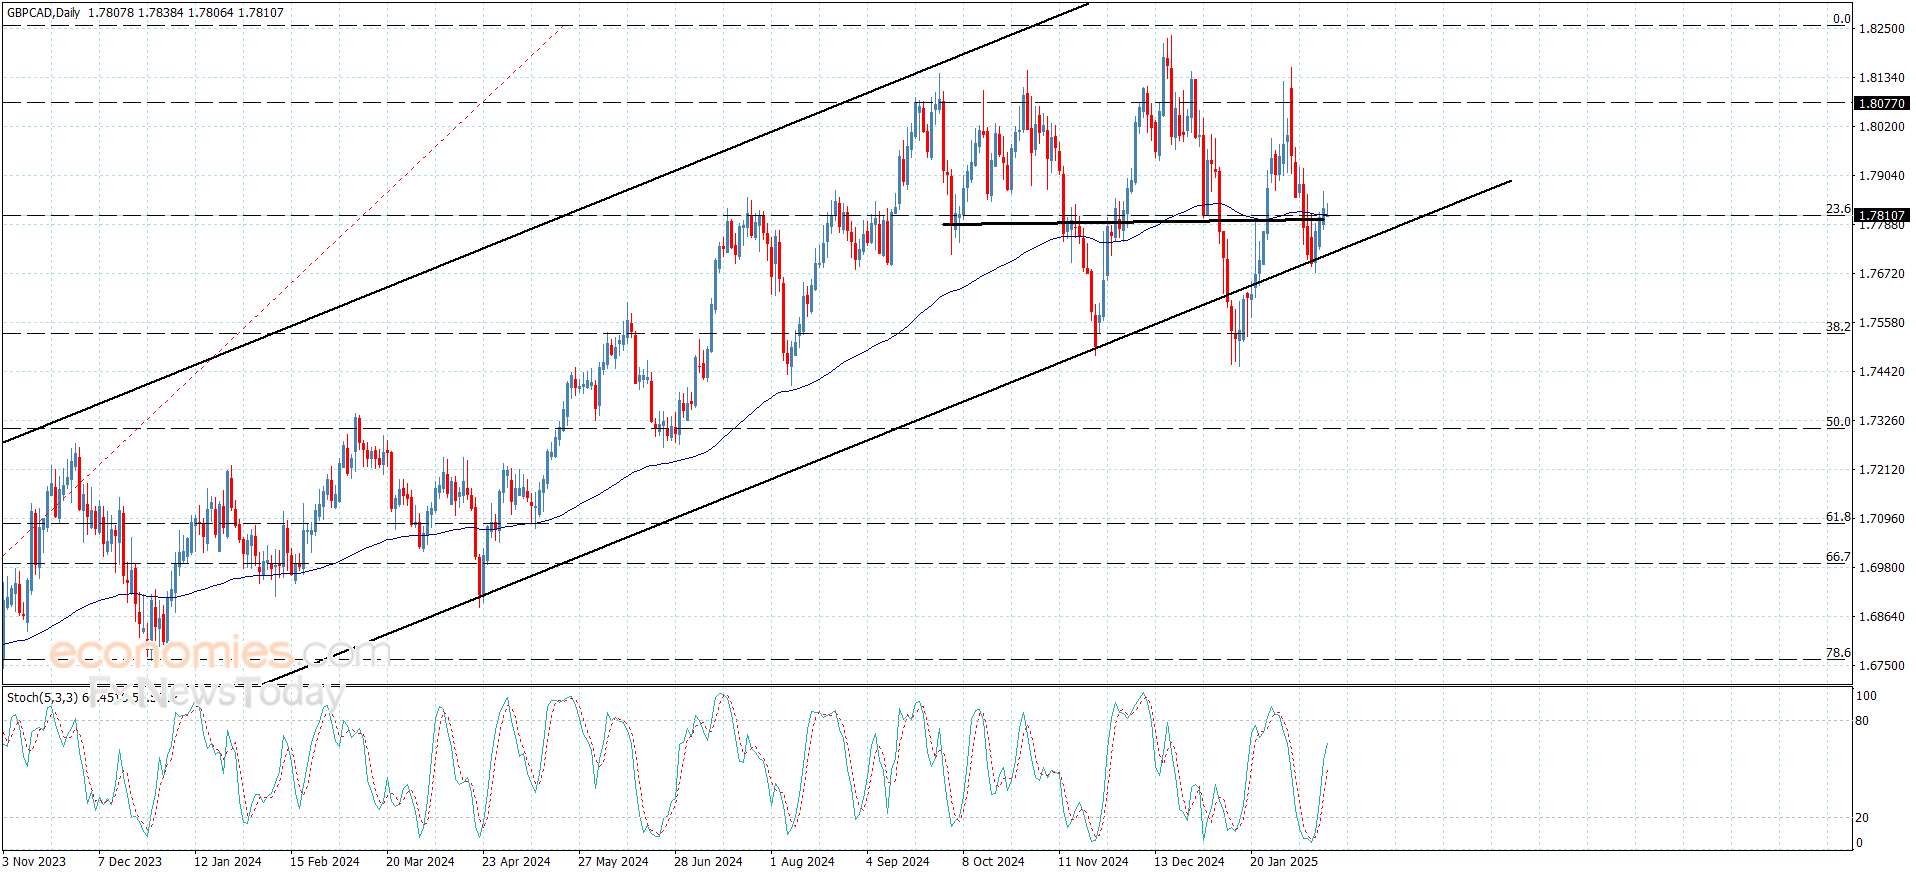
The GBPCAD price ended the correctional bearish decline by providing positive close above the bullish channel’s support line at 1.7700, to notice forming many bullish waves and achieve some gains by touching 1.7860 level followed by fluctuating near the MA55 at 1.7800.
The main stability within the bullish channel and stochastic positive momentum signals will increase the chances of gaining the positive momentum, to keep our bullish overview that might target 1.7890 followed by reaching 1.7960.
The expected trading range for today is between 1.7780 and 1.7890
Trend forecast: Bullish
Recent ConsolidationRecently trading in this market has been between the 1.05 level at the top and the 1.02 level at the bottom. At this point, we are getting fairly close to the top, and it’s probably worth noting also that the 1.05 level has a lot of noise that extends all the way to the 1.06 level. Because of this, I think you’ve got a situation where a lot of traders are going to be struggling to break out above there, but if we did see the Euro break that level, then you have to have serious discussions as to whether or not the trend has changed.Top Forex Brokers1 Get Started 74% of retail CFD accounts lose money As things stand right now, I don’t see the EUR/USD pair breaking above there, unless something drastically changes in the United States, because the European Union is starting to see signs of life in Germany and France, but they still have a long way to go as far as monetary policy is concerned. In fact, this is part of the problem with the European Union, you have countries like Spain which will be completely different than countries like Greece or Finland. I would not want the job of setting monetary policy in this scenario.EURUSD Chart by TradingViewAs things stand right now, I’m more than willing to start fading signs of exhaustion after short-term rallies, and I think ultimately this is a market that will continue to look for a long wick’s to the upside to start shorting again. This is what I’ve been doing for a couple of months, and until something fundamentally changes, or we break above the 1.06 level, there’s no reason to get long of the Euro.Ready to trade our EUR/USD analysis and predictions ? Here are the best European brokers to choose from.
MENAFN14022025000131011023ID1109206849
Legal Disclaimer:
MENAFN provides the information “as is” without warranty of any kind. We do not accept any responsibility or liability for the accuracy, content, images, videos, licenses, completeness, legality, or reliability of the information contained in this article. If you have any complaints or copyright issues related to this article, kindly contact the provider above.
Copper price confirmed its surrender to the bullish scenario by settling above the breached resistance that forms additional support now at 4.6900$, to notice approaching the first target at 4.8050$.
The price might form some sideways trades due to stochastic fluctuation within the overbought areas, to keep waiting to gather the positive momentum to ease the mission of surpassing 4.8050$ and reach new stations that might start at 4.8900$ and 4.9500$.
The expected trading range for today is between 4.7500$ and 4.8500$
Trend forecast: Bullish
Tesla’s stock price (TSLA) rose in the intraday levels after finishing the harmonic short term formation that is the AB/CD pattern, which is a positive pattern, combined with positive signals from the RSI after reaching oversold levels, amid the dominance of the main upward trend in the medium term, while still suffering due to trading below the 50-day SMA, hindering upcoming gains.
Therefore we expect more gains for the stock, targeting the important resistance of $377.30, provided the support of $326.60 holds on.
Trend forecast for today: Bullish
Silver price (XAG/USD) surges over 2.5% to near $33.30 in Friday’s North American session, the highest level seen in more than three months. The white metal soars even though risks of a global trade war have paused temporarily and the Federal Reserve (Fed) is expected to maintain a restrictive monetary policy stance for longer.
US President Donald Trump seems short of imposing reciprocal tariffs than what market participants had anticipated. Investors had expected that Trump could unveil a detailed plan of reciprocal tariffs on Thursday. The assumption was based on his tweet at his Truth Social account that “Three great weeks, perhaps the best ever, but today is the big one: reciprocal tariffs!!! Make America great again!!!”, which came in early North American trading hours on Thursday.
However, Trump only passed an order to the Commerce and Treasury departments to prepare a plan on reciprocity, which confirmed that tariffs are not happening, at least for now.
This scenario diminished fears of global uncertainty, which is technically not favorable for the Silver price.
The impact of a delay in Trump’s reciprocal tariffs is visible on the US Dollar (USD), with the US Dollar Index (DXY) revisiting the four-week low around 106.80.
According to the CME FedWatch tool, the Fed is expected to keep interest rates steady in the next three policy meetings.
Silver price breaks strongly above the key resistance of $32.50, which is plotted from the December 9 high. The outlook of the white metal was already bullish as the 20-day Exponential Moving Average (EMA) has been sloping higher, which trades around $31.60.
The 14-day Relative Strength Index (RSI) oscillates in the 60.00-80.00 range, suggesting that the momentum is strongly bullish.
Looking down, the December 9 high of $32.50 will be the key support for the Silver price. While, the October 31 high of $33.90 will be the key barrier.
Silver is a precious metal highly traded among investors. It has been historically used as a store of value and a medium of exchange. Although less popular than Gold, traders may turn to Silver to diversify their investment portfolio, for its intrinsic value or as a potential hedge during high-inflation periods. Investors can buy physical Silver, in coins or in bars, or trade it through vehicles such as Exchange Traded Funds, which track its price on international markets.
Silver prices can move due to a wide range of factors. Geopolitical instability or fears of a deep recession can make Silver price escalate due to its safe-haven status, although to a lesser extent than Gold’s. As a yieldless asset, Silver tends to rise with lower interest rates. Its moves also depend on how the US Dollar (USD) behaves as the asset is priced in dollars (XAG/USD). A strong Dollar tends to keep the price of Silver at bay, whereas a weaker Dollar is likely to propel prices up. Other factors such as investment demand, mining supply – Silver is much more abundant than Gold – and recycling rates can also affect prices.
Silver is widely used in industry, particularly in sectors such as electronics or solar energy, as it has one of the highest electric conductivity of all metals – more than Copper and Gold. A surge in demand can increase prices, while a decline tends to lower them. Dynamics in the US, Chinese and Indian economies can also contribute to price swings: for the US and particularly China, their big industrial sectors use Silver in various processes; in India, consumers’ demand for the precious metal for jewellery also plays a key role in setting prices.
Silver prices tend to follow Gold’s moves. When Gold prices rise, Silver typically follows suit, as their status as safe-haven assets is similar. The Gold/Silver ratio, which shows the number of ounces of Silver needed to equal the value of one ounce of Gold, may help to determine the relative valuation between both metals. Some investors may consider a high ratio as an indicator that Silver is undervalued, or Gold is overvalued. On the contrary, a low ratio might suggest that Gold is undervalued relative to Silver.