The main category of Forex News.
You can use the search box below to find what you need.
[wd_asp id=1]
The main category of Forex News.
You can use the search box below to find what you need.
[wd_asp id=1]
Silver price (XAG/USD) surges over 2.5% to near $33.30 in Friday’s North American session, the highest level seen in more than three months. The white metal soars even though risks of a global trade war have paused temporarily and the Federal Reserve (Fed) is expected to maintain a restrictive monetary policy stance for longer.
US President Donald Trump seems short of imposing reciprocal tariffs than what market participants had anticipated. Investors had expected that Trump could unveil a detailed plan of reciprocal tariffs on Thursday. The assumption was based on his tweet at his Truth Social account that “Three great weeks, perhaps the best ever, but today is the big one: reciprocal tariffs!!! Make America great again!!!”, which came in early North American trading hours on Thursday.
However, Trump only passed an order to the Commerce and Treasury departments to prepare a plan on reciprocity, which confirmed that tariffs are not happening, at least for now.
This scenario diminished fears of global uncertainty, which is technically not favorable for the Silver price.
The impact of a delay in Trump’s reciprocal tariffs is visible on the US Dollar (USD), with the US Dollar Index (DXY) revisiting the four-week low around 106.80.
According to the CME FedWatch tool, the Fed is expected to keep interest rates steady in the next three policy meetings.
Silver price breaks strongly above the key resistance of $32.50, which is plotted from the December 9 high. The outlook of the white metal was already bullish as the 20-day Exponential Moving Average (EMA) has been sloping higher, which trades around $31.60.
The 14-day Relative Strength Index (RSI) oscillates in the 60.00-80.00 range, suggesting that the momentum is strongly bullish.
Looking down, the December 9 high of $32.50 will be the key support for the Silver price. While, the October 31 high of $33.90 will be the key barrier.
Silver is a precious metal highly traded among investors. It has been historically used as a store of value and a medium of exchange. Although less popular than Gold, traders may turn to Silver to diversify their investment portfolio, for its intrinsic value or as a potential hedge during high-inflation periods. Investors can buy physical Silver, in coins or in bars, or trade it through vehicles such as Exchange Traded Funds, which track its price on international markets.
Silver prices can move due to a wide range of factors. Geopolitical instability or fears of a deep recession can make Silver price escalate due to its safe-haven status, although to a lesser extent than Gold’s. As a yieldless asset, Silver tends to rise with lower interest rates. Its moves also depend on how the US Dollar (USD) behaves as the asset is priced in dollars (XAG/USD). A strong Dollar tends to keep the price of Silver at bay, whereas a weaker Dollar is likely to propel prices up. Other factors such as investment demand, mining supply – Silver is much more abundant than Gold – and recycling rates can also affect prices.
Silver is widely used in industry, particularly in sectors such as electronics or solar energy, as it has one of the highest electric conductivity of all metals – more than Copper and Gold. A surge in demand can increase prices, while a decline tends to lower them. Dynamics in the US, Chinese and Indian economies can also contribute to price swings: for the US and particularly China, their big industrial sectors use Silver in various processes; in India, consumers’ demand for the precious metal for jewellery also plays a key role in setting prices.
Silver prices tend to follow Gold’s moves. When Gold prices rise, Silver typically follows suit, as their status as safe-haven assets is similar. The Gold/Silver ratio, which shows the number of ounces of Silver needed to equal the value of one ounce of Gold, may help to determine the relative valuation between both metals. Some investors may consider a high ratio as an indicator that Silver is undervalued, or Gold is overvalued. On the contrary, a low ratio might suggest that Gold is undervalued relative to Silver.
The GBP/USD price analysis shows a brighter outlook for the UK economy after GDP data revealed an unexpected expansion in Q4 last year. Meanwhile, the dollar remained fragile as the impact of Trump’s tariff threats faded.
–Are you interested in learning more about STP brokers? Check our detailed guide-
Data on Thursday revealed that the UK economy expanded by 0.1% in the fourth quarter of last year. This figure came above estimates of a 0.1% contraction. The British economy has slowed down significantly, putting pressure on the Bank of England to lower borrowing costs. The upbeat report eased some of that pressure, boosting the pound. Market participants are now pricing 54-bps of rate cuts this year by the Bank of England. If the economy shows more bright spots, rate-cut bets will drop.
On the other hand, market participants have lowered expectations for Fed rate cuts due to upbeat inflation data. Both consumer and wholesale inflation figures came in above estimates, suggesting higher rates for longer in the US. Initially, the more hawkish outlook boosted the dollar.
However, the focus shifted to Trump tariffs, leading to a drop in the US currency. Reports revealed that there will be delays in implementing Trump’s reciprocal tariff. As a result, market participants believe this will give countries time to negotiate better trading deals.
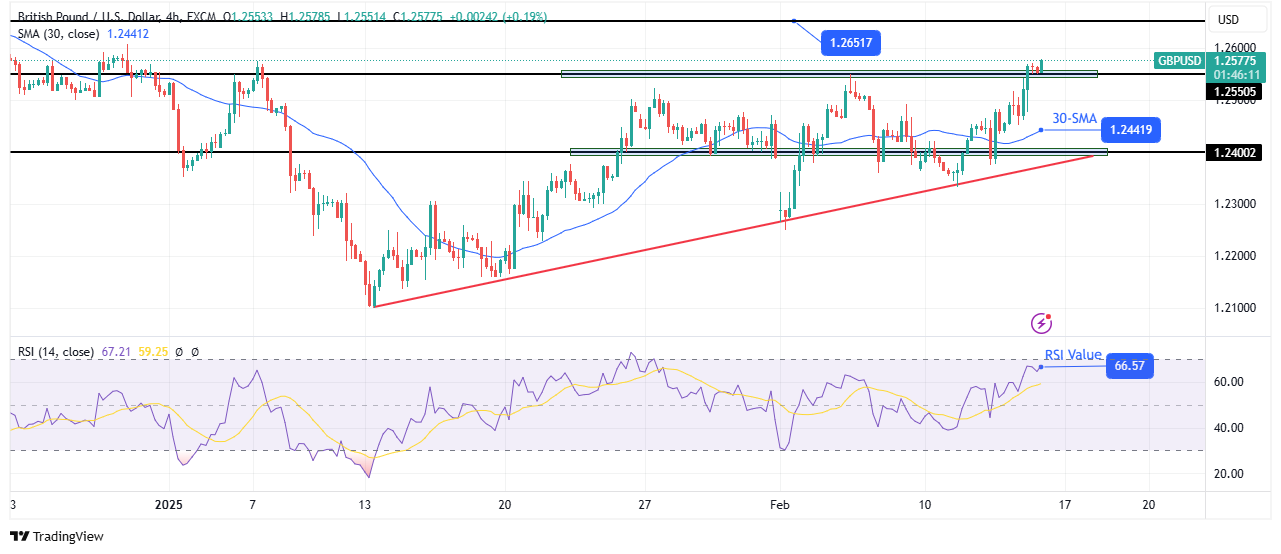
On the technical side, the GBP/USD price has broken above the 1.2550 resistance level to make a new high in the bullish trend. Moreover, the price trades far above the 30-SMA, and the RSI is nearing the overbought level, indicating solid bullish momentum. If the rally continues, the price will reach the 1.2651 level.
–Are you interested in learning more about making money with forex? Check our detailed guide-
However, the price has maintained a shallow uptrend on a larger scale. As a result, when the price forms a new high, it is near the previous high. This means the price returns to the bullish support trendline soon after making a new high.
If this is the case, the price will soon reverse to break below the 30-SMA and retest the support trendline. Nevertheless, it will keep making higher highs if it stays above the trendline.
Looking to trade forex now? Invest at eToro!
68% of retail investor accounts lose money when trading CFDs with this provider. You should consider whether you can afford to take the high risk of losing your money.
Gold price is taking a breather while holding near $2,930 early Friday, having witnessed two straight days of impressive gains.
Despite the pause, Gold price remains on track to book its seventh straight weekly gain, mainly supported by US President Donald Trump’s reciprocal tariffs updates and increased expectations that the US Federal Reserve (Fed) could stick with its easing trajectory this year.
Following a hot January US Consumer Price Index (CPI) data, the Producer Price Index (PPI) also surprised markets to the upside. However, the index’s components cooled down, reinforcing dovish expectations around the Fed’s rate cut prospects.
Reuters reported, “Following the PPI data, US rate futures priced in 31 basis points (bps) of easing this year, compared with 27 bps late on Wednesday, according to LSEG calculations. The next rate reduction is expected either at the October or December meeting.”
This led to a sharp sell-off in the US Treasury bond yields and the US Dollar (USD), benefiting the non-yielding Gold price.
Additionally, the narrative that the plan for Trump’s reciprocal tariffs is in the works and would not be imposed immediately relieved global stocks and weighed heavily on the haven demand for the USD across the board, pushing Gold price northward.
Gold traders shrugged off prospects of Russia-Ukraine peace talks as the focus remained on Trump’s tariffs and the US inflation data.
On Thursday, the Kremlin came out with a statement that “there is a political will on both sides to engage in dialogue and search for a settlement when asked about a possible Russia-Ukraine peace deal.
Looking ahead, Gold price could see a profit-taking decline as traders cash in their Gold longs after this week’s record rally and heading into a long weekend. Fresh developments surrounding Trump’s tariffs and the broader market sentiment will continue playing a pivotal role in the Gold price direction.
The high-impact US Retail Sales data will be also closely followed for fresh cues on the Fed’s policy outlook and the value of the USD, eventually impacting Gold price.
The daily chart shows that Gold price could pull back briefly toward the rising trendline support at $2,892.
The 14-day Relative Strength Index (RSI) has turned flat while holding within the overbought territory, suggesting a fresh dip could be in the offing.
If the selling pressure intensifies below the abovementioned support level, the Gold price could accelerate the downside toward the $2,850 psychological barrier.
Conversely, if the upside momentum regains traction, Gold buyers will challenge the record high of $2,943.
The next relevant resistance is seen at the $3,000 round level.
Gold has played a key role in human’s history as it has been widely used as a store of value and medium of exchange. Currently, apart from its shine and usage for jewelry, the precious metal is widely seen as a safe-haven asset, meaning that it is considered a good investment during turbulent times. Gold is also widely seen as a hedge against inflation and against depreciating currencies as it doesn’t rely on any specific issuer or government.
Central banks are the biggest Gold holders. In their aim to support their currencies in turbulent times, central banks tend to diversify their reserves and buy Gold to improve the perceived strength of the economy and the currency. High Gold reserves can be a source of trust for a country’s solvency. Central banks added 1,136 tonnes of Gold worth around $70 billion to their reserves in 2022, according to data from the World Gold Council. This is the highest yearly purchase since records began. Central banks from emerging economies such as China, India and Turkey are quickly increasing their Gold reserves.
Gold has an inverse correlation with the US Dollar and US Treasuries, which are both major reserve and safe-haven assets. When the Dollar depreciates, Gold tends to rise, enabling investors and central banks to diversify their assets in turbulent times. Gold is also inversely correlated with risk assets. A rally in the stock market tends to weaken Gold price, while sell-offs in riskier markets tend to favor the precious metal.
The price can move due to a wide range of factors. Geopolitical instability or fears of a deep recession can quickly make Gold price escalate due to its safe-haven status. As a yield-less asset, Gold tends to rise with lower interest rates, while higher cost of money usually weighs down on the yellow metal. Still, most moves depend on how the US Dollar (USD) behaves as the asset is priced in dollars (XAU/USD). A strong Dollar tends to keep the price of Gold controlled, whereas a weaker Dollar is likely to push Gold prices up.
EUR/USD gathered bullish momentum in the late American session on Thursday and gained nearly 0.8% on the day. After touching its highest level since January 28 above 1.0470 in the Asian session on Friday, the pair seems to have entered a consolidation phase near 1.0460 in the European morning.
The table below shows the percentage change of Euro (EUR) against listed major currencies this week. Euro was the strongest against the Japanese Yen.
| USD | EUR | GBP | JPY | CAD | AUD | NZD | CHF | |
|---|---|---|---|---|---|---|---|---|
| USD | -1.47% | -1.51% | 0.90% | -0.89% | -0.98% | -0.69% | -0.65% | |
| EUR | 1.47% | 0.03% | 2.54% | 0.73% | 0.49% | 0.88% | 0.90% | |
| GBP | 1.51% | -0.03% | 2.34% | 0.65% | 0.46% | 0.85% | 0.88% | |
| JPY | -0.90% | -2.54% | -2.34% | -1.81% | -1.80% | -1.58% | -1.52% | |
| CAD | 0.89% | -0.73% | -0.65% | 1.81% | -0.07% | 0.17% | 0.20% | |
| AUD | 0.98% | -0.49% | -0.46% | 1.80% | 0.07% | 0.39% | 0.41% | |
| NZD | 0.69% | -0.88% | -0.85% | 1.58% | -0.17% | -0.39% | 0.03% | |
| CHF | 0.65% | -0.90% | -0.88% | 1.52% | -0.20% | -0.41% | -0.03% |
The heat map shows percentage changes of major currencies against each other. The base currency is picked from the left column, while the quote currency is picked from the top row. For example, if you pick the Euro from the left column and move along the horizontal line to the US Dollar, the percentage change displayed in the box will represent EUR (base)/USD (quote).
EUR/USD edged lower in the early American session on Thursday after US President Donald Trump hinted in a social media post that they could announce reciprocal tariffs.
Later in the day, Trump refrained from imposing new tariffs, instead he signed a memo ordering his economics team to devise a plan for reciprocal tariffs on every country that charges duties on US imports. Markets breathed a sigh of relief with this development, allowing risk flows to return and causing the USD to weaken. In turn, EUR/USD gained traction and closed the day decisively higher.
Meanwhile, Trump’s trade adviser, Peter Navarro, called German auto tariffs “grossly unfair” and a White House official said that Trump will no longer tolerate the EU’s value-added tax.
In the second half of the day, January Retail Sales data will be featured in the US economic calendar. Markets expect a decrease of 0.1% on a monthly basis. A positive surprise could help the USD stay resilient against its rivals with the immediate reaction. Nevertheless, EUR/USD’s losses are likely to remain limited in case risk flows continue to dominate the action in the financial markets. At the time of press, US stock index futures were trading marginally higher on the day.
The Relative Strength Index (RSI) indicator on the 4-hour chart stays above 70, suggesting that EUR/USD correct lower before extending its uptrend.
On the upside, 1.0500-1.0510 (round level, Fibonacci 78.6% retracement of the latest downtrend) could be seen as the resistance area before 1.0550 (static level) and 1.0600 (static level, beginning point of the downtrend). Looking south, first support could be spotted at 1.0440 (100-period Simple Moving Average (SMA), Fibonacci 61.8% retracement) ahead of 1.0400 (Fibonacci 50% retracement) and 1.0350-1.0360 (Fibonacci 38.2% retracement, 200-period SMA).
The Euro is the currency for the 19 European Union countries that belong to the Eurozone. It is the second most heavily traded currency in the world behind the US Dollar. In 2022, it accounted for 31% of all foreign exchange transactions, with an average daily turnover of over $2.2 trillion a day. EUR/USD is the most heavily traded currency pair in the world, accounting for an estimated 30% off all transactions, followed by EUR/JPY (4%), EUR/GBP (3%) and EUR/AUD (2%).
The European Central Bank (ECB) in Frankfurt, Germany, is the reserve bank for the Eurozone. The ECB sets interest rates and manages monetary policy. The ECB’s primary mandate is to maintain price stability, which means either controlling inflation or stimulating growth. Its primary tool is the raising or lowering of interest rates. Relatively high interest rates – or the expectation of higher rates – will usually benefit the Euro and vice versa. The ECB Governing Council makes monetary policy decisions at meetings held eight times a year. Decisions are made by heads of the Eurozone national banks and six permanent members, including the President of the ECB, Christine Lagarde.
Eurozone inflation data, measured by the Harmonized Index of Consumer Prices (HICP), is an important econometric for the Euro. If inflation rises more than expected, especially if above the ECB’s 2% target, it obliges the ECB to raise interest rates to bring it back under control. Relatively high interest rates compared to its counterparts will usually benefit the Euro, as it makes the region more attractive as a place for global investors to park their money.
Data releases gauge the health of the economy and can impact on the Euro. Indicators such as GDP, Manufacturing and Services PMIs, employment, and consumer sentiment surveys can all influence the direction of the single currency. A strong economy is good for the Euro. Not only does it attract more foreign investment but it may encourage the ECB to put up interest rates, which will directly strengthen the Euro. Otherwise, if economic data is weak, the Euro is likely to fall. Economic data for the four largest economies in the euro area (Germany, France, Italy and Spain) are especially significant, as they account for 75% of the Eurozone’s economy.
Another significant data release for the Euro is the Trade Balance. This indicator measures the difference between what a country earns from its exports and what it spends on imports over a given period. If a country produces highly sought after exports then its currency will gain in value purely from the extra demand created from foreign buyers seeking to purchase these goods. Therefore, a positive net Trade Balance strengthens a currency and vice versa for a negative balance.
The GBPJPY pair ended the recent bullish rally by recording 191.17 level, approaching 193.30 barrier to force it to postpone the bullish attack and provide mixed trades by fluctuating near 191.80.
Also, the contradiction between the major indicators by the MA55 consolidation above the mentioned barrier confirm the price surrender to the domination of the sideways bias, to expect moving between the current barrier and 190.80 additional support.
The expected trading range for today is between 191.00 and 193.30
Trend forecast: Sideways
Natural gas price continued its bullish rally to record 3.800$ level yesterday, approaching the major resistance to push it to form temporary negative rebound by fluctuating near 3.710$.
Note that the continuous fluctuation below the current resistance and stochastic exit from the overbought areas might increase the negative pressures on the price, to expect crawling towards 3.620$ level soon, followed by attempting to test the additional support at 3.520$.
The expected trading range for today is between 3.620$ and 3.830$
Trend forecast: Bearish
The EURJPY pair touched 161.18 level followed by declining below 160.25 barrier again due to the continuous contradiction between the major indicators to force it to postpone the bullish rally for now.
The price might continue to provide mixed trades until confirming breaching the mentioned barrier to reinforce the chances of achieving new gains that might extend towards 161.65 and 162.40 levels first, while declining below 159.00 will force it to suffer big losses by crawling towards 157.90 and 157.30 levels.
The expected trading range for today is between 159.20 and 160.25
Trend forecast: Sideways
Tesla’s stock price (TSLA) rose in the intraday levels after finishing the harmonic short term formation that is the AB/CD pattern, which is a positive pattern, combined with positive signals from the RSI after reaching oversold levels, amid the dominance of the main upward trend in the medium term, while still suffering due to trading below the 50-day SMA, hindering upcoming gains.
Therefore we expect more gains for the stock, targeting the important resistance of $377.30, provided the support of $326.60 holds on.
Trend forecast for today: Bullish
Silver price provides more bullish bias to approach the intraday bullish channel’s resistance line that appears on the chart, which meets the waited target at 32.86$, getting continuous positive support by the EMA50, to reinforce the chances of continuing the rise in the upcoming sessions.
For inquiries, Contact Us.
Tesla’s stock price (TSLA) rose in the intraday levels after finishing the harmonic short term formation that is the AB/CD pattern, which is a positive pattern, combined with positive signals from the RSI after reaching oversold levels, amid the dominance of the main upward trend in the medium term, while still suffering due to trading below the 50-day SMA, hindering upcoming gains.
Therefore we expect more gains for the stock, targeting the important resistance of $377.30, provided the support of $326.60 holds on.
Trend forecast for today: Bullish