The main category of Forex News.
You can use the search box below to find what you need.
[wd_asp id=1]
The main category of Forex News.
You can use the search box below to find what you need.
[wd_asp id=1]
Silver price (XAG/USD) rebounds from recent declines, hovering near $32.00 per troy ounce during Monday’s Asian session. A daily chart analysis indicates a sustained bullish trend, with the metal price advancing within an ascending channel.
The XAG/USD pair remains above the nine-day and 14-day Exponential Moving Averages (EMAs), signaling strong short-term momentum. Additionally, the 14-day Relative Strength Index (RSI) stays above the 50 mark, further supporting the prevailing bullish sentiment.
Silver price could encounter initial resistance at its three-month high of $32.65, last tested on February 7, aligning with the upper boundary of the ascending channel. A decisive breakout above this level could strengthen the bullish trend, potentially driving the XAG/USD pair toward the psychological mark of $33.00.
On the downside, support is found at the nine-day EMA at $31.71, followed by the 14-day EMA at $31.44, and the ascending channel’s lower boundary at $31.10. A breach below this key support zone could weaken the bullish outlook, exposing the XAG/USD pair to further downside toward its five-month low of $28.74, recorded on December 19.
Silver is a precious metal highly traded among investors. It has been historically used as a store of value and a medium of exchange. Although less popular than Gold, traders may turn to Silver to diversify their investment portfolio, for its intrinsic value or as a potential hedge during high-inflation periods. Investors can buy physical Silver, in coins or in bars, or trade it through vehicles such as Exchange Traded Funds, which track its price on international markets.
Silver prices can move due to a wide range of factors. Geopolitical instability or fears of a deep recession can make Silver price escalate due to its safe-haven status, although to a lesser extent than Gold’s. As a yieldless asset, Silver tends to rise with lower interest rates. Its moves also depend on how the US Dollar (USD) behaves as the asset is priced in dollars (XAG/USD). A strong Dollar tends to keep the price of Silver at bay, whereas a weaker Dollar is likely to propel prices up. Other factors such as investment demand, mining supply – Silver is much more abundant than Gold – and recycling rates can also affect prices.
Silver is widely used in industry, particularly in sectors such as electronics or solar energy, as it has one of the highest electric conductivity of all metals – more than Copper and Gold. A surge in demand can increase prices, while a decline tends to lower them. Dynamics in the US, Chinese and Indian economies can also contribute to price swings: for the US and particularly China, their big industrial sectors use Silver in various processes; in India, consumers’ demand for the precious metal for jewellery also plays a key role in setting prices.
Silver prices tend to follow Gold’s moves. When Gold prices rise, Silver typically follows suit, as their status as safe-haven assets is similar. The Gold/Silver ratio, which shows the number of ounces of Silver needed to equal the value of one ounce of Gold, may help to determine the relative valuation between both metals. Some investors may consider a high ratio as an indicator that Silver is undervalued, or Gold is overvalued. On the contrary, a low ratio might suggest that Gold is undervalued relative to Silver.
Silver price faced clear negative pressure in the previous sessions, as it reached the key support at 31.63$, which forms good barrier against the price, noticing that the EMA50 meets this level to add more strength to it, while stochastic shows clear positive signals now.
For inquiries, Contact Us.
Risk aversion keeps fueling Gold demand, with the bright metal conquering the $2,900 threshold on Monday. Demand for safety was boosted by comments from United States (US) President Donald Trump, who pledged to impose more tariffs over the weekend.
Speaking to reporters on Air Force One, President Trump said on Sunday he would introduce new 25% tariffs on all steel and aluminium imports into the US while adding that he would soon announce reciprocal tariffs to all countries that levy US goods and services. XAU/USD extended gains towards $2,911.21 during American trading hours, hovering nearby at the time of writing.
Demand for safe-haven assets persists despite the positive tone of equities. The US Dollar (USD) trades with a firmer tone against its high-yielding rivals, while demand for Gold and the Japanese Yen (JPY) exceeds that of the Greenback. Meanwhile, Wall Street holds on to modest intraday gains, although caution prevails as investors await fresh Trump’s headlines.
The focus this week will remain on the US. Federal Reserve (Fed) Chairman Jerome Powell will testify before Congress on Tuesday and Wednesday, with market players looking for fresh clues on the future of monetary policy. Additionally, the US will publish the January Consumer Price Index (CPI) on Wednesday, with the core annual reading foreseen at 3.1%, easing from the 3.2% posted in December.
From a technical point of view, XAU/USD is poised to extend its rally. The daily chart shows it retreated from its fresh peak and trades around the $2,900 mark. Technical indicators maintain their upward slopes well into overbought territory without signs of upward exhaustion. Furthermore, the 20 Simple Moving Average (SMA) accelerated north well above bullish 100 and 200 SMAs while developing roughly $140.00 below the current level. A corrective decline is not out of the picture, yet higher highs lay ahead.
In the near term, and according to the 4-hour chart, XAU/USD is bullish, although a corrective decline is not out of the picture. The Momentum indicator heads firmly north, well above its 100 line, while the Relative Strength Index (RSI) indicator consolidates at around 73. Moving averages, in the meantime, head firmly north, far below the current level, with a bullish 20 Simple Moving Average (SMA) providing intraday support at $2,870.10.
Support levels: 2,886.60 2,872.30 2,855.45
Resistance levels: 2,911.60 2,925.00 2,940.00
According to recent trades on reliable trading platforms, the Japanese Yen has gained strength against other major currencies with growing expectations that the Bank of Japan will continue to raise interest rates this year. On Thursday last week, Bank of Japan board member Naoki Tamura stated that the central bank should raise the interest rate to at least 1% in the latter part of the 2025 fiscal year. Recent economic data also revealed a 2.7% year-on-year increase in household spending in Japan, which represents the first growth in five months and significantly exceeds the expected 0.2% gain.
In addition, data earlier this week showed that real wages rose for a second straight month in December, with nominal wage growth hitting its highest level in nearly three decades, largely driven by higher winter bonuses. Now, financial markets are speculating that Japan’s annual spring wage negotiations could yield another 5% increase this year.

We recommend buying the USD/JPY from any downward level but without taking excessive risk.
At the end of last week’s trading, US stock markets were under selling pressure, as concerns about tariffs and inflation escalated again in Wall Street markets. According to stock trading platforms, the Standard & Poor’s 500 index fell by 0.9%, giving up the week’s gains. This is one of the worst declines for the index so far in the new year, but it remains close to the record it set two weeks ago.
According to trading, the Dow Jones Industrial Average fell by 444 points, the most prominent of which was a sharp decline in Amazon shares after its latest earnings report, which led to the Nasdaq Composite Index losing a market-leading 1.4%.
Conversely, US Treasury yields rose following a disappointing report on Friday morning that indicated a significant deterioration in sentiment among US consumers. The preliminary report from the University of Michigan showed that US consumers expect inflation to reach 4.3% in the coming year, the highest forecast since 2023. This was a full percentage point higher than what consumers expected a month ago, marking the second consecutive unusually large increase. Economists pointed to the possibility of imposing US tariffs on a wide range of imported products, as suggested by President Donald Trump, which could ultimately lead to higher prices for US consumers.
For his part, Trump said at a White House news conference on Friday that he would likely make an announcement on Monday or Tuesday about “reciprocal tariffs, where one country pays a lot or we pay a lot, and we do the same.”
The U.S. consumer sentiment data followed a mixed update on the labour market, often the most widely anticipated economic report each month. The data showed that U.S. hiring last month was less than half the rate in December, but it also included encouraging signs for workers: The unemployment rate fell, and workers saw bigger gains in average wages than economists had expected. Overall, all the data combined could keep the Fed on hold when it comes to US interest rates. The Fed began cutting its key interest rate in September to ease pressure on the economy and labour market, but warned at the end of the year that it may cut less frequently in 2025 than previously expected given concerns about stubbornly high inflation.
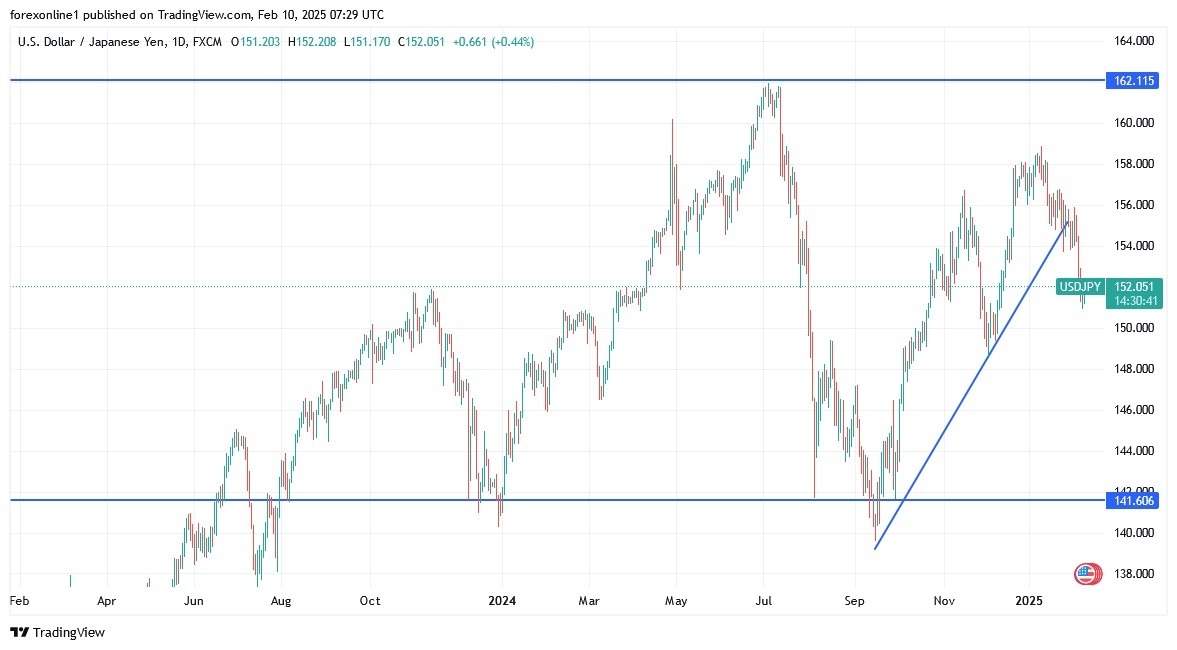
In recent trades, the USD/JPY currency pair has been trading below the 100-hour moving average. The pair rebounded to avoid reaching oversold levels on the 14-hour Relative Strength Index. In the near term, bears will aim to continue the current decline towards support levels of 151.20 or lower to the psychological level of 150.00. Conversely, bulls will aim to take advantage of rebounds to around 152.00 or higher at the resistance of 153.20.
In the long term, based on the daily chart, USD/JPY is also trading in a descending channel formation. Technically, the 14-day RSI continues to support the bearish bias as it approaches oversold levels. Therefore, bears will target long-term declines around 148.85 or lower at 145.00 support. Conversely, on the same time frame, bulls will look to capitalize on a bounce higher for gains around 155.30 or higher at 158.00 resistance.
Want to trade our USD/JPY forex analysis and predictions? Here’s a list of forex brokers in Japan to check out.
Blackberry’s stock price (BB) kept rising in the intraday levels, amid the dominance of the upward short-term trend, with positive pressure from trading above the 50-day SMA, coupled with positive signals from the RSI despite settling at overbought levels, and accompanied by a surge in trading volumes.
Therefore we expect more gains for the stock, targeting the pivotal resistance of $5.75, provided the support of $4.35 holds on.
Trend forecast for today: Bullish
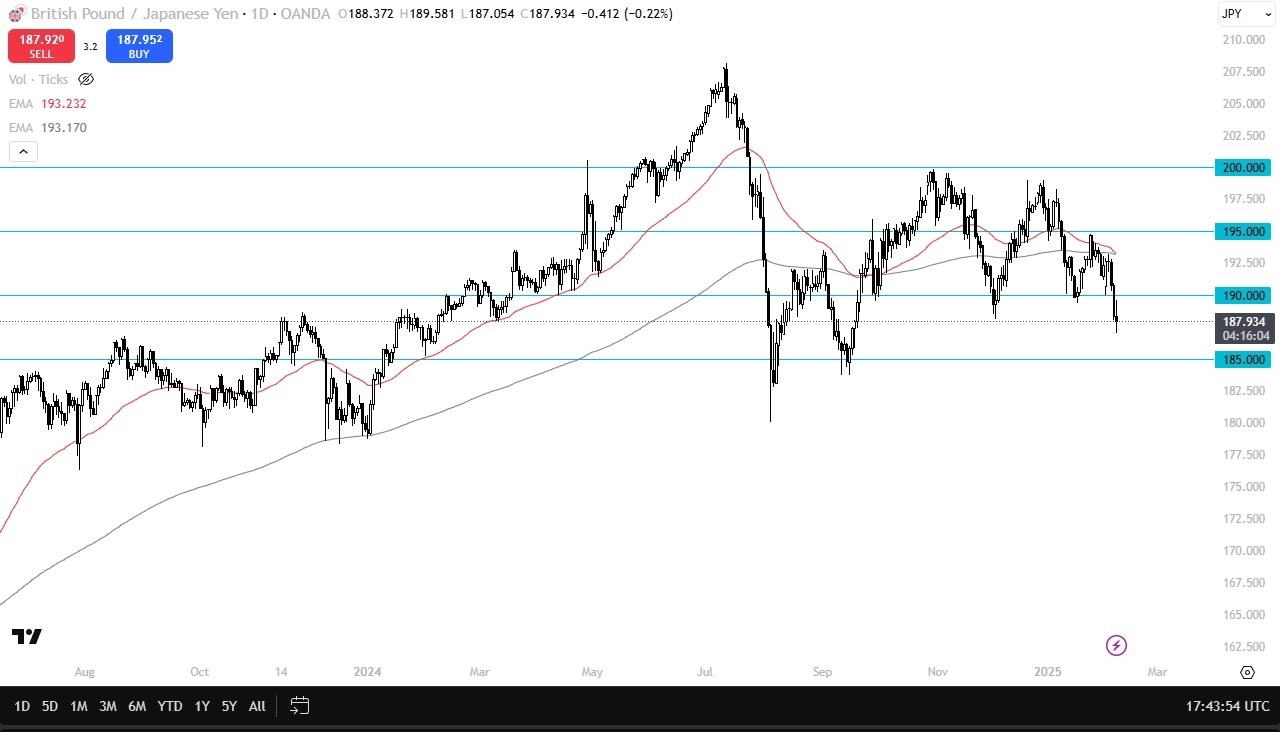
But at the same time, we had the Bank of England on Thursday cut rates by 50 basis points, and there were several members, I think two out of the nine or three out of the nine were looking to cut even deeper. So that being said, it looks like the Bank of England is probably on a rate cutting cycle, and that will continue to work against the British pound in general.
However, if the Japanese yen starts to lose strength, what I think is that the British pound with its higher interest rate swap is going to continue to attract inflows. And therefore, I would expect some type of recovery if we did in fact see the Japanese yen fail against other currencies.
In this pair, I think a daily close above the 190 yen level would get the market in an upward move probably towards the 50 day EMA, presently sitting around the 193 yen level. If we break down below the lows of the candlestick for Friday, then 185 yen is your next support level. And I think that would of course be tested. In general, I would expect a lot of noisy trading in this area as the market will continue to have to try to gauge where both of these central banks are currently heading.
Begin trading our daily forecasts and analysis. Here is a list of Forex brokers in Japan to work with.
Silver price (XAG/USD) rebounds from recent declines, hovering near $32.00 per troy ounce during Monday’s Asian session. A daily chart analysis indicates a sustained bullish trend, with the metal price advancing within an ascending channel.
The XAG/USD pair remains above the nine-day and 14-day Exponential Moving Averages (EMAs), signaling strong short-term momentum. Additionally, the 14-day Relative Strength Index (RSI) stays above the 50 mark, further supporting the prevailing bullish sentiment.
Silver price could encounter initial resistance at its three-month high of $32.65, last tested on February 7, aligning with the upper boundary of the ascending channel. A decisive breakout above this level could strengthen the bullish trend, potentially driving the XAG/USD pair toward the psychological mark of $33.00.
On the downside, support is found at the nine-day EMA at $31.71, followed by the 14-day EMA at $31.44, and the ascending channel’s lower boundary at $31.10. A breach below this key support zone could weaken the bullish outlook, exposing the XAG/USD pair to further downside toward its five-month low of $28.74, recorded on December 19.
Silver is a precious metal highly traded among investors. It has been historically used as a store of value and a medium of exchange. Although less popular than Gold, traders may turn to Silver to diversify their investment portfolio, for its intrinsic value or as a potential hedge during high-inflation periods. Investors can buy physical Silver, in coins or in bars, or trade it through vehicles such as Exchange Traded Funds, which track its price on international markets.
Silver prices can move due to a wide range of factors. Geopolitical instability or fears of a deep recession can make Silver price escalate due to its safe-haven status, although to a lesser extent than Gold’s. As a yieldless asset, Silver tends to rise with lower interest rates. Its moves also depend on how the US Dollar (USD) behaves as the asset is priced in dollars (XAG/USD). A strong Dollar tends to keep the price of Silver at bay, whereas a weaker Dollar is likely to propel prices up. Other factors such as investment demand, mining supply – Silver is much more abundant than Gold – and recycling rates can also affect prices.
Silver is widely used in industry, particularly in sectors such as electronics or solar energy, as it has one of the highest electric conductivity of all metals – more than Copper and Gold. A surge in demand can increase prices, while a decline tends to lower them. Dynamics in the US, Chinese and Indian economies can also contribute to price swings: for the US and particularly China, their big industrial sectors use Silver in various processes; in India, consumers’ demand for the precious metal for jewellery also plays a key role in setting prices.
Silver prices tend to follow Gold’s moves. When Gold prices rise, Silver typically follows suit, as their status as safe-haven assets is similar. The Gold/Silver ratio, which shows the number of ounces of Silver needed to equal the value of one ounce of Gold, may help to determine the relative valuation between both metals. Some investors may consider a high ratio as an indicator that Silver is undervalued, or Gold is overvalued. On the contrary, a low ratio might suggest that Gold is undervalued relative to Silver.
Forex pairs & markets covered in this week’s weekly forex forecast & forex analysis:
Forex pairs & markets covered in this week’s Weekly Forex Forecast & Forex Analysis:
USD (DXY), EUR, GBP, CHF, JPY, CAD, AUD & NZD.
Crude Oil, EUR/USD, GBP/NZD, GBP/CAD, EUR/GBP, NZD/JPY, AUD/JPY, EUR/JPY, NZD/CAD, AUD/CAD, EUR/CAD.
Gold analysis – XAU/USD and Silver analysis – XAG/USD.
Crude oil price shows sideways trades in the previous sessions, and fluctuates around 71.65$ now, waiting to get negative motive that assist to push the price to resume the expected bearish trend for the upcoming period, which gets continuous support by the EMA50.
For inquiries, Contact Us.
In a significant event last week, the Bank of England cut its forecast for UK economic growth this year by half and lowered its benchmark interest rate by 25 basis points to 4.5%, its lowest level since mid-2023.
Obviously, this decision was widely expected in financial markets. the bank now expects the UK economy to grow by just 0.75% this year, down from its previous forecast of 1.5% just three months ago. If this turns out to be remotely accurate, it would be deeply disappointing news for Britain’s new Labour government, which has made growth its top priority as it boosts living standards and generates funds for cash-strapped public services. With growth proving difficult to achieve, the party’s popularity has fallen sharply since its election victory in July.
Financial markets remain uncertain about how many more cuts will be made this year, with the Bank also forecasting higher-than-expected inflation over the next few months – it expects inflation to hit 3.7% sometime in the first half of the year, before drifting back towards its 2% target. Against this backdrop of growth and inflation, Bank Governor Andrew Bailey said the outlook for the UK economy remains uncertain, and uncertainty could increase if US President Donald Trump follows through on his tariff threats.
Keep in mind that sterling is a risk currency, and its gains will not improve without a return to confidence in the future of global growth and the performance of the new British government.
In this regard, according to Deutsche Bank. The Bank of England is likely to cut interest rates five times in 2025. For his part, according to Sanjay Raja, chief economist at Deutsche Bank, the Bank of England is ready to implement multiple rate cuts throughout 2025. In its latest research note, Deutsche Bank now expects five rate cuts this year, up from its previous forecast of four.
Last week, the Bank of England’s Monetary Policy Committee cut interest rates by 25 basis points to 4.5% as part of its easing cycle and lowered its economic growth forecasts while raising its inflation forecasts. Despite inflation expected to reach 3.7% this year, the analyst said, “the door remains wide open for further rate cuts” given the prevailing economic conditions and mixed inflation outlook. The minutes of the latest Monetary Policy Committee meeting revealed divisions within the committee, with seven members supporting a quarter-point cut and two members calling for a more aggressive 50 basis point cut.
Surprisingly, Catherine Mann joined Swati Dhingra in voting for a faster pace of rate cuts of 50 basis points. The analyst noted that “weaker activity and lower demand for labour are likely to reduce wage pressures as well as firms’ pricing power.”
Given the economic conditions, Deutsche Bank expects the Bank of England to deliver another rate cut in May, a shift from its previous forecast of no rate cuts in the second quarter of 2025. This would be followed by three more cuts in the second half of the year, likely in August, November and December, bringing the total number of cuts in 2025 to five.
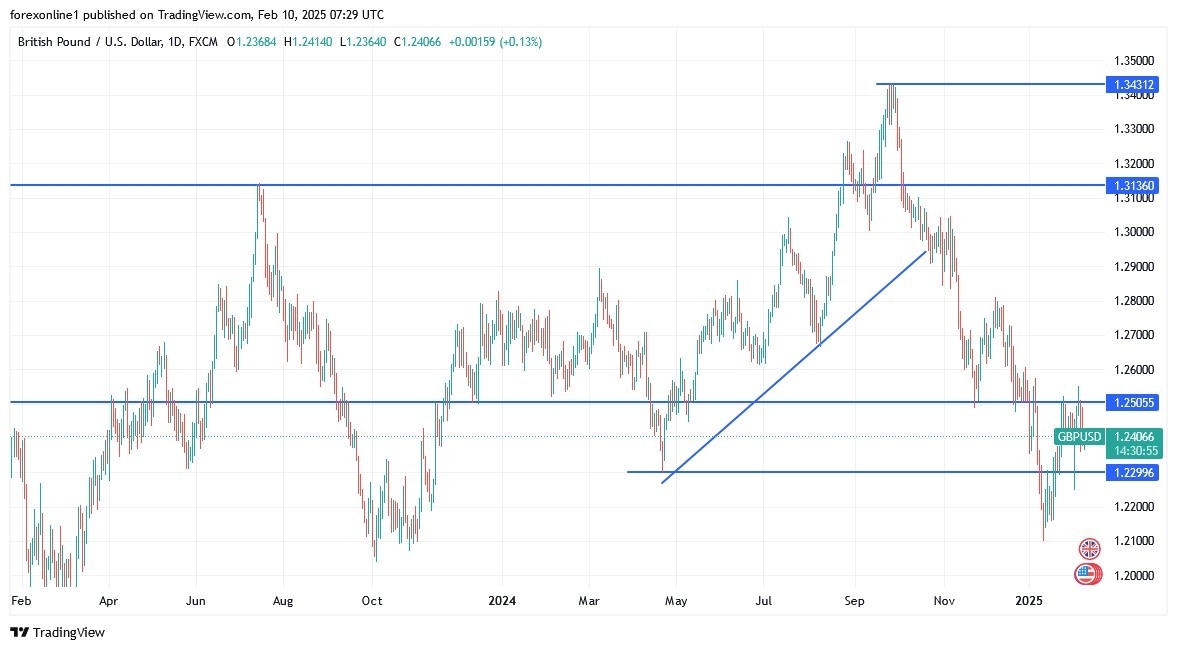
The performance on the daily chart above still strongly confirms the extent of bears’ control over the direction of the GBP/USD pair. The technical indicators, led by the RSI and MACD, are still down and have more room before moving towards strong oversold levels. Accordingly, the bears may have the opportunity to move towards the support levels of 1.2290 and 1.2170 respectively, and from the last level, the strongest move for the bears is the next psychological support 1.2000. On the other hand, and in the same time frame, there will be no break of the downtrend without first moving towards the resistance levels of 1.2600 and 1.2740 respectively.
The GBP/USD will remain under pressure until the reaction to the announcement of the US inflation figures and the testimony of the US Federal Reserve Governor Jerome Powell.
Ready to trade the Forex GBP/USD analysis and predictions? Here are the best forex trading platforms UK to choose from.





![Weekly forex forecast – EUR/USD, Oil, XAU/USD, XAG/USD [Video]](https://editorial.fxsstatic.com/images/i/Commodities_Oil-1_Large.jpg "Weekly forex forecast – EUR/USD, Oil, XAU/USD, XAG/USD [Video]")