The main category of Forex News.
You can use the search box below to find what you need.
[wd_asp id=1]
The main category of Forex News.
You can use the search box below to find what you need.
[wd_asp id=1]
Crude oil price shows sideways trades in the previous sessions, and fluctuates around 71.65$ now, waiting to get negative motive that assist to push the price to resume the expected bearish trend for the upcoming period, which gets continuous support by the EMA50.
For inquiries, Contact Us.
In a significant event last week, the Bank of England cut its forecast for UK economic growth this year by half and lowered its benchmark interest rate by 25 basis points to 4.5%, its lowest level since mid-2023.
Obviously, this decision was widely expected in financial markets. the bank now expects the UK economy to grow by just 0.75% this year, down from its previous forecast of 1.5% just three months ago. If this turns out to be remotely accurate, it would be deeply disappointing news for Britain’s new Labour government, which has made growth its top priority as it boosts living standards and generates funds for cash-strapped public services. With growth proving difficult to achieve, the party’s popularity has fallen sharply since its election victory in July.
Financial markets remain uncertain about how many more cuts will be made this year, with the Bank also forecasting higher-than-expected inflation over the next few months – it expects inflation to hit 3.7% sometime in the first half of the year, before drifting back towards its 2% target. Against this backdrop of growth and inflation, Bank Governor Andrew Bailey said the outlook for the UK economy remains uncertain, and uncertainty could increase if US President Donald Trump follows through on his tariff threats.

Keep in mind that sterling is a risk currency, and its gains will not improve without a return to confidence in the future of global growth and the performance of the new British government.
In this regard, according to Deutsche Bank. The Bank of England is likely to cut interest rates five times in 2025. For his part, according to Sanjay Raja, chief economist at Deutsche Bank, the Bank of England is ready to implement multiple rate cuts throughout 2025. In its latest research note, Deutsche Bank now expects five rate cuts this year, up from its previous forecast of four.
Last week, the Bank of England’s Monetary Policy Committee cut interest rates by 25 basis points to 4.5% as part of its easing cycle and lowered its economic growth forecasts while raising its inflation forecasts. Despite inflation expected to reach 3.7% this year, the analyst said, “the door remains wide open for further rate cuts” given the prevailing economic conditions and mixed inflation outlook. The minutes of the latest Monetary Policy Committee meeting revealed divisions within the committee, with seven members supporting a quarter-point cut and two members calling for a more aggressive 50 basis point cut.
Surprisingly, Catherine Mann joined Swati Dhingra in voting for a faster pace of rate cuts of 50 basis points. The analyst noted that “weaker activity and lower demand for labour are likely to reduce wage pressures as well as firms’ pricing power.”
Given the economic conditions, Deutsche Bank expects the Bank of England to deliver another rate cut in May, a shift from its previous forecast of no rate cuts in the second quarter of 2025. This would be followed by three more cuts in the second half of the year, likely in August, November and December, bringing the total number of cuts in 2025 to five.
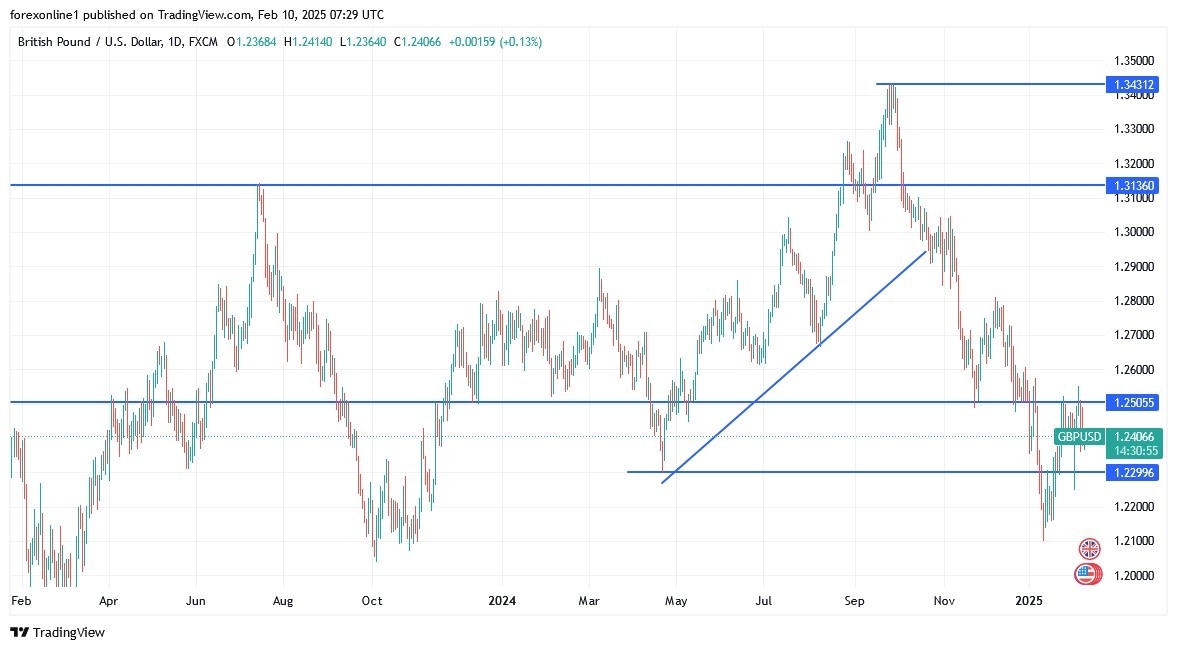
The performance on the daily chart above still strongly confirms the extent of bears’ control over the direction of the GBP/USD pair. The technical indicators, led by the RSI and MACD, are still down and have more room before moving towards strong oversold levels. Accordingly, the bears may have the opportunity to move towards the support levels of 1.2290 and 1.2170 respectively, and from the last level, the strongest move for the bears is the next psychological support 1.2000. On the other hand, and in the same time frame, there will be no break of the downtrend without first moving towards the resistance levels of 1.2600 and 1.2740 respectively.
The GBP/USD will remain under pressure until the reaction to the announcement of the US inflation figures and the testimony of the US Federal Reserve Governor Jerome Powell.
Ready to trade the Forex GBP/USD analysis and predictions? Here are the best forex trading platforms UK to choose from.
Gold price fluctuates around 2865.00$ level, waiting the release of the US payrolls and employment data that we will follow up via our Telegram channel and the effects of the markets, to keep the morning suggested positive scenario valid as it is as long as the price is above 2840.00$.
Are you looking for more exclusive insights and analysis? Join Economies.com VIP Club Channel on Telegram and get access to:
Subscribe now to our channel on Telegram and join the Economies VIP Club to get ahead in the market. Limited Spots Available.
For inquiries about how to register, contact us through this link.
Gold prices seem to have picked up fresh bids above $2,850 at the start of the US inflation week. However, as trade war fears mount, the further upside in Gold price could remain limited by renewed haven demand for the US Dollar (USD).
Risk aversion returned to the fore with trade war fears late Friday, reversing the US Nonfarm Payrolls (NFP) data-led USD decline. The Greenback got a fresh lift from resurgent haven buying, prompting Gold price to recede from a new all-time high of $2,887.
US President Donald Trump stated on Friday that he would unveil reciprocal tariffs on nations that impose taxes on US imports on Tuesday or Wednesday. Risk sentiment took a hit on Trump’s tariff threats and sent the US indices sharply lower even as dovish bets surrounding the Federal Reserve (Fed) easing outlook ramped up on weak January NFP data.
The NFP report showed that the US economy added 143,000 jobs in January after creating 307,000 jobs in December while missing the estimates of a 170,000 increase. The Unemployment Rate declined to 4% from 4.1%, while the Labor Force Participation Rate ticked a tad higher to 62.6% from 62.5%.
Escalating tensions over a potential global trade war, the 47th US President announced on Sunday that he would impose new 25% tariffs on all steel and aluminium imports, exacerbating the pain in the Euro and the commodity-linked Australian Dollar (AUD) and New Zealand Dollar (NZD), in turn infusing fresh buying interest in the go-to safety net – the US Dollar.
Mounting trade fears also remain supportive of the traditional store of value, Gold price. However, the Greenback’s strength continues as a headwind to the yellow metal’s upward trajectory. Gold price also capitalizes on the People’s Bank of China’s (PBOC) expansion of its Gold reserves for a third month in January.
“Bullion held by the People’s Bank of China rose by 0.16 million troy ounces last month,” Bloomberg cited the official data released on Friday.
Meanwhile, hopes of more stimulus coming through from China could also keep Gold buyers hopeful, especially after China’s Producer Price Index (PPI) deflation extended into a 28th month in January, with a 2.3% decline. The uptick in China’s Consumer Price Index (CPI) failed to impress markets.
In the day ahead, the USD could extend its recovery momentum if risk-off flows intensify or markets resort to profit-taking on their USD short positions heading into Wednesday’s US CPI inflation data release. In both cases, Gold price upside appears limited.
However, the downside in Gold price will likely be cushioned by dovish Fed expectations, China’s stimulus hopes and looming trade war risks.
Gold price confirmed a Bull Cross on the four-hour time frame after it closed above the falling trendline resistance at $2,862 in Friday’s Asian session.
Subsequently, Gold price went onto renew lifetime highs at $2,887 before paring back gains to settle near $2,860.
The bright metal defended the 21-four hourly Simple Moving Average (SMA), now at $2,864.
At the time of writing, Gold price bounces off the 21-day SMA, looking to find acceptance above the $2,880 level.
The next relevant target is aligned at the $2,900 round level, above which the $2,950 psychological level will be tested.
The Relative Strength Index (RSI) points north while above the midline, currently near 61, suggesting more potential for upside.
Alternatively, a sustained break below the 21-four hourly SMA at $2,864 could accelerate the downside toward the 50-four hourly SMA at $2,824.
The line in the sand for Gold buyers is seen at the $2,800 level.
Tariffs are customs duties levied on certain merchandise imports or a category of products. Tariffs are designed to help local producers and manufacturers be more competitive in the market by providing a price advantage over similar goods that can be imported. Tariffs are widely used as tools of protectionism, along with trade barriers and import quotas.
Although tariffs and taxes both generate government revenue to fund public goods and services, they have several distinctions. Tariffs are prepaid at the port of entry, while taxes are paid at the time of purchase. Taxes are imposed on individual taxpayers and businesses, while tariffs are paid by importers.
There are two schools of thought among economists regarding the usage of tariffs. While some argue that tariffs are necessary to protect domestic industries and address trade imbalances, others see them as a harmful tool that could potentially drive prices higher over the long term and lead to a damaging trade war by encouraging tit-for-tat tariffs.
During the run-up to the presidential election in November 2024, Donald Trump made it clear that he intends to use tariffs to support the US economy and American producers. In 2024, Mexico, China and Canada accounted for 42% of total US imports. In this period, Mexico stood out as the top exporter with $466.6 billion, according to the US Census Bureau. Hence, Trump wants to focus on these three nations when imposing tariffs. He also plans to use the revenue generated through tariffs to lower personal income taxes.
EUR/USD holds steady above 1.0300 after starting the week under modest bearish pressure. The near-term technical outlook suggests that buyers remain hesitant.
The table below shows the percentage change of Euro (EUR) against listed major currencies today. Euro was the weakest against the Australian Dollar.
| USD | EUR | GBP | JPY | CAD | AUD | NZD | CHF | |
|---|---|---|---|---|---|---|---|---|
| USD | 0.13% | -0.07% | 0.49% | 0.41% | -0.01% | 0.05% | 0.13% | |
| EUR | -0.13% | -0.14% | 0.49% | 0.40% | -0.15% | 0.00% | 0.07% | |
| GBP | 0.07% | 0.14% | 0.45% | 0.50% | -0.01% | 0.14% | 0.21% | |
| JPY | -0.49% | -0.49% | -0.45% | -0.11% | -0.43% | -0.43% | -0.35% | |
| CAD | -0.41% | -0.40% | -0.50% | 0.11% | -0.40% | -0.39% | -0.32% | |
| AUD | 0.01% | 0.15% | 0.01% | 0.43% | 0.40% | 0.16% | 0.22% | |
| NZD | -0.05% | -0.01% | -0.14% | 0.43% | 0.39% | -0.16% | 0.07% | |
| CHF | -0.13% | -0.07% | -0.21% | 0.35% | 0.32% | -0.22% | -0.07% |
The heat map shows percentage changes of major currencies against each other. The base currency is picked from the left column, while the quote currency is picked from the top row. For example, if you pick the Euro from the left column and move along the horizontal line to the US Dollar, the percentage change displayed in the box will represent EUR (base)/USD (quote).
January labor market data and US President Donald Trump’s comments on trade policy helped the US Dollar (USD) gather strength heading into the weekend, causing EUR/USD to push lower late Friday.
The Bureau of Labor Statistics (BLS) reported that Nonfarm Payrolls (NFP) rose by 143,000 in January, missing the market expectation for an increase of 170,000. On a positive note, November’s increase of 256,000 were revised higher to 307,000, while the Unemployment Rate edged lower to 4.1% from 4% in December. In the meantime, US President Donald Trump said that he will announce “reciprocal tariffs” on many countries this Tuesday or Wednesday. Additionally, Trump announced over the weekend that he plans to impose 25% tariffs on all steel and aluminum imports into the US.
French Foreign Minister Jean-Noel Barrot responded to Trump early Monday, noting that France and its European partners should not hesitate to defend their interests in the face of the US tariff threats.
The economic calendar will not feature any high-tier data releases on Monday. Later in the day, European Central Bank (ECB) President Christine Lagarde will brief the European Parliament on the state of European and global economic affairs and the ECB’s activities.
The uncertainty surrounding EU-US trade relations could make it difficult for the Euro to find demand in the near term.
The Relative Strength Index (RSI) indicator on the 4-hour chart stays below 40, highlighting the bearish stance. On the downside, 1.0290-1.0300 (Fibonacci 23.6% retracement of the latest downtrend, round level) aligns as first support area before 1.0250 (static level) and 1.0200 (round level, static level).
In case EUR/USD rises above 1.0350-1.0360 (Fibonacci 38.2% retracement, 200-period Simple Moving Average) and flips that area into support, technical buyers could take action. In this scenario, 1.0400 (Fibonacci 50% retracement) and 1.0440 (Fibonacci 61.8% retracement) could be seen as next resistance levels.
The Euro is the currency for the 19 European Union countries that belong to the Eurozone. It is the second most heavily traded currency in the world behind the US Dollar. In 2022, it accounted for 31% of all foreign exchange transactions, with an average daily turnover of over $2.2 trillion a day. EUR/USD is the most heavily traded currency pair in the world, accounting for an estimated 30% off all transactions, followed by EUR/JPY (4%), EUR/GBP (3%) and EUR/AUD (2%).
The European Central Bank (ECB) in Frankfurt, Germany, is the reserve bank for the Eurozone. The ECB sets interest rates and manages monetary policy. The ECB’s primary mandate is to maintain price stability, which means either controlling inflation or stimulating growth. Its primary tool is the raising or lowering of interest rates. Relatively high interest rates – or the expectation of higher rates – will usually benefit the Euro and vice versa. The ECB Governing Council makes monetary policy decisions at meetings held eight times a year. Decisions are made by heads of the Eurozone national banks and six permanent members, including the President of the ECB, Christine Lagarde.
Eurozone inflation data, measured by the Harmonized Index of Consumer Prices (HICP), is an important econometric for the Euro. If inflation rises more than expected, especially if above the ECB’s 2% target, it obliges the ECB to raise interest rates to bring it back under control. Relatively high interest rates compared to its counterparts will usually benefit the Euro, as it makes the region more attractive as a place for global investors to park their money.
Data releases gauge the health of the economy and can impact on the Euro. Indicators such as GDP, Manufacturing and Services PMIs, employment, and consumer sentiment surveys can all influence the direction of the single currency. A strong economy is good for the Euro. Not only does it attract more foreign investment but it may encourage the ECB to put up interest rates, which will directly strengthen the Euro. Otherwise, if economic data is weak, the Euro is likely to fall. Economic data for the four largest economies in the euro area (Germany, France, Italy and Spain) are especially significant, as they account for 75% of the Eurozone’s economy.
Another significant data release for the Euro is the Trade Balance. This indicator measures the difference between what a country earns from its exports and what it spends on imports over a given period. If a country produces highly sought after exports then its currency will gain in value purely from the extra demand created from foreign buyers seeking to purchase these goods. Therefore, a positive net Trade Balance strengthens a currency and vice versa for a negative balance.
The EURJPY pair continue to form negative trades by crawling below 157.25 recently, to notice surpassing the negative target at 156.20 and suffering additional losses by touching 155.60 this morning.
The correctional bullish rebound towards 156.65 won’t affect the main bearish track that depends on 160.25 level forming the major barrier, also, the major indicators continue to provide the negative momentum to force the price to form new negative waves and target 155.10 followed by reaching the historical support at 154.40.
The expected trading range for today is between 155.10 and 157.30
Trend forecast: Bearish
Copper price formed strong bullish rally after confirming breaching 4.3300$ barrier, surpassing the first main target at 4.5400$ to settle above 50% Fibonacci correction level.
Also, the major indicators provide the positive momentum to assist to renew the bullish attempts, to expect achieving additional gains by rallying towards 4.6800$ soon, followed by reaching 4.8100$ on the medium term basis.
The expected trading range for today is between 4.5000$ and 4.6800$
Trend forecast: Bullish
The EURJPY pair continue to form negative trades by crawling below 157.25 recently, to notice surpassing the negative target at 156.20 and suffering additional losses by touching 155.60 this morning.
The correctional bullish rebound towards 156.65 won’t affect the main bearish track that depends on 160.25 level forming the major barrier, also, the major indicators continue to provide the negative momentum to force the price to form new negative waves and target 155.10 followed by reaching the historical support at 154.40.
The expected trading range for today is between 155.10 and 157.30
Trend forecast: Bearish
The EURJPY pair continue to form negative trades by crawling below 157.25 recently, to notice surpassing the negative target at 156.20 and suffering additional losses by touching 155.60 this morning.
The correctional bullish rebound towards 156.65 won’t affect the main bearish track that depends on 160.25 level forming the major barrier, also, the major indicators continue to provide the negative momentum to force the price to form new negative waves and target 155.10 followed by reaching the historical support at 154.40.
The expected trading range for today is between 155.10 and 157.30
Trend forecast: Bearish
Silver price faced clear negative pressure in the previous sessions, as it reached the key support at 31.63$, which forms good barrier against the price, noticing that the EMA50 meets this level to add more strength to it, while stochastic shows clear positive signals now.
For inquiries, Contact Us.