The main category of Forex News.
You can use the search box below to find what you need.
[wd_asp id=1]
The main category of Forex News.
You can use the search box below to find what you need.
[wd_asp id=1]
The EURJPY pair resumed forming clear negative trades to notice crawling below the first negative target at 158.40, hinting its preparation to form new negative waves now.
The frequent stability below 160.25 barrier and getting negative momentum by the major indicators will increase the chances of targeting 157.35 support line soon, while breaking it will push the price to suffer new losses by crawling towards 156.20.
The expected trading range for today is between 157.35 and 159.20
Trend forecast: Bearish
Brent oil price broke 75.66$ level clearly and closed the daily candlestick below it, to complete forming the head and shoulders’ pattern and get negative motive that supports the continuation of the expected bearish trend on the intraday and short-term basis, and we believe that the way is open to achieve our next target at 74.00$.
Therefore, we will continue to suggest the bearish trend for the upcoming period, taking into consideration that breaching 75.66$ followed by 76.00$ levels will stop the current negative pressure and push the price to achieve some gains before determining the next destination clearly.
Are you looking for more exclusive insights? Join Economies.com VIP Club Channel on Telegram and get access to:
Subscribe now to our channel on Telegram and join the Economies VIP Club to get ahead in the market. Limited Spots Available.
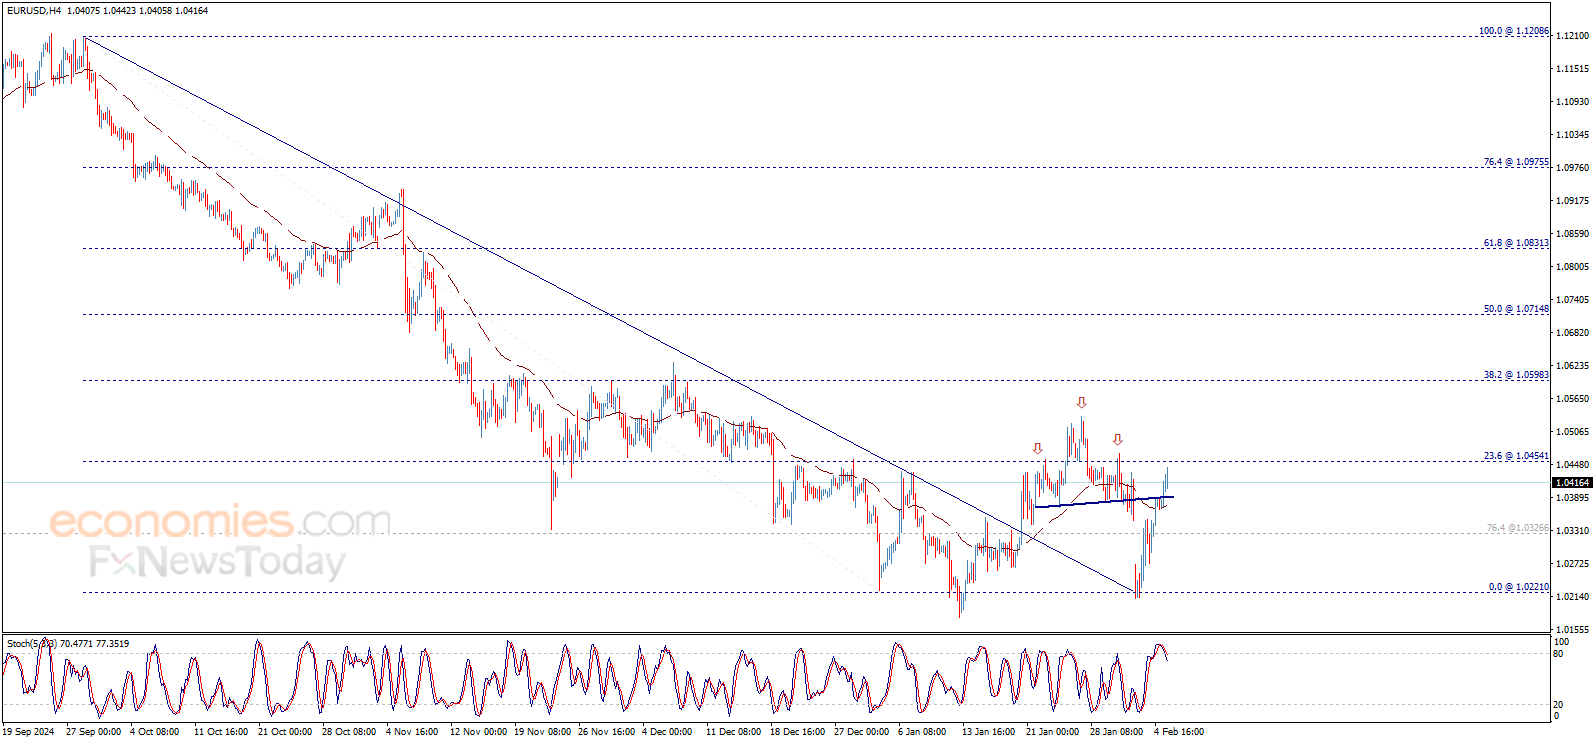
The EURUSD price rebounds bearishly after reaching few pips away from our waited target at 1.0455$, to approach retesting the breached resistance that turns into minor support now at 1.0380$, noticing that stochastic begins to get rid of its negative momentum gradually, waiting to motivate the price to resume the positive trades in the upcoming sessions.
Therefore, we are waiting for new bullish bias today, and the price needs to breach 1.0455$ to open the way to achieve additional bullish correction that its next target reaches 1.0600$, noting that breaking 1.0380$ followed by 1.0325$ levels will stop the expected rise and push the price to decline again.
Are you looking for more exclusive insights? Join Economies.com VIP Club Channel on Telegram and get access to:
Subscribe now to our channel on Telegram and join the Economies VIP Club to get ahead in the market. Limited Spots Available.
Ethereum price (ETHUSD) finds difficulty to hold above 2764.75$, to move below it now, noticing that stochastic gathers the positive momentum to support the chances to rise in the upcoming sessions and surpass the mentioned level again.
Therefore, we expect to witness positive trades today, and the price needs to breach 2764.75$ resistance to confirm heading towards 3017.30$ that represents our next main target, taking into consideration that failing to breach the mentioned resistance will put the price under additional negative pressure that its targets begin by testing 2480.00$ areas.
The expected trading range for today is between 2580.00$ support and 2890.00$ resistance.
Trend forecast: Bullish
Spot Gold’s rally to record highs continued on Wednesday, with XAU/USD trading as high as $2,882.34 during American trading hours. As it has been happening these days, demand for safety prevails amid mounting concerns related to United States (US) President Donald Trump’s tariffs. At the same time, the US Dollar (USD) has lost its attractiveness, with stock markets recovering and investors digesting the latest US data.
The latest US macroeconomic figures showed a solid labor market and softer-than-anticipated economic progress. On the one hand, the ADP Employment Change report showed that the private sector added 183,000 new jobs in January, better than the 150,000 anticipated by market players and above the 122,000 gained in December.
On the other hand, the January ISM Services Purchasing Managers’ Index (PMI) rose by 52.8, below the 54 posted in December and the expected 54.3. Other details of the report showed that the Prices Paid Index, the inflation component, dropped to 60.4 from 64.4, while the Employment Index edged higher to 52.3 from 51.3.
Meanwhile, Wall Street struggles to extend its recent recovery. Most Asian and European indexes closed in the green, but among US indexes, only the Dow Jones Industrial Average (DJIA) is up.
From a technical point of view, the daily chart for XAU/USD shows that the bullish momentum prevails despite overbought conditions, as technical indicators keep aiming north despite developing at extreme levels. At the same time, the pair advanced further above bullish moving averages, with the 20 Simple Moving Average (SMA) heading sharply higher at around $2,750.
In the near term, and according to the 4-hour chart, the risk skews to the upside. Technical indicators have resumed their advances within overbought levels and after a limited retracement, suggesting buyers are still willing to add on dips. Finally, XAU/USD develops far above all bullish moving averages, with the shorter 20 SMA at around $2,825.
Support levels: 2,857.80 2,845.30 2,829.10
Resistance levels: 2,883.00 2,900.00 2,915.00
Tariffs are customs duties levied on certain merchandise imports or a category of products. Tariffs are designed to help local producers and manufacturers be more competitive in the market by providing a price advantage over similar goods that can be imported. Tariffs are widely used as tools of protectionism, along with trade barriers and import quotas.
Although tariffs and taxes both generate government revenue to fund public goods and services, they have several distinctions. Tariffs are prepaid at the port of entry, while taxes are paid at the time of purchase. Taxes are imposed on individual taxpayers and businesses, while tariffs are paid by importers.
There are two schools of thought among economists regarding the usage of tariffs. While some argue that tariffs are necessary to protect domestic industries and address trade imbalances, others see them as a harmful tool that could potentially drive prices higher over the long term and lead to a damaging trade war by encouraging tit-for-tat tariffs.
During the run-up to the presidential election in November 2024, Donald Trump made it clear that he intends to use tariffs to support the US economy and American producers. In 2024, Mexico, China and Canada accounted for 42% of total US imports. In this period, Mexico stood out as the top exporter with $466.6 billion, according to the US Census Bureau. Hence, Trump wants to focus on these three nations when imposing tariffs. He also plans to use the revenue generated through tariffs to lower personal income taxes.
Short-term resistance is at today’s high of $3.37 and support was at the low of the day, at $3.16. Despite the minor bullish indication from today’s price action, further consolidation within the day’s range is also possible. If the low of the day is broken to the downside, there is the possibility of a gap filling at $3.12. A rising trendline can also be watched for signs of support if recent lows are retested.
It is interesting to note that this week’s low, that was hit today, successfully found support around the 20-Week MA (not shown), which is $3.15. Notably, natural gas fell below the 20-Week MA last week and closed below it on a weekly basis. That was bearish price behavior. But the reclaim of the 20-Week line this week countered with bullish indications.
Therefore, support around $3.15 needs to continue to hold to confirm the bullish posture. Staying above the 20-Week line will provide another piece of bullish evidence, increasing the chance for a continuation of the bounce from last week’s low of $2.99. Regardless, natural gas is likely to complete this week as an inside week given last week’s wide trading range from $2.99 to $3.83.
A decisive breakout above Wednesday’s high of $3.37 points to higher targets for natural gas. The 50-Day MA at $3.52 is the next upside target where resistance may be seen. It is confirmed by the 38.2% Fibonacci retracement at $3.51. Since the 50-Day line had been dynamic support for the rising trend previously, until last Tuesday, there is a strong chance it will be tested as resistance at a minimum.
For a look at all of today’s economic events, check out our economic calendar.
WLD currency price (WLDUSD) fell in the intraday levels, amid the dominance of the main downward trend in the medium term, while trading alongside the secondary short-term trend line, with negative pressure due to trading below the 50-day SMA, as the price readies to pierce the pivotal support of$1.28587183 with negative signals from the RSI despite reaching oversold levels.
Therefore we expect more losses for the price, provided the aforementioned support of $1.28587183 was reliably breached, thus targeting the support of $0.49942978.
Trend forecast for today: Bearish
Affirm Holdings’ stock price (AFRM) slid in the intraday levels, amid negative pressure from trading below the 50-day SMA, with negative signals from the RSI after reaching overbought levels, as the stock tries to shake off these negative pressures, amid the dominance of the main upward trend, while trading alongside the secondary short-term trend line.
Therefore we expect the stock to return higher, targeting the pivotal resistance of $72.82, provided the support of $52.48 holds on.
Trend forecast for today: Likely Bullish
Important DisclaimersThe content provided on the website includes general news and publications, our personal analysis and opinions, and contents provided by third parties, which are intended for educational and research purposes only. It does not constitute, and should not be read as, any recommendation or advice to take any action whatsoever, including to make any investment or buy any product. When making any financial decision, you should perform your own due diligence checks, apply your own discretion and consult your competent advisors. The content of the website is not personally directed to you, and we does not take into account your financial situation or needs.The information contained in this website is not necessarily provided in real-time nor is it necessarily accurate. Prices provided herein may be provided by market makers and not by exchanges.Any trading or other financial decision you make shall be at your full responsibility, and you must not rely on any information provided through the website. FX Empire does not provide any warranty regarding any of the information contained in the website, and shall bear no responsibility for any trading losses you might incur as a result of using any information contained in the website.The website may include advertisements and other promotional contents, and FX Empire may receive compensation from third parties in connection with the content. FX Empire does not endorse any third party or recommends using any third party’s services, and does not assume responsibility for your use of any such third party’s website or services.FX Empire and its employees, officers, subsidiaries and associates, are not liable nor shall they be held liable for any loss or damage resulting from your use of the website or reliance on the information provided on this website.Risk DisclaimersThis website includes information about cryptocurrencies, contracts for difference (CFDs) and other financial instruments, and about brokers, exchanges and other entities trading in such instruments. Both cryptocurrencies and CFDs are complex instruments and come with a high risk of losing money. You should carefully consider whether you understand how these instruments work and whether you can afford to take the high risk of losing your money.FX Empire encourages you to perform your own research before making any investment decision, and to avoid investing in any financial instrument which you do not fully understand how it works and what are the risks involved.