The main category of Forex News.
You can use the search box below to find what you need.
[wd_asp id=1]
The main category of Forex News.
You can use the search box below to find what you need.
[wd_asp id=1]
The GBP/JPY cross trades in a negative territory around 190.25 during the early European trading hours on Thursday. The growing speculation that the Bank of Japan (BoJ) would keep raising interest rates provides some support to the Japanese Yen (JPY) and creates a headwind for the cross.
Technically, the bearish outlook of GBP/JPY remains in play as the major pair remains capped below the key 100-period Exponential Moving Average (EMA) on the 4-hour chart. Furthermore, the downward momentum is supported by the Relative Strength Index (RSI), which is located below the midline around 37.00, suggesting that the path of least resistance is to the downside.
The first downside target for the cross emerges at the 190.00 psychological mark. Extended losses could see a drop to the lower limit of the Bollinger Band at 189.70. A decisive break below the mentioned level could pave the way to 189.34, the low of January 17.
On the bright side, the 100-period EMA at 192.40 acts as an immediate resistance level for the cross. Sustained trading above this level could attract some buyers to 193.54, the upper boundary of the Bollinger Band. Further north, the next hurdle is seen at 194.71, the high of January 27.
The Japanese Yen (JPY) is one of the world’s most traded currencies. Its value is broadly determined by the performance of the Japanese economy, but more specifically by the Bank of Japan’s policy, the differential between Japanese and US bond yields, or risk sentiment among traders, among other factors.
One of the Bank of Japan’s mandates is currency control, so its moves are key for the Yen. The BoJ has directly intervened in currency markets sometimes, generally to lower the value of the Yen, although it refrains from doing it often due to political concerns of its main trading partners. The BoJ ultra-loose monetary policy between 2013 and 2024 caused the Yen to depreciate against its main currency peers due to an increasing policy divergence between the Bank of Japan and other main central banks. More recently, the gradually unwinding of this ultra-loose policy has given some support to the Yen.
Over the last decade, the BoJ’s stance of sticking to ultra-loose monetary policy has led to a widening policy divergence with other central banks, particularly with the US Federal Reserve. This supported a widening of the differential between the 10-year US and Japanese bonds, which favored the US Dollar against the Japanese Yen. The BoJ decision in 2024 to gradually abandon the ultra-loose policy, coupled with interest-rate cuts in other major central banks, is narrowing this differential.
The Japanese Yen is often seen as a safe-haven investment. This means that in times of market stress, investors are more likely to put their money in the Japanese currency due to its supposed reliability and stability. Turbulent times are likely to strengthen the Yen’s value against other currencies seen as more risky to invest in.
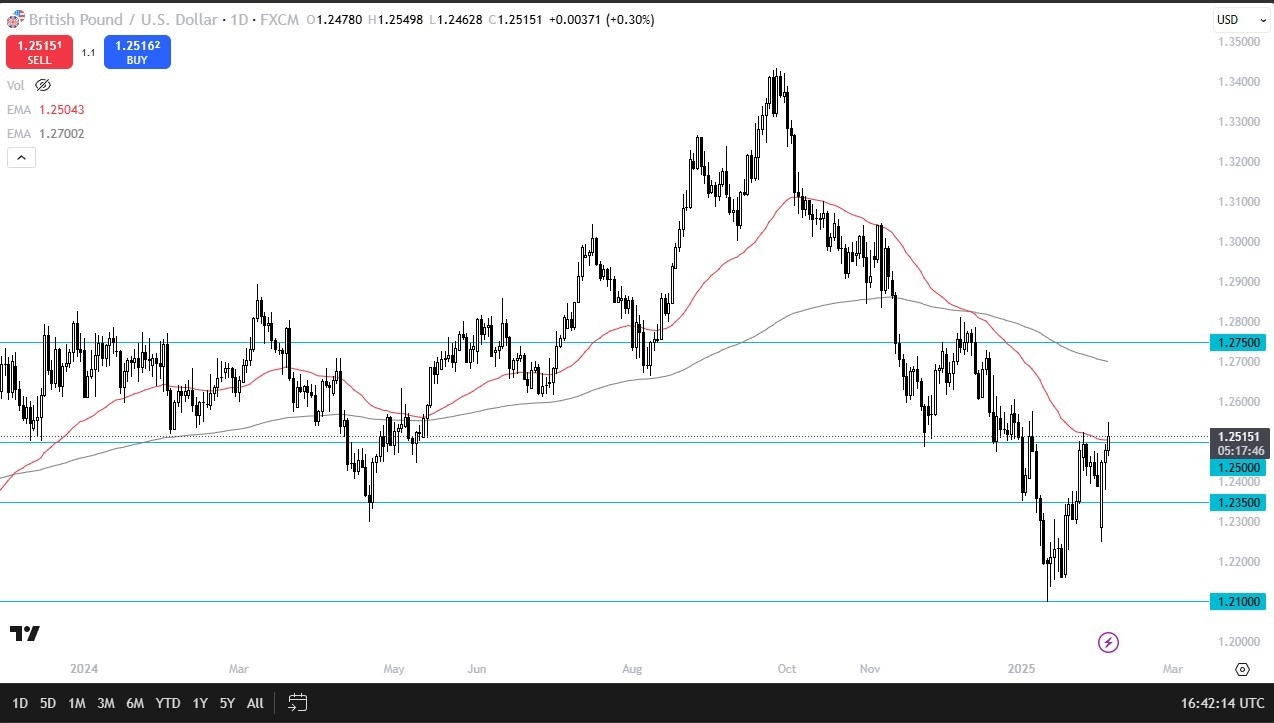
This is the type of trade that I absolutely hate being involved in, and therefore I won’t be. However, once we see the true reaction to how the Bank of England statement comes out, meaning that once there’s been a few hours gone by, then you can start to talk about how the market might react for a bigger move. At this point, it’s clear that the market has been in a downtrend for a while, so there’s no reason to think that suddenly we are at the end of the downtrend for longer-term move.

At this point in time, the Thursday session is going to be crucial for the British pound part of the equation, but we also have the Nonfarm Payroll announcement on Friday that will give us an idea as to what the Federal Reserve might be looking at. It is because of this that I would expect the British pound to be very volatile over the next 2 days, at least against the US dollar. However, if we do see the British pound really start to take off here, the trade in the short term might be something along the lines of GBP/CHF, avoiding the US dollar altogether. It’ll be interesting to see how that plays out, but right now I think we are at a crucial inflection point.
The trade is simple. Let’s see how the Friday session closes, and that could tell us what happens for the next 300 pips, maybe more than that. Jumping into this trade right now is a very dangerous thing to do as liquidity will disappear, and you are trying to guess what the attitude of traders around the world will be due to the interest rate decision and more importantly, the press conference/statement coming out of London, and then how they will react to the jobs number. It’s not a market to be gambling in right now.
Ready to trade the Forex GBP/USD analysis and predictions? Here are the best forex trading platforms UK to choose from.
Silver price (XAG/USD) rises for the third successive session, trading around $32.30 per troy ounce, during the European hours on Wednesday. The safe-haven metals like Silver gain ground due to increased risk aversion following global trade and economic uncertainties.
In response to the new 10% US tariff that took effect on Tuesday, China imposed a 15% tariff on US coal and liquefied natural gas (LNG) imports, along with an additional 10% tariff on crude oil, farm equipment, and certain automobiles.
However, traders remain hopeful for a potential resolution between the United States (US) and China, similar to the agreements reached with Mexico and Canada. US President Donald Trump stated on Monday that he expects to speak with China soon but warned, “If we can’t reach a deal with China, the tariffs will be very, very substantial.” However, no further developments have been reported.
Trump, earlier this week, announced a temporary suspension of tariffs on Mexico and Canada after their leaders agreed to deploy 10,000 troops to the US border to combat drug trafficking. The tariffs initially imposed two days earlier—25% on Mexican and Canadian goods have been postponed for at least 30 days.
The dollar-denominated Silver attracts buyers as the US Dollar (USD) goes through a technical downward correction. The US Dollar Index (DXY), which measures the US Dollar’s value against six major currencies, remains under downward pressure for the third successive day, trading around 107.70 at the time of writing. Meanwhile, traders brace for Friday’s US Nonfarm Payrolls (NFP) data, which is expected to shape the Federal Reserve’s (Fed) monetary policy direction.
Silver, which does not yield interest, is benefiting from the dovish stance of major central banks. The Bank of Canada (BoC) has halted its quantitative tightening and joined Sweden’s Riksbank in cutting interest rates. Last week, the European Central Bank (ECB) lowered its Deposit Facility Rate by 25 basis points (bps) to 2.75%, while both the Reserve Bank of India (RBI) and the People’s Bank of China (PBoC) have signaled potential rate cuts ahead. Additionally, markets expect the US Federal Reserve (Fed) to implement two rate cuts this year.
Silver is a precious metal highly traded among investors. It has been historically used as a store of value and a medium of exchange. Although less popular than Gold, traders may turn to Silver to diversify their investment portfolio, for its intrinsic value or as a potential hedge during high-inflation periods. Investors can buy physical Silver, in coins or in bars, or trade it through vehicles such as Exchange Traded Funds, which track its price on international markets.
Silver prices can move due to a wide range of factors. Geopolitical instability or fears of a deep recession can make Silver price escalate due to its safe-haven status, although to a lesser extent than Gold’s. As a yieldless asset, Silver tends to rise with lower interest rates. Its moves also depend on how the US Dollar (USD) behaves as the asset is priced in dollars (XAG/USD). A strong Dollar tends to keep the price of Silver at bay, whereas a weaker Dollar is likely to propel prices up. Other factors such as investment demand, mining supply – Silver is much more abundant than Gold – and recycling rates can also affect prices.
Silver is widely used in industry, particularly in sectors such as electronics or solar energy, as it has one of the highest electric conductivity of all metals – more than Copper and Gold. A surge in demand can increase prices, while a decline tends to lower them. Dynamics in the US, Chinese and Indian economies can also contribute to price swings: for the US and particularly China, their big industrial sectors use Silver in various processes; in India, consumers’ demand for the precious metal for jewellery also plays a key role in setting prices.
Silver prices tend to follow Gold’s moves. When Gold prices rise, Silver typically follows suit, as their status as safe-haven assets is similar. The Gold/Silver ratio, which shows the number of ounces of Silver needed to equal the value of one ounce of Gold, may help to determine the relative valuation between both metals. Some investors may consider a high ratio as an indicator that Silver is undervalued, or Gold is overvalued. On the contrary, a low ratio might suggest that Gold is undervalued relative to Silver.
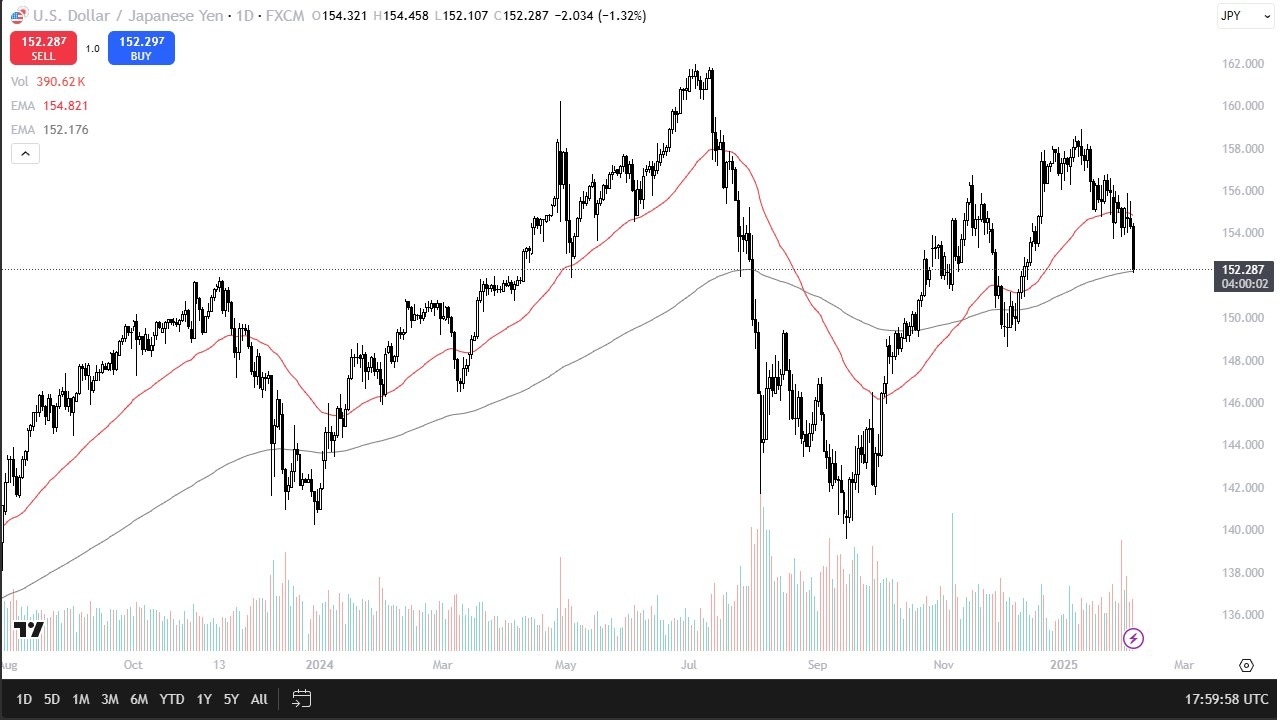
So, I’m not really wanting to short the dollar against the yen. I’m more or less waiting to see how it behaves in this general vicinity. What’s of particular interest to me is that we are right at the 200 day EMA and we did stop. So, it’ll be interesting to see if it holds.
Furthermore, you have to keep in mind that Friday is non-farm payroll Friday, so you have to be a little cautious there as well. Now, having said that, we have to start to ask the question, is the trend changing? We don’t know yet. We are getting there though. We are certainly getting to that point. So, I think this is a pair that is going to be more or less short-term driven and determined, but we will have to watch the 10-year yield in JGBs in Japan and the 10 year yield in America to give us a bit of an idea as to how this may play out.
Interest rate differential is particularly interesting in Japanese yen related pairs as it is part of the carry trade. So, I always keep an eye on that. Nonetheless, the 200 day EMA could offer a bit of technical support. And then of course, Friday is a massive wild card with the employment numbers giving us an idea as to where we may go in the longer term. During the day, there was someone from the Federal Reserve talking about the possibility of an interest rate cut between now and the end of the year, which is still very possible. But these are the same people that at one point were screaming about transitory inflation. They’re almost always wrong. So, at this point in time, it’s a wait and see. But I do think this is a very important level to watch.
Want to trade our USD/JPY forex analysis and predictions? Here’s a list of forex brokers in Japan to check out.
The NZDUSD price provides more positive trades after surpassing the EMA50, waiting to test 0.5738$ as a next main target, which represents 23.6% Fibonacci correction level for the entire decline from 0.6377$ to 0.5540$, which means that breaching it will extend the bullish wave to reach 0.5860$ as a next positive station.
Are you looking for more exclusive insights? Join Economies.com VIP Club Channel on Telegram and get access to:
Subscribe now to our channel on Telegram and join the Economies VIP Club to get ahead in the market. Limited Spots Available.
EUR/USD stays under bearish pressure on Thursday and trades below 1.0400, after closing the previous two days in positive territory. The pair’s technical outlook highlights buyers’ hesitancy as market attention shifts to macroeconomic data releases from the US.
The table below shows the percentage change of Euro (EUR) against listed major currencies today. Euro was the weakest against the Japanese Yen.
| USD | EUR | GBP | JPY | CAD | AUD | NZD | CHF | |
|---|---|---|---|---|---|---|---|---|
| USD | 0.41% | 0.57% | 0.00% | 0.33% | 0.41% | 0.57% | 0.42% | |
| EUR | -0.41% | 0.16% | -0.41% | -0.08% | 0.00% | 0.17% | -0.01% | |
| GBP | -0.57% | -0.16% | -0.61% | -0.24% | -0.15% | 0.01% | -0.15% | |
| JPY | 0.00% | 0.41% | 0.61% | 0.33% | 0.41% | 0.54% | 0.42% | |
| CAD | -0.33% | 0.08% | 0.24% | -0.33% | 0.09% | 0.24% | 0.10% | |
| AUD | -0.41% | -0.01% | 0.15% | -0.41% | -0.09% | 0.16% | -0.01% | |
| NZD | -0.57% | -0.17% | -0.01% | -0.54% | -0.24% | -0.16% | -0.15% | |
| CHF | -0.42% | 0.00% | 0.15% | -0.42% | -0.10% | 0.01% | 0.15% |
The heat map shows percentage changes of major currencies against each other. The base currency is picked from the left column, while the quote currency is picked from the top row. For example, if you pick the Euro from the left column and move along the horizontal line to the US Dollar, the percentage change displayed in the box will represent EUR (base)/USD (quote).
The improving risk mood made it difficult for the US Dollar (USD) to find demand on Wednesday and helped EUR/USD edge higher. In the meantime, the data from the US showed that the ISM Services PMI declined to 52.8 in January from 54 in December, not allowing the USD to stay resilient against its rivals.
In the second half of the day, weekly Initial Jobless Claims and fourth-quarter Unit Labor Costs data from the US will be watched closely by market participants.
Investors expect the number of first-time applications for unemployment benefits to rise to 213,000 in the week ending February 1. A reading at or below 200,000 could boost the USD and weigh on EUR/USD, while a print above 230,000 could have the opposite effect on the currency’s action.
On a quarterly basis, Unit Labor Costs are forecast to rise 3.8% in Q4, following the 0.8% increase recorded in the previous quarter. A softer-than-forecast print could limit the USD’s gains, even if the Initial Jobless Claims data seem supportive at the first glance. Nevertheless, market reaction to these data could remain short-lived, with investors refraining from taking large positions ahead of Friday’s Nonfarm Payrolls data.
The Relative Strength Index (RSI) indicator on the 4-hour chart retreated below 50, reflecting a loss of bullish momentum. The pair was last seen trading near the 1.0350-1.0360 area, where the 200-period Simple Moving Average (SMA) meets the Fibonacci 38.2% retracement of the latest downtrend. If EUR/USD drops below this area, technical sellers could take action. In this scenario, 1.0290-1.0300 (Fibonacci 23.6% retracement, round level) could be seen as next support before 1.0250 (static level).
On the upside, 1.0400 (Fibonacci 50% retracement) aligns as immediate resistance before 1.0440 (Fibonacci 61.8% retracement) and 1.0500 (static level, round level).
The Euro is the currency for the 19 European Union countries that belong to the Eurozone. It is the second most heavily traded currency in the world behind the US Dollar. In 2022, it accounted for 31% of all foreign exchange transactions, with an average daily turnover of over $2.2 trillion a day. EUR/USD is the most heavily traded currency pair in the world, accounting for an estimated 30% off all transactions, followed by EUR/JPY (4%), EUR/GBP (3%) and EUR/AUD (2%).
The European Central Bank (ECB) in Frankfurt, Germany, is the reserve bank for the Eurozone. The ECB sets interest rates and manages monetary policy. The ECB’s primary mandate is to maintain price stability, which means either controlling inflation or stimulating growth. Its primary tool is the raising or lowering of interest rates. Relatively high interest rates – or the expectation of higher rates – will usually benefit the Euro and vice versa. The ECB Governing Council makes monetary policy decisions at meetings held eight times a year. Decisions are made by heads of the Eurozone national banks and six permanent members, including the President of the ECB, Christine Lagarde.
Eurozone inflation data, measured by the Harmonized Index of Consumer Prices (HICP), is an important econometric for the Euro. If inflation rises more than expected, especially if above the ECB’s 2% target, it obliges the ECB to raise interest rates to bring it back under control. Relatively high interest rates compared to its counterparts will usually benefit the Euro, as it makes the region more attractive as a place for global investors to park their money.
Data releases gauge the health of the economy and can impact on the Euro. Indicators such as GDP, Manufacturing and Services PMIs, employment, and consumer sentiment surveys can all influence the direction of the single currency. A strong economy is good for the Euro. Not only does it attract more foreign investment but it may encourage the ECB to put up interest rates, which will directly strengthen the Euro. Otherwise, if economic data is weak, the Euro is likely to fall. Economic data for the four largest economies in the euro area (Germany, France, Italy and Spain) are especially significant, as they account for 75% of the Eurozone’s economy.
Another significant data release for the Euro is the Trade Balance. This indicator measures the difference between what a country earns from its exports and what it spends on imports over a given period. If a country produces highly sought after exports then its currency will gain in value purely from the extra demand created from foreign buyers seeking to purchase these goods. Therefore, a positive net Trade Balance strengthens a currency and vice versa for a negative balance.
Gold price extends its winning streak into a sixth straight day on Thursday, consolidating near record highs of $2,882 set on Wednesday.
Sustained US Dollar (USD) weakness alongside the extended correction in the US Treasury bond yields continue to bode well for the non-yielding Gold price. The Greenback bears the brunt of receding fears of a potential global trade war after US President Donald Trump’s pushback on Canada and Mexico for a month while markets look past the US-Sino tariff war, expecting no further escalation.
Additionally, Trump’s plans to end the Israel-Hamas geopolitical conflict also provided a ray of hope to markets, diminishing the USD’s safe-haven appeal. Israeli Prime Minister Benjamin Netanyahu and Trump met on Tuesday at the White House and discussed the elimination of Hamas, Iran strategy and renewed Israel-Saudi normalization.
Furthermore, expectations of policy divergence between the US Federal Reserve (Fed) and the Bank of Japan (BoJ) drive the Japanese Yen to near two-month highs against the US Dollar, dragging USD/JPY sharply lower. The USD/JPY weakness remains a drag on the Greenback, allowing Gold price to maintain its buoyant tone.
According to the LSEG data, a quarter-point Fed cut is fully priced for July, with markets expecting 46.3 percentage points of cuts by the December meeting. Meanwhile, markets have priced in around 94.8% odds for a quarter-point hike by September.
With trade tensions in the back seat for now, attention turns to Friday’s critical US Nonfarm Payrolls (NFP) data, which could offer cues on the Fed’s next policy move. The NFP data could emerge as the main market driver for Gold price heading into next week’s US Consumer Price Index (CPI) release.
In the meantime, the US weekly Jobless Claims and Preliminary Unit Labor Cost will be eyed alongside the Fedspeak for some trading incentives in Gold price. Any fresh developments surrounding Trump’s tariff plans will likely temper the Gold price rally, reviving the haven demand for the USD.
The daily chart continues to caution Gold buyers as the 14-day Relative Strength Index (RSI) remains in an extremely overbought zone, currently near 76.50.
That said, Gold price risks a pullback on a sustained move below the $2.850 level.
If the selling pressure intensifies, Gold price could challenge the $2,800 round level, below which the February 3 low of $2,772 will be tested.
However, the 50-day Simple Moving Average (SMA) and 100-day SMA Bull Cross keep hopes alive for buyers, while Gold price also managed to close Wednesday above the $2,850 psychological barrier.
Gold buyers must take out the record highs of $2,882 for further upside. The next relevant target is aligned at the $3,000 round level.
Gold has played a key role in human’s history as it has been widely used as a store of value and medium of exchange. Currently, apart from its shine and usage for jewelry, the precious metal is widely seen as a safe-haven asset, meaning that it is considered a good investment during turbulent times. Gold is also widely seen as a hedge against inflation and against depreciating currencies as it doesn’t rely on any specific issuer or government.
Central banks are the biggest Gold holders. In their aim to support their currencies in turbulent times, central banks tend to diversify their reserves and buy Gold to improve the perceived strength of the economy and the currency. High Gold reserves can be a source of trust for a country’s solvency. Central banks added 1,136 tonnes of Gold worth around $70 billion to their reserves in 2022, according to data from the World Gold Council. This is the highest yearly purchase since records began. Central banks from emerging economies such as China, India and Turkey are quickly increasing their Gold reserves.
Gold has an inverse correlation with the US Dollar and US Treasuries, which are both major reserve and safe-haven assets. When the Dollar depreciates, Gold tends to rise, enabling investors and central banks to diversify their assets in turbulent times. Gold is also inversely correlated with risk assets. A rally in the stock market tends to weaken Gold price, while sell-offs in riskier markets tend to favor the precious metal.
The price can move due to a wide range of factors. Geopolitical instability or fears of a deep recession can quickly make Gold price escalate due to its safe-haven status. As a yield-less asset, Gold tends to rise with lower interest rates, while higher cost of money usually weighs down on the yellow metal. Still, most moves depend on how the US Dollar (USD) behaves as the asset is priced in dollars (XAU/USD). A strong Dollar tends to keep the price of Gold controlled, whereas a weaker Dollar is likely to push Gold prices up.
The GBP/JPY cross trades in a negative territory around 190.25 during the early European trading hours on Thursday. The growing speculation that the Bank of Japan (BoJ) would keep raising interest rates provides some support to the Japanese Yen (JPY) and creates a headwind for the cross.
Technically, the bearish outlook of GBP/JPY remains in play as the major pair remains capped below the key 100-period Exponential Moving Average (EMA) on the 4-hour chart. Furthermore, the downward momentum is supported by the Relative Strength Index (RSI), which is located below the midline around 37.00, suggesting that the path of least resistance is to the downside.
The first downside target for the cross emerges at the 190.00 psychological mark. Extended losses could see a drop to the lower limit of the Bollinger Band at 189.70. A decisive break below the mentioned level could pave the way to 189.34, the low of January 17.
On the bright side, the 100-period EMA at 192.40 acts as an immediate resistance level for the cross. Sustained trading above this level could attract some buyers to 193.54, the upper boundary of the Bollinger Band. Further north, the next hurdle is seen at 194.71, the high of January 27.
The Japanese Yen (JPY) is one of the world’s most traded currencies. Its value is broadly determined by the performance of the Japanese economy, but more specifically by the Bank of Japan’s policy, the differential between Japanese and US bond yields, or risk sentiment among traders, among other factors.
One of the Bank of Japan’s mandates is currency control, so its moves are key for the Yen. The BoJ has directly intervened in currency markets sometimes, generally to lower the value of the Yen, although it refrains from doing it often due to political concerns of its main trading partners. The BoJ ultra-loose monetary policy between 2013 and 2024 caused the Yen to depreciate against its main currency peers due to an increasing policy divergence between the Bank of Japan and other main central banks. More recently, the gradually unwinding of this ultra-loose policy has given some support to the Yen.
Over the last decade, the BoJ’s stance of sticking to ultra-loose monetary policy has led to a widening policy divergence with other central banks, particularly with the US Federal Reserve. This supported a widening of the differential between the 10-year US and Japanese bonds, which favored the US Dollar against the Japanese Yen. The BoJ decision in 2024 to gradually abandon the ultra-loose policy, coupled with interest-rate cuts in other major central banks, is narrowing this differential.
The Japanese Yen is often seen as a safe-haven investment. This means that in times of market stress, investors are more likely to put their money in the Japanese currency due to its supposed reliability and stability. Turbulent times are likely to strengthen the Yen’s value against other currencies seen as more risky to invest in.
Ethereum price (ETHUSD) got positive close above 2764.75$, noticing that the recent trades are confined within bullish pennant pattern that appears on the chart, which means that breaching 2825.00$ will activate the positive effect of this pattern and push the price to achieve our first waited target at 3017.30$.
Therefore, we will continue to suggest the bullish trend for the upcoming period, noting that breaking 2764.75$ followed by 2715.00$ levels will stop the bullish wave and push the price to turn to decline.
Are you looking for more exclusive insights? Join Economies.com VIP Club Channel on Telegram and get access to:
Subscribe now to our channel on Telegram and join the Economies VIP Club to get ahead in the market. Limited Spots Available.
The EURJPY pair resumed forming clear negative trades to notice crawling below the first negative target at 158.40, hinting its preparation to form new negative waves now.
The frequent stability below 160.25 barrier and getting negative momentum by the major indicators will increase the chances of targeting 157.35 support line soon, while breaking it will push the price to suffer new losses by crawling towards 156.20.
The expected trading range for today is between 157.35 and 159.20
Trend forecast: Bearish