The main category of Forex News.
You can use the search box below to find what you need.
[wd_asp id=1]
The main category of Forex News.
You can use the search box below to find what you need.
[wd_asp id=1]
The EURGBP price formed some correctional negative waves recently, achieving the target mentioned in our previous report by reaching 0.8355 to test the major support line that appears on the chart.
Now, stochastic exit from the oversold areas will motivate the price to form bullish waves to expect targeting 0.8400 followed by 0.8435 levels soon, while breaking the current support will confirm postponing the positivity to force the price to suffer additional losses by crawling towards 0.8345 before any attempt to achieve the previously mentioned gains.
The expected trading range for today is between 0.8350 and 0.8400
Trend forecast: Bullish
Gold price settles above 2790.00$ level, to keep the bullish trend scenario active for today, reminding you that our next station is located at 2808.20$, which breaching it represents the key to head towards 2850.00$ as a next main target.
The EMA50 supports the suggested bullish wave, which will remain valid unless breaking 2790.00$ and holding below it.
The expected trading range for today is between 2780.00$ support and 2820.00$ resistance.
Trend forecast: Bullish
The GBPJPY pair faced strong negative pressures yesterday to notice crawling below 191.90 level and suffering some losses by touching 191.15 level, while the current positive rebound won’t allow the price to regain the bullish track due to the MA55 consolidation near 50% Fibonacci correction level at 194.10, to confirm confining trades within the negative track for the near-term trades.
Also, stochastic crawl below 50 level will increase the negative pressures to expect suffering additional losses by crawling towards 190.60 followed by reaching the next support at 189.50.
The expected trading range for today is between 190.60 and 192.60
Trend forecast: Bearish
The GBPJPY pair faced strong negative pressures yesterday to notice crawling below 191.90 level and suffering some losses by touching 191.15 level, while the current positive rebound won’t allow the price to regain the bullish track due to the MA55 consolidation near 50% Fibonacci correction level at 194.10, to confirm confining trades within the negative track for the near-term trades.
Also, stochastic crawl below 50 level will increase the negative pressures to expect suffering additional losses by crawling towards 190.60 followed by reaching the next support at 189.50.
The expected trading range for today is between 190.60 and 192.60
Trend forecast: Bearish
The EURGBP price formed some correctional negative waves recently, achieving the target mentioned in our previous report by reaching 0.8355 to test the major support line that appears on the chart.
Now, stochastic exit from the oversold areas will motivate the price to form bullish waves to expect targeting 0.8400 followed by 0.8435 levels soon, while breaking the current support will confirm postponing the positivity to force the price to suffer additional losses by crawling towards 0.8345 before any attempt to achieve the previously mentioned gains.
The expected trading range for today is between 0.8350 and 0.8400
Trend forecast: Bullish
Silver price (XAG/USD) recovers a majority of intraday losses and rebounds to near $30.50 in Friday’s European session. The white metal bounces back strongly as its outlook remains firm amid fears that United States (US) President Donald Trump will impose 25% tariffs on Canada and Mexico on Saturday for allowing illegal immigrants and the deadly opioid fentanyl enter into the economy. Such a scenario could lead to a trade war, which heightens geopolitical uncertainty, which is favorable for precious metals, like Silver.
Donald Trump has also threatened to implement 100% tariffs on the BRICS for attempting to create a new currency to diminish their reliance on the US Dollar. On his social media platform, Truth Social, on Thursday, Trump said, “There is no chance that the BRICS will replace the U.S. Dollar in International Trade or anywhere else, and any Country that tries should say hello to Tariffs and goodbye to America.”
Meanwhile, the US Dollar’s (USD) appeal has also increased on Trump’s tariff threats but is trading subduedly in European trading hours ahead of the US Personal Consumption Expenditure Price Index (PCE) data for December, which will be published at 13:30 GMT. Economists estimate the core PCE inflation to have risen by 0.2% against 0.1% growth seen in November on month-on-month, with annual figures growing steadily by 2.8%.
Signs of persistent inflationary pressures would boost market expectations that the Federal Reserve (Fed) will keep interest rates at their current levels for a lengthy period. On Wednesday, the Fed left its key borrowing rates steady at 4.25%- 4.50% and guided that the central bank will remain in the waiting mode until it sees real progress in inflation or some weakness in the labor market.
Silver price strengthens on a decisive break above the upward-sloping trendline around $30.85, which is plotted from the 29 February 2024 low of $22.30 on a daily timeframe. The near-term outlook of the white metal remains firm as it holds the 20-day Exponential Moving Average (EMA), which trades around $30.57.
The 14-day Relative Strength Index (RSI) climbs above 60.00. A fresh bullish momentum would trigger if the RSI manages to hold above 60.00.
Looking down, the January 27 low of $29.70 will act as a key support zone for the Silver price. On the upside, the December 12 high of $32.33 will act as key resistance.
Silver is a precious metal highly traded among investors. It has been historically used as a store of value and a medium of exchange. Although less popular than Gold, traders may turn to Silver to diversify their investment portfolio, for its intrinsic value or as a potential hedge during high-inflation periods. Investors can buy physical Silver, in coins or in bars, or trade it through vehicles such as Exchange Traded Funds, which track its price on international markets.
Silver prices can move due to a wide range of factors. Geopolitical instability or fears of a deep recession can make Silver price escalate due to its safe-haven status, although to a lesser extent than Gold’s. As a yieldless asset, Silver tends to rise with lower interest rates. Its moves also depend on how the US Dollar (USD) behaves as the asset is priced in dollars (XAG/USD). A strong Dollar tends to keep the price of Silver at bay, whereas a weaker Dollar is likely to propel prices up. Other factors such as investment demand, mining supply – Silver is much more abundant than Gold – and recycling rates can also affect prices.
Silver is widely used in industry, particularly in sectors such as electronics or solar energy, as it has one of the highest electric conductivity of all metals – more than Copper and Gold. A surge in demand can increase prices, while a decline tends to lower them. Dynamics in the US, Chinese and Indian economies can also contribute to price swings: for the US and particularly China, their big industrial sectors use Silver in various processes; in India, consumers’ demand for the precious metal for jewellery also plays a key role in setting prices.
Silver prices tend to follow Gold’s moves. When Gold prices rise, Silver typically follows suit, as their status as safe-haven assets is similar. The Gold/Silver ratio, which shows the number of ounces of Silver needed to equal the value of one ounce of Gold, may help to determine the relative valuation between both metals. Some investors may consider a high ratio as an indicator that Silver is undervalued, or Gold is overvalued. On the contrary, a low ratio might suggest that Gold is undervalued relative to Silver.
GBP/USD struggles to hold its ground and retreats toward 1.2400 after closing in negative territory on Thursday. The pair’s technical outlook suggests that sellers could look to retain control in the near term.
The table below shows the percentage change of British Pound (GBP) against listed major currencies this week. British Pound was the weakest against the Japanese Yen.
| USD | EUR | GBP | JPY | CAD | AUD | NZD | CHF | |
|---|---|---|---|---|---|---|---|---|
| USD | 1.20% | 0.60% | -0.71% | 0.85% | 1.48% | 0.99% | 0.67% | |
| EUR | -1.20% | -0.52% | -1.76% | -0.22% | 0.28% | -0.09% | -0.43% | |
| GBP | -0.60% | 0.52% | -1.53% | 0.32% | 0.81% | 0.45% | 0.10% | |
| JPY | 0.71% | 1.76% | 1.53% | 1.62% | 2.39% | 1.95% | 1.53% | |
| CAD | -0.85% | 0.22% | -0.32% | -1.62% | 0.42% | 0.13% | -0.22% | |
| AUD | -1.48% | -0.28% | -0.81% | -2.39% | -0.42% | -0.33% | -0.66% | |
| NZD | -0.99% | 0.09% | -0.45% | -1.95% | -0.13% | 0.33% | -0.57% | |
| CHF | -0.67% | 0.43% | -0.10% | -1.53% | 0.22% | 0.66% | 0.57% |
The heat map shows percentage changes of major currencies against each other. The base currency is picked from the left column, while the quote currency is picked from the top row. For example, if you pick the British Pound from the left column and move along the horizontal line to the US Dollar, the percentage change displayed in the box will represent GBP (base)/USD (quote).
The US Dollar (USD) struggled to gather following mixed macroeconomic data releases on Thursday. Later in the American session, however, the cautious market stance didn’t allow GBP/USD to edge higher.
The US Bureau of Economic Analysis (BEA) reported on Thursday that the US’ Gross Domestic Product grew at an annual rate of 2.3% in the fourth quarter, below the 3.1% expansion recorded in the third quarter and the market estimate of 2.6%. Other data from the US showed that weekly Initial Jobless Claims in the US declined to 207,000 in the week ending January 25 from 223,000 in the previous week.
Meanwhile, US President Donald Trump reiterated late Thursday that the US is set to impose a flat 25% import tax “because of fentanyl” on all goods crossing the border into the US from Canada or Mexico.
In the second half of the day, the BEA will publish Personal Consumption Expenditures (PCE) Price Index data for December. On a monthly basis, the core PCE Price Index is expected to rise 0.2%. A reading of 0.3%, or higher, could lift the USD and force GBP/USD to push lower heading into the weekend.
GBP/USD stays below the 200-period SMA and the Fibonacci 50% retracement of the latest downtrend, currently located in the 1.2440-1.2420 area, and the Relative Strength Index (RSI) indicator on the four-hour chart drops toward 40, reflecting a buildup of bearish momentum.
On the downside, 1.2400 (static level, round level) could be seen as immediate support before 1.2370 (Fibonacci 38.2% retracement) and 1.2315 (100-period SMA). Looking north, resistances align at 1.2420-1.2440, 1.2500 (round level, static level) and 1.2530 (Fibonacci 61.8% retracement).
The Pound Sterling (GBP) is the oldest currency in the world (886 AD) and the official currency of the United Kingdom. It is the fourth most traded unit for foreign exchange (FX) in the world, accounting for 12% of all transactions, averaging $630 billion a day, according to 2022 data. Its key trading pairs are GBP/USD, also known as ‘Cable’, which accounts for 11% of FX, GBP/JPY, or the ‘Dragon’ as it is known by traders (3%), and EUR/GBP (2%). The Pound Sterling is issued by the Bank of England (BoE).
The single most important factor influencing the value of the Pound Sterling is monetary policy decided by the Bank of England. The BoE bases its decisions on whether it has achieved its primary goal of “price stability” – a steady inflation rate of around 2%. Its primary tool for achieving this is the adjustment of interest rates. When inflation is too high, the BoE will try to rein it in by raising interest rates, making it more expensive for people and businesses to access credit. This is generally positive for GBP, as higher interest rates make the UK a more attractive place for global investors to park their money. When inflation falls too low it is a sign economic growth is slowing. In this scenario, the BoE will consider lowering interest rates to cheapen credit so businesses will borrow more to invest in growth-generating projects.
Data releases gauge the health of the economy and can impact the value of the Pound Sterling. Indicators such as GDP, Manufacturing and Services PMIs, and employment can all influence the direction of the GBP. A strong economy is good for Sterling. Not only does it attract more foreign investment but it may encourage the BoE to put up interest rates, which will directly strengthen GBP. Otherwise, if economic data is weak, the Pound Sterling is likely to fall.
Another significant data release for the Pound Sterling is the Trade Balance. This indicator measures the difference between what a country earns from its exports and what it spends on imports over a given period. If a country produces highly sought-after exports, its currency will benefit purely from the extra demand created from foreign buyers seeking to purchase these goods. Therefore, a positive net Trade Balance strengthens a currency and vice versa for a negative balance.
Crude oil price closed yesterday above 73.90$ level, to attempt to build bullish wave on the intraday basis and head towards achieving expected gains in the upcoming sessions, targeting testing 75.52$ mainly.
Therefore, the bullish bias will be suggested for today, noting that breaking 73.90$ and holding below it will push the price to resume the correctional bearish track and head towards 72.30$ as a next negative station.
The expected trading range for today is between 72.80$ support and 75.80$ resistance
Trend forecast: Bullish
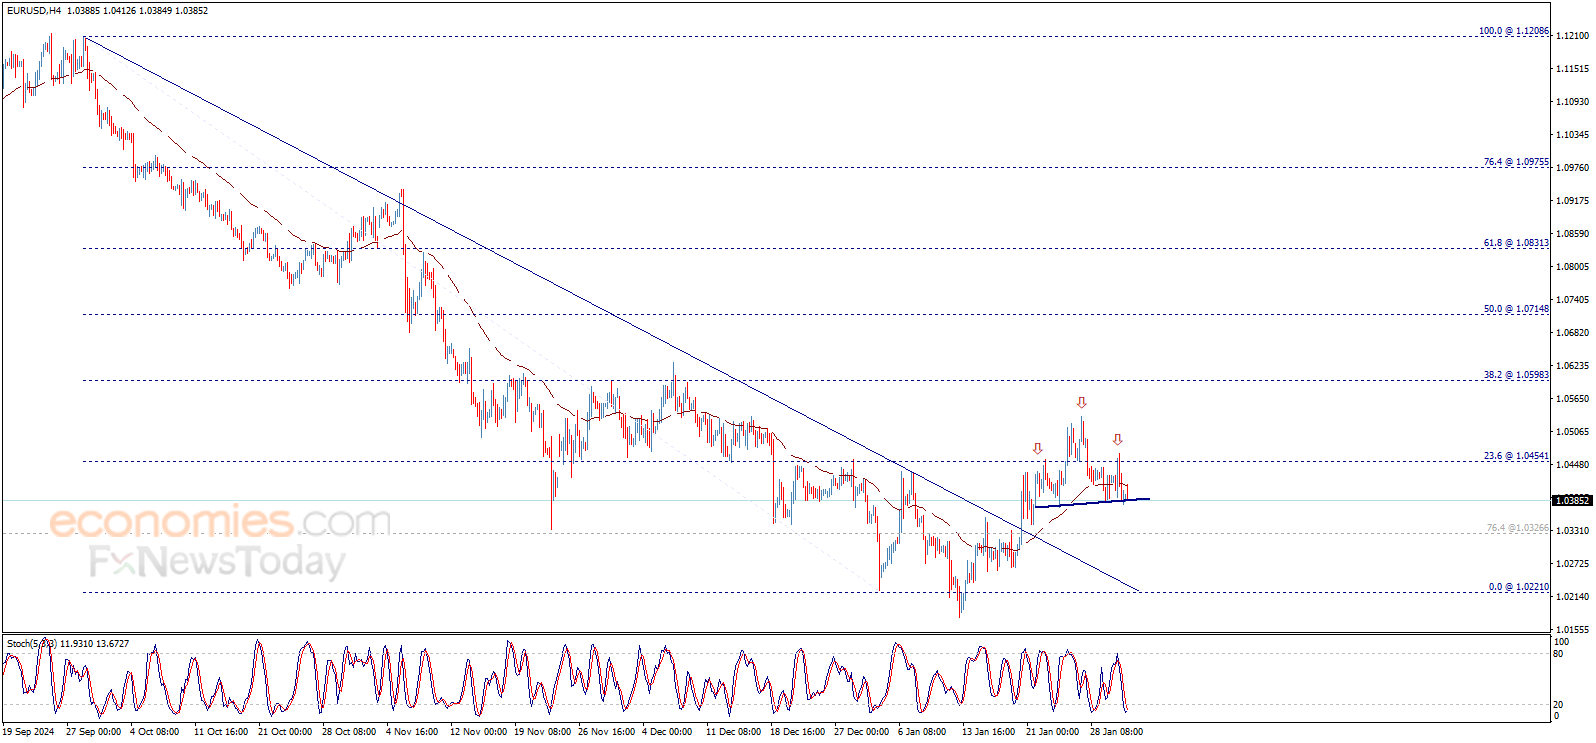
The EURUSD price trades negatively since yesterday, and by taking a deeper look at the chart, we find that the price formed head and shoulders’ pattern that its confirmation line located at the current areas around 1.0385$, thus, breaking this level will push the price to continue the decline and achieve our negative targets that start at 1.0325$ and extend to 1.0220$ after breaking the previous level.
Therefore, we will continue to suggest the bearish trend for the upcoming period, taking into consideration that breaching 1.0455$ will stop the expected decline and lead the price to achieve bullish correction on the intraday and short-term basis.
The expected trading range for today is between 1.0300$ support and 1.0455$ resistance
Trend forecast: Bearish
Gold price is battling $2,800, sitting at its highest level on record early Friday. Renewed US Dollar selling and US President Donald Trump’s tariff threats help keep Gold price afloat ahead of the US core Personal Consumption Expenditures (PCE) Price Index release.
President Trump’s latest tariff warnings keep investors on the edge, fuelling fresh demand for traditional safe havens such as the Japanese Yen, Gold and US government bonds. In his latest post on X, the 47th US President reiterated his threat of imposing 100% tariffs on BRICS nations if they try to replace the US Dollar with a new currency in international trade.
Earlier in Thursday’s American trading, Trump noted that the US is set to impose a flat 25% import tax on February 1 “because of fentanyl” on all goods crossing the border into the US from Canada or Mexico while adding that “we’re in the process of doing a China tariff.”
Resurgent demand for the traditional store of value keeps the record-setting rally in Gold price alive and kicking as the US Dollar (USD) struggles amid the ongoing pressure on the USD/JPY pair. The Japanese Yen capitalizes on risk-off flows and hot Tokyo Consumer Price Index (CPI) inflation data, which bolstered further Bank of Japan (BoJ) interest rate hike bets.
Traders now look to the US core PCE Price Index data, the Federal Reserve’s (Fed) preferred inflation measure, for fresh insights on the central bank’s next policy move, especially after the American economy showed a bigger-than-expected slowdown in the final quarter of 2024.
US Gross Domestic Product (GDP) rose at an annualized pace of 2.3% in the fourth quarter, the Commerce Department said, falling short of the 2.6% increase expected after reporting a growth of 3.1% in the third quarter.
The US Dollar tracked the US Treasury bond yields lower on disappointing US growth figures as the data revived dovish Fed expectations. However, Trump’s tariff threats lent some support to the Greenback in late American trading. However, that failed to deter Gold buyers as a flight to safety theme remained in vogue.
With tariffs likely to be announced over the weekend on Canada, Mexico and China, Gold price will remain the go-to asset due to its status as a safe-haven and an inflation hedge. Trump’s trade policies are prerceived as inflationary.
Gold price technical analysis: Daily chart
Gold price stands tall near fresh record highs after closing Thursday well beyond the symmetrical triangle target of $2,785 or the previous all-time high of $2,790.
The 14-day Relative Strength Index (RSI) is currently near 68, suggesting that there is more room to the upside before Gold price enters the overbought territory at 70.
Adding credence to the bullish potential, the 50-day Simple Moving Average (SMA) and 100-day SMA Bull Cross confirmed last week remains in play.
Gold price needs a sustained move above the $2,800 level to target next topside barrier at $2,850.
On the downside, the immediate support will be seen at the previous day’s low of $2,754.
Sellers will then aim for this week’s low of $2,731, folowed by the 21-day SMA at $2,714.
Generally speaking, a trade war is an economic conflict between two or more countries due to extreme protectionism on one end. It implies the creation of trade barriers, such as tariffs, which result in counter-barriers, escalating import costs, and hence the cost of living.
An economic conflict between the United States (US) and China began early in 2018, when President Donald Trump set trade barriers on China, claiming unfair commercial practices and intellectual property theft from the Asian giant. China took retaliatory action, imposing tariffs on multiple US goods, such as automobiles and soybeans. Tensions escalated until the two countries signed the US-China Phase One trade deal in January 2020. The agreement required structural reforms and other changes to China’s economic and trade regime and pretended to restore stability and trust between the two nations. However, the Coronavirus pandemic took the focus out of the conflict. Yet, it is worth mentioning that President Joe Biden, who took office after Trump, kept tariffs in place and even added some additional levies.
The return of Donald Trump to the White House as the 47th US President has sparked a fresh wave of tensions between the two countries. During the 2024 election campaign, Trump pledged to impose 60% tariffs on China once he returned to office, which he did on January 20, 2025. With Trump back, the US-China trade war is meant to resume where it was left, with tit-for-tat policies affecting the global economic landscape amid disruptions in global supply chains, resulting in a reduction in spending, particularly investment, and directly feeding into the Consumer Price Index inflation.