The main category of Forex News.
You can use the search box below to find what you need.
[wd_asp id=1]
The main category of Forex News.
You can use the search box below to find what you need.
[wd_asp id=1]
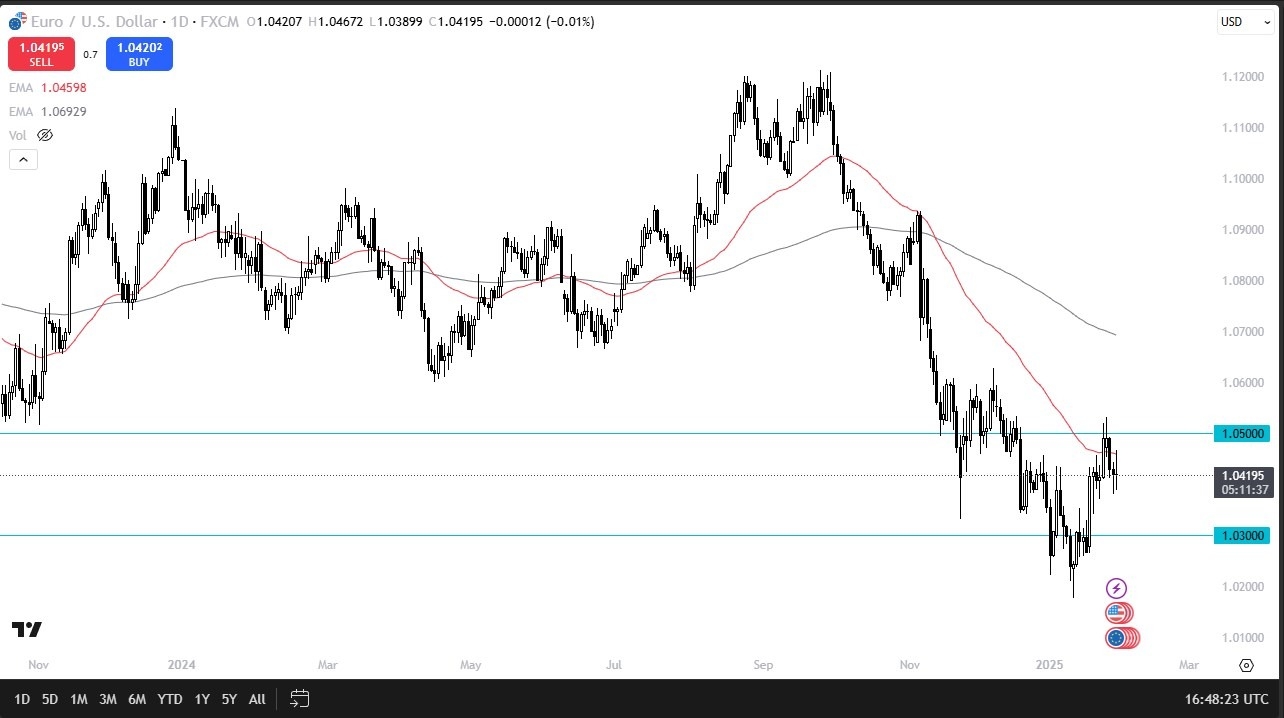
One thing is for sure, the Jerome Powell press conference the previous day did not help this situation. So, I think we’re settling into a trading range in between the 1.05 level and the 1.03 level below. All things being equal, this is a market that I prefer to be short of instead of long, but I also recognize that it’s not always going to be moving. And right now, it’s just not moving. It’s a lot of back and forth Brownian motion.

I like the idea of fading a short-term rally anywhere near the 1.05 level that shows signs of exhaustion and that resistance extends all the way to the 1.06 level. If we were to break down below the 1.03 level, then it opens up the possibility of 1.02 and then maybe even lower than that down to the parity level, which I do think we get to sooner or later, because despite the fact that the Fed really didn’t do much, there is a very real world in which the Federal Reserve does not cut interest rates at all in 2025. At this point in time, I think it’s going to come down to European data, but for what it’s worth, the advanced GDP numbers in the United States came in cooler than anticipated. So that’s part of the confusion as well.
Ready to trade our EUR/USD daily forecast? Here’s a list of some of the top forex brokers in Europe to check out.
A support zone is indicated around the 61.8% retracement level as a prior interim swing high was at 3.02 and an internal uptrend line is close by. However, if that price zone fails to show support, the next lower level to consider is around a trendline at approximately 2.82. That line is the top boundary line of a large symmetrical triangle pattern. Further down is a potentially more significant support zone identified by both the 200-Day MA at 2.68 and the 78.6% retracement at 2.67. When two or more indicators point to a similar price area, it is one way that the market provides clues.
Although the 200-Day line was successfully tested as support initially following a reclaim of the line on September 11, the current retracement is at a larger scale of the trend structure. Nonetheless, it would be expected to hold as support if tested given its long-term significance as a trend indicator. It is also interesting to note that the triangle apex crosses right at the 78.6% retracement level.
One way to identify a possibly failure of a bull breakout from a symmetrical triangle is the center line of the pattern (where boundary lines cross). The idea being that if the bulls remained in charge overall following a bull breakout of the pattern, the price would not be able to fall back below the midpoint, as it shows relative weakness that is getting worse.
As noted previously, with one trading day remaining till the end of January, the developing monthly candlestick pattern (not shown) is likely to end in a bearish position. Today’s decline dropped the low for the month of January to 3.04, which increasing the chance that natural gas will end the month in a very bearish position on the monthly chart.
For a look at all of today’s economic events, check out our economic calendar.
The EURJPY pair surrendered to the stability of 164.80 barrier to notice forming correctional bearish waves to settle near 162.20, testing the minor bullish channel’s support line that appears on the chart.
Note that crawling below the MA55 and stochastic continuous negative momentum might force the price to break the current support and suffer additional losses by crawling towards 161.60 and 161.00 levels, while holding above the support will reinforce the chances of forming bullish waves, to wait to rally above 163.30 to confirm its preparation to activate the bullish track again.
The expected trading range for today is between 161.60 and 163.00
Trend forecast: Bearish
Coffee price continued to form bullish waves recently, taking advantage of its consolidation within the bullish channel and 347.10 level forming new support line, to notice achieving the first main target at 367.80.
We expect the domination of the sideways bias to provide mixed waves until breaching 367.80 to open the way to record new historical gains that might extend towards 376.00 followed by reaching the bullish channel’s support line at 383.20.
The expected trading range for today is between 355.00 and 376.00
Trend forecast: Bullish
GBP/USD struggles to find direction and fluctuates in a tight band at around 1.2450 after closing virtually unchanged on Wednesday. The Federal Reserve’s (Fed) monetary policy announcements fail to influence the US Dollar’s (USD) valuation in a noticeable way as market focus shifts to US growth data.
The table below shows the percentage change of British Pound (GBP) against listed major currencies this week. British Pound was the strongest against the Australian Dollar.
| USD | EUR | GBP | JPY | CAD | AUD | NZD | CHF | |
|---|---|---|---|---|---|---|---|---|
| USD | 0.87% | 0.32% | -0.79% | 0.30% | 1.35% | 0.98% | 0.26% | |
| EUR | -0.87% | -0.47% | -1.49% | -0.42% | 0.49% | 0.24% | -0.50% | |
| GBP | -0.32% | 0.47% | -1.33% | 0.06% | 0.96% | 0.73% | -0.06% | |
| JPY | 0.79% | 1.49% | 1.33% | 1.15% | 2.34% | 2.03% | 1.17% | |
| CAD | -0.30% | 0.42% | -0.06% | -1.15% | 0.85% | 0.67% | -0.11% | |
| AUD | -1.35% | -0.49% | -0.96% | -2.34% | -0.85% | -0.21% | -0.95% | |
| NZD | -0.98% | -0.24% | -0.73% | -2.03% | -0.67% | 0.21% | -0.99% | |
| CHF | -0.26% | 0.50% | 0.06% | -1.17% | 0.11% | 0.95% | 0.99% |
The heat map shows percentage changes of major currencies against each other. The base currency is picked from the left column, while the quote currency is picked from the top row. For example, if you pick the British Pound from the left column and move along the horizontal line to the US Dollar, the percentage change displayed in the box will represent GBP (base)/USD (quote).
The Fed said late Wednesday that it left the policy rate unchanged at 4.25%-4.5%. In the policy statement, the Fed removed the language suggesting inflation had “made progress” toward its 2% target and said the pace of price increases “remains elevated” instead.
In the post-meeting press conference, Fed Chairman Jerome Powell acknowledged that there was elevated uncertainty because of significant policy shifts. “We don’t need to be in a hurry to make any adjustments,” he repeated. Although the USD edged higher with the immediate reaction, it struggled to preserve its strength as the Fed event offered little to nothing new on the rate outlook.
On Thursday, the US Bureau of Economic Analysis (BEA) will release its first estimate of the fourth-quarter Gross Domestic Product (GDP) data. Investors expect the US economy to grow at an annualized rate of 2.6% following the 3.1% growth recorded in the third quarter. A weaker-than-forecast print could weigh on the USD and help GBP/USD gain traction. On the flip side, a GDP print at or above the market consensus could force GBP/USD to stay on the back foot.
The Relative Strength Index (RSI) indicator on the 4-hour chart holds slightly above 50 but moves sideways, suggesting that the bullish bias remains intact, while lacking momentum.
GBP/USD was last seen trading at around 1.2450, where the Fibonacci 50% retracement level of the latest downtrend and the 200-period Simple Moving Average (SMA) align. In case GBP/USD confirms 1.2450 as resistance, 1.2400 (static level, round level) could be seen as next support before 1.2370 (Fibonacci 38.2% retracement) and 1.2310 (100-period SMA). Looking north, resistances could be spotted at 1.2500 (round level, static level) and 1.2530 (Fibonacci 61.8% retracement).
The Pound Sterling (GBP) is the oldest currency in the world (886 AD) and the official currency of the United Kingdom. It is the fourth most traded unit for foreign exchange (FX) in the world, accounting for 12% of all transactions, averaging $630 billion a day, according to 2022 data. Its key trading pairs are GBP/USD, also known as ‘Cable’, which accounts for 11% of FX, GBP/JPY, or the ‘Dragon’ as it is known by traders (3%), and EUR/GBP (2%). The Pound Sterling is issued by the Bank of England (BoE).
The single most important factor influencing the value of the Pound Sterling is monetary policy decided by the Bank of England. The BoE bases its decisions on whether it has achieved its primary goal of “price stability” – a steady inflation rate of around 2%. Its primary tool for achieving this is the adjustment of interest rates. When inflation is too high, the BoE will try to rein it in by raising interest rates, making it more expensive for people and businesses to access credit. This is generally positive for GBP, as higher interest rates make the UK a more attractive place for global investors to park their money. When inflation falls too low it is a sign economic growth is slowing. In this scenario, the BoE will consider lowering interest rates to cheapen credit so businesses will borrow more to invest in growth-generating projects.
Data releases gauge the health of the economy and can impact the value of the Pound Sterling. Indicators such as GDP, Manufacturing and Services PMIs, and employment can all influence the direction of the GBP. A strong economy is good for Sterling. Not only does it attract more foreign investment but it may encourage the BoE to put up interest rates, which will directly strengthen GBP. Otherwise, if economic data is weak, the Pound Sterling is likely to fall.
Another significant data release for the Pound Sterling is the Trade Balance. This indicator measures the difference between what a country earns from its exports and what it spends on imports over a given period. If a country produces highly sought-after exports, its currency will benefit purely from the extra demand created from foreign buyers seeking to purchase these goods. Therefore, a positive net Trade Balance strengthens a currency and vice versa for a negative balance.
Spot Gold reached a fresh all-time high following the second round of first-tier events, trading as high as $2,798.53 after Wall Street’s opening. The US Dollar (USD) came under selling pressure after the release of tepid growth-related figures.
According to the United States (US) Bureau of Economic Analysis (BEA), the economy grew at an annualized rate of 2.3% in the fourth quarter of 2024, declining from the 3.1% posted in Q3 and missing expectations of 2.6%. The Gross Domestic Product (GDP) report also showed that the GDP Price Index rose by 2.2%, below the expected 2.5%.
Additionally, the core Personal Consumption Expenditures (PCE) Price Index increased by 2.5% on a quarterly basis, matching the market consensus. Finally, the US reported that Initial Jobless Claims for the week ended January 24 improved to 207K from the previous 223K.
Wall Street struggled to digest the news after the Federal Reserve (Fed) kept interest rates on hold on Wednesday and failed to provide fresh clues on the monetary policy direction. Still, after the dust settled, US indexes trimmed most of their early losses and the Dow Jones Industrial Average (DJIA) posts modest gains, while the Nasdaq Composite and the S&P 500 trade a handful of points below their Wednesday’s close.
On Friday, the focus will be on Germany, as the country will release December Retail Sales and the preliminary estimate of the January Harmonized Index of Consumer Prices (HICP). The US will publish the December PCE Price Index, but following the GDP release, the report will not be a surprise; hence, the market will post a limited reaction to the news.
From a technical point of view, the daily chart for XAU/USD shows the bullish momentum is strong enough to anticipate a break through $2,800 in the upcoming sessions. The pair develops well above all its moving averages, with the 20 Simple Moving Average (SMA) accelerating north above the longer ones while providing dynamic support at around $2,710. Technical indicators, in the meantime, resumed their advances within positive levels, approaching overbought readings yet still with room to go.
The XAU/USD 4-hour chart also supports another leg north. Technical indicators maintain their bullish slopes while entering overbought territory. Finally, the bright metal develops above all its moving averages, with the 20 SMA gaining upward traction at around $2,758 while standing well above the 100 and 200 SMAs. The former all-time high at
Support levels: 2,789.90 2,777.40 2,766.05
Resistance levels: 2,800.00 2,812.00 2,825.00
Important DisclaimersThe content provided on the website includes general news and publications, our personal analysis and opinions, and contents provided by third parties, which are intended for educational and research purposes only. It does not constitute, and should not be read as, any recommendation or advice to take any action whatsoever, including to make any investment or buy any product. When making any financial decision, you should perform your own due diligence checks, apply your own discretion and consult your competent advisors. The content of the website is not personally directed to you, and we does not take into account your financial situation or needs.The information contained in this website is not necessarily provided in real-time nor is it necessarily accurate. Prices provided herein may be provided by market makers and not by exchanges.Any trading or other financial decision you make shall be at your full responsibility, and you must not rely on any information provided through the website. FX Empire does not provide any warranty regarding any of the information contained in the website, and shall bear no responsibility for any trading losses you might incur as a result of using any information contained in the website.The website may include advertisements and other promotional contents, and FX Empire may receive compensation from third parties in connection with the content. FX Empire does not endorse any third party or recommends using any third party’s services, and does not assume responsibility for your use of any such third party’s website or services.FX Empire and its employees, officers, subsidiaries and associates, are not liable nor shall they be held liable for any loss or damage resulting from your use of the website or reliance on the information provided on this website.Risk DisclaimersThis website includes information about cryptocurrencies, contracts for difference (CFDs) and other financial instruments, and about brokers, exchanges and other entities trading in such instruments. Both cryptocurrencies and CFDs are complex instruments and come with a high risk of losing money. You should carefully consider whether you understand how these instruments work and whether you can afford to take the high risk of losing your money.FX Empire encourages you to perform your own research before making any investment decision, and to avoid investing in any financial instrument which you do not fully understand how it works and what are the risks involved.
The natural gas markets have rallied slightly during the trading session and the early hours of Thursday, but still, we see a lot of lack of interest. We have switched over to the March contract and that is going to have a lot to do with where we go next. Quite frankly, now that you’re in the March contract, you’re starting to think about spring. And yes, I realize it’s just now turning February, but it is a futures market. And your CFD contract that you might be trading will be following this one way or another. Sometimes it is the average price, sometimes it’s just the front month, which would be this month, March, or other times it is halfway between two contracts. You just never know what you’re getting with the CFD.
So, with that, we look at the futures market and it tells us that things are going lower. That makes sense as it is expected to be warmer than usual in the month of March in North America and by extension, somewhat the same in Europe, and if that’s going to be the case, demand for natural gas is going to fall off of a cliff. This happens every year, there’s nothing particularly unique about this, it’s just that it might be happening a little earlier than usual. So, as things stand right now, I like the idea of fading rallies, assuming we get one. Any bounce for a couple of days that shows a long wick on top of it, I’m more than willing to start shorting.
January 30, 2025 – Written by Tim Boyer
STORY LINK Pound to Euro Forecast Today: GBP/EUR Steady Ahead of ECB
The Pound Sterling (GBP) held firm near its recent highs against the Euro (EUR) on Wednesday morning, with investors adopting a wait-and-see approach ahead of key events later this week.
At the time of writing, Pound Euro (GBP/EUR) exchange rate was trading at approximately €1.1937, showing little movement from Wednesday’s opening levels.
The Euro (EUR) remained flat on Wednesday as market participants refrained from making any aggressive bets ahead of the European Central Bank’s (ECB) latest interest rate decision.
The ECB is widely expected to cut interest rates by 25 basis points when it concludes its first policy meeting of 2025 on Thursday.
While the rate cut itself appears largely priced in, the Euro’s performance will likely hinge on the bank’s forward guidance.
Should ECB officials hint at further monetary easing in the months ahead, the single currency could face additional downside pressure.
Conversely, if policymakers suggest that they would prefer to hold off from further cuts for now, it may help stem losses in EUR exchange rates.

All eyes will be on ECB President Christine Lagarde’s comments, with investors seeking clarity on the central bank’s assessment of the Eurozone economy and its resilience amid ongoing global trade tensions.
The Pound (GBP) traded in a narrow range on Wednesday as UK Chancellor Rachel Reeves outlined her ambitious plans for boosting economic growth.
In her latest speech, Reeves unveiled proposals to establish a high-tech hub between Oxford and Cambridge, dubbed ‘Europe’s Silicon Valley,’ alongside renewed government backing for Heathrow’s third runway.
The government estimates these initiatives could contribute £78bn to the UK economy over the next decade.
However, Sterling’s reaction has been muted, with businesses seeming unconvinced as they still face the increased tax burden of Reeves’s previous Budget.
The ECB’s policy decision is expected to dominate the movement in the Pound to Euro exchange rate on Thursday.
However, before the ECB announcement, the Euro could come under pressure from the Eurozone’s fourth-quarter GDP figures.
Economists predict growth slowed sharply, dropping from 0.4% to just 0.1%. Signs of a stalling Eurozone economy could amplify expectations for extended ECB easing, potentially dragging the Euro lower.
Meanwhile, the absence of major UK economic data through the second half of the week may leave the Pound’s movements tied to broader market sentiment.
International Money Transfer? Ask our resident FX expert a money transfer question or try John’s new, free, no-obligation personal service! ,where he helps every step of the way,
ensuring you get the best exchange rates on your currency requirements.
TAGS: Pound Euro Forecasts
Natural gas price formed temporary correctional bullish wave yesterday to fluctuate above 50% Fibonacci correction level at 3.130$, attempting to cover some previous losses to settle near 3.200$.
Note that the MA55 continues to form additional barrier at 3.260$, along with stochastic consolidation within the oversold areas, these factors support the domination of the bearish bias for the near-term and medium-term period, to keep waiting to form new negative waves and target 2.970$ followed by 2.840$ levels.
The expected trading range for today is between 2.970$ and 3.200$
Trend forecast: Bearish