The main category of Forex News.
You can use the search box below to find what you need.
[wd_asp id=1]
The main category of Forex News.
You can use the search box below to find what you need.
[wd_asp id=1]
Tron’s currency price (TRXUSD) fell in the intraday levels after bumping into the resistance of the 50-day SMA, amid the dominance of the downward correctional trend in the short term, with negative signals from the RSI after reaching overbought levels compared to the price’s movements, hinting at negative divergence, and doubling negative pressure.
Therefore we expect more losses for the price, targeting the important support of $0.21619887, provided the resistance of $0.27477425 holds on.
Trend forecast for today: Bearish
Natural gas price kept its stability within the bullish channel that its major support line located at 3.680$, to notice renewing the positive action by targeting 4.030$ barrier now, which formed the first target for the recent bullish overview.
Now, stochastic exit from the oversold areas will reinforce the chances of gathering the positive momentum to manage to surpass the current barrier and achieve additional gains by rallying towards 4.220$ followed by reaching the bullish channel’s resistance line at 4.420$.
The expected trading range for today is between 3.920$ and 4.220$
Trend forecast: Bullish
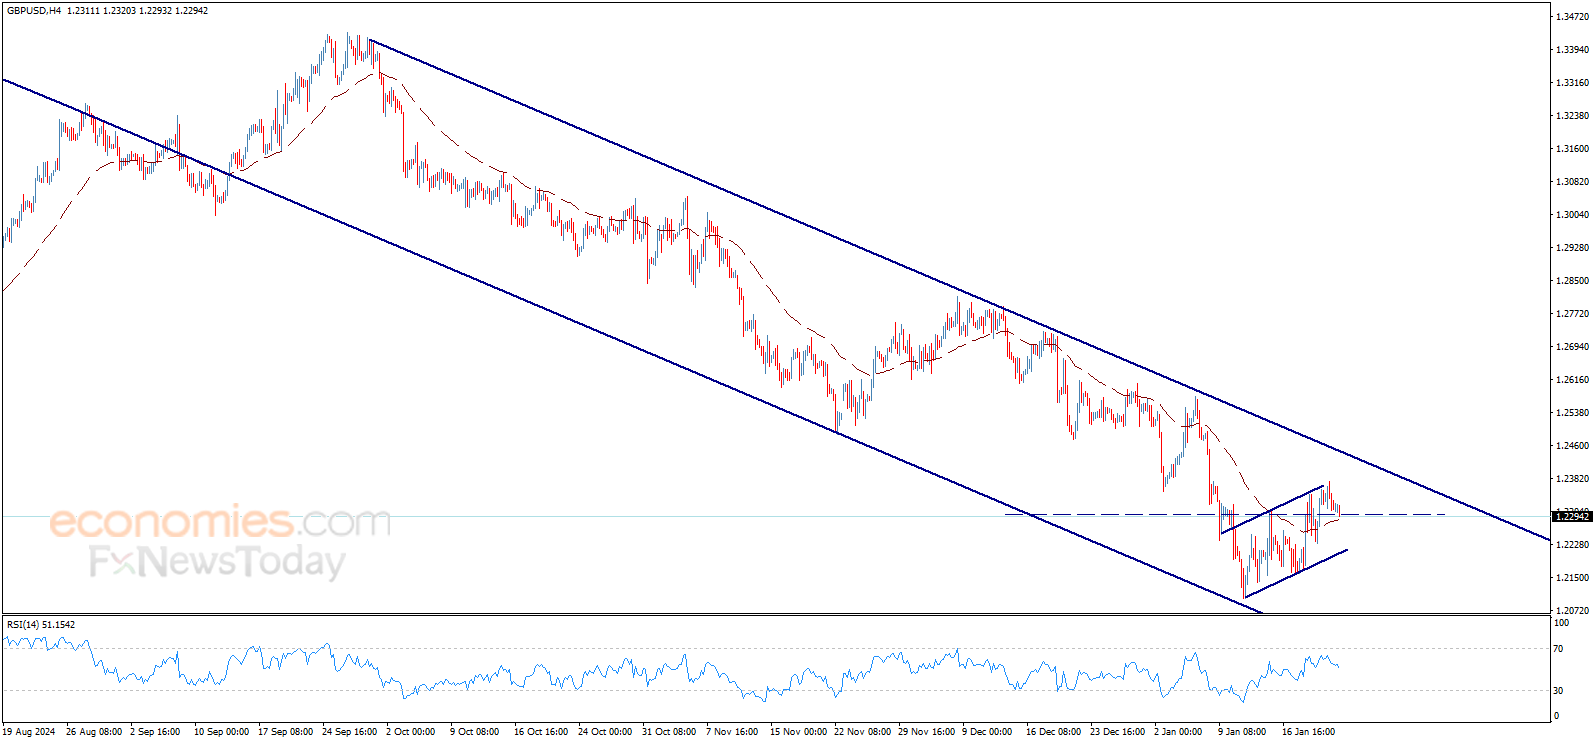
The GBPUSD price bounced upwards clearly after the consolidation of 1.2300$ support line against the recent negative attempts, to approach the main bearish channel’s resistance now, and we prefer to stay aside until the price confirms its situation according to the key levels represented by the mentioned support and 1.2440$ resistance.
Note that the continuation of the rise and breaching this resistance will push the price to start bullish correction that its first main target located at 1.2610$, while breaking the support represents the key to resume the main bearish trend and head to achieve negative targets that start by visiting 1.2210$ areas.
The expected trading range for today is between 1.2300$ support and 1.2475$ resistance
Trend forecast: Neutral
Crude oil price succeeded to achieve our first waited target at 75.53$, noticing that the price closed the last daily candlestick below it, reinforcing the expectations of continuing the domination of the bearish correction to head towards visiting 73.90$ as a next main target.
Therefore, we will continue to suggest the bearish trend for the upcoming period, affected by the head and shoulders’ pattern that appears on the chart, taking into consideration that breaching 75.53$ and holding above it might push the price to start recovery attempts and achieve intraday gains that target testing 76.90$ followed by 77.53$ areas before any new attempt to decline.
The expected trading range for today is between 73.70$ support and 76.70$ resistance
Trend forecast: Bearish
Gold price regains poise and gears up for another run higher early Friday after taking a breather on Thursday. Gold buyers flirt with three-month highs near $2,760, awaiting some clarity on US President Donald Trump’s trade policies and the S&P Global preliminary US business PMI data.
Gold price holds onto the recent upside, courtesy of its persistent appeal as a traditional safety asset as markets remain wary of Trump’s tariff and immigration policies and their impact on the economic outlook.
Earlier in the week, Trump announced plans to impose tariffs on imports from Canada, Mexico, China, and the European Union on February 1. However, no further clarity has been provided, leaving investors flocking to safety in the bright metal.
In his Word Economic Forum (WEF) virtual speech, the 47th US President called for a lower US Dollar (USD) and interest rates globally, acting as a headwind for the Greenback while rendering positive for the non-yielding Gold price.
Gold traders now eagerly await the global preliminary Manufacturing and Services PMI reports for January, which could provide fresh insights into the economic prospects on both sides of the Atlantic. Disappointing data could revive global growth fears amid a looming trade war, spooking markets and driving safe-haven flows into the Gold price.
Further, a hawkish interest rate hike delivered by the Bank of Japan (BoJ) could trigger a fresh USD/JPY slide-led USD weakness, supporting the Gold price upisde.
Despite a positive view of the Gold price, the metal could see some pullback late Friday as traders cash in on their long positions heading into next week’s US Federal Reserve (Fed) policy decision and the four-quarter US advance Gross Domestic Product (GDP) data release.
The daily chart shows that the short-term technical outlook remains more or less the same for Gold price.
Gold price remains on track to test the record high of $2,790 or the symmetrical triangle target, measured at $2,785.
Gold price charted a symmetrical triangle breakout earlier this month while it holds comfortably above all the major daily simple moving averages (SMA), supporting the bullish case.
The 14-day Relative Strength Index (RSI) sits beneath the overbought region, currently near 69, justifying the latest leg up.
Adding credence to the constructive outlook, the 50-day SMA closed above the 100-day SMA on Thursday, confirming a Bear Cross.
Gold price must seek a daily closing above the November 2024 high of $2,762 to take on the next target near the aforementioned resistance near $2,790.
Alternatively, Gold price could test the previous day’s low of $2,736 if the pullback sets in.
Sellers will then aim for the $2,700 round level, below which the 21-day SMA at $2,678 will be threatened.
The S&P Global Manufacturing Purchasing Managers Index (PMI), released on a monthly basis, is a leading indicator gauging business activity in the US manufacturing sector. The data is derived from surveys of senior executives at private-sector companies from the manufacturing sector. Survey responses reflect the change, if any, in the current month compared to the previous month and can anticipate changing trends in official data series such as Gross Domestic Product (GDP), industrial production, employment and inflation. A reading above 50 indicates that the manufacturing economy is generally expanding, a bullish sign for the US Dollar (USD). Meanwhile, a reading below 50 signals that activity in the manufacturing sector is generally declining, which is seen as bearish for USD.
Next release: Fri Jan 24, 2025 14:45 (Prel)
Frequency: Monthly
Consensus: 49.6
Previous: 49.4
Source: S&P Global
Trading remains within a rough two-week trading range reflecting some degree of consolidation near trend highs. Therefore, volatility may stay muted and choppy for the time being. Today could be a rest day following the bounce yesterday from the 20-Day MA (3.80) support zone that includes the day’s low at 3.71, now a higher swing low. That low is now part of the price structure of higher swing highs and higher swing lows pertaining to the rising trend.
A rally above today’s high of 4.05 will signal strength and the possibility of testing higher resistance levels. The 61.8% retracement of the most recent downswing is at 4.09, while a monthly high from December is at 4.20. There is confirmation of the monthly high at the 78.6% retracement, also at 4.20. Resistance could be seen around either of those price areas.
Higher up is a significant price level, a lower swing high and double top at 4.33. That swing high was a little shy of the recent trend high at 4.37. An advance above 4.33 would be needed before there was a clear bullish continuation signal for the trend. Until then the expectation is for resistance to be seen and further fluctuations within a range.
Nonetheless, a sign of weakening would first be indicated on a drop below this week’s low at 3.71. There is subsequently an identified potential support zone down to 3.64. Consequently, the 3.64 should provide a more significant price level as a drop below it looks like it leads to a lower potential support zone from 3.52 to 3.51. The lower price level is the 61.8% Fibonacci retracement.
For a look at all of today’s economic events, check out our economic calendar.
Silver price (XAG/USD) dives an almost 1.75% to near $30.00 in North American trading hours on Thursday. The white metal has been hit hard as the overall market sentiment has broadly stabilized. The market mood has become favorable for risk-perceived assets as United States (US) President Donald Trump has not imposed tariff hikes yet, while he was anticipated to do the same right on his first day at work.
Donald Trump has commented that he is considering 25% tariff hikes on Mexico and Canada and 10% on China that will come into effect from February 1. His presidential memo also suggested that tariffs are not coming swiftly, and he directed federal agencies to study trade policies and evaluate trade relationships. No concrete announcement of tariff hikes has eased the risk-aversion mood as market participants expect Trump’s tariff policy implementation will be more gradual than feared.
Apart from growing expectations that Russia might have a truce with Ukraine, it has also trimmed the risk premium of precious metals. Trump has threatened to impose sanctions on Russia if he continues the war with Ukraine.
Historically, the safe-haven demand for precious metals, such as Silver, diminishes in a stable risk environment.
Meanwhile, the US Dollar Index (DXY), which tracks the Greenback’s value against six major currencies, trades subduedly after gaining ground post refreshing the two-week low of 107.75. The US Dollar (USD) is expected to remain broadly sideways, with investors awaiting the Federal Reserve’s (Fed) monetary policy decision on Wednesday. The Fed is almost certain to announce a pause to the current policy-easing spell and leave interest rates unchanged in the range of 4.25%-4.50%.
Silver price falls back to near the 20-day Exponential Moving Average (EMA) around $30.25 after failing to break above the upward-sloping trendline around $30.90, which is plotted from 29 February 2024 low of $22.30 on a daily timeframe.
The broader outlook of the Silver price remains firm above the 200-day Exponential Moving Average (EMA), which trades around $29.50.
The 14-day Relative Strength Index (RSI) oscillates in the 40.00-60.00 range, suggesting a sideways trend.
Silver is a precious metal highly traded among investors. It has been historically used as a store of value and a medium of exchange. Although less popular than Gold, traders may turn to Silver to diversify their investment portfolio, for its intrinsic value or as a potential hedge during high-inflation periods. Investors can buy physical Silver, in coins or in bars, or trade it through vehicles such as Exchange Traded Funds, which track its price on international markets.
Silver prices can move due to a wide range of factors. Geopolitical instability or fears of a deep recession can make Silver price escalate due to its safe-haven status, although to a lesser extent than Gold’s. As a yieldless asset, Silver tends to rise with lower interest rates. Its moves also depend on how the US Dollar (USD) behaves as the asset is priced in dollars (XAG/USD). A strong Dollar tends to keep the price of Silver at bay, whereas a weaker Dollar is likely to propel prices up. Other factors such as investment demand, mining supply – Silver is much more abundant than Gold – and recycling rates can also affect prices.
Silver is widely used in industry, particularly in sectors such as electronics or solar energy, as it has one of the highest electric conductivity of all metals – more than Copper and Gold. A surge in demand can increase prices, while a decline tends to lower them. Dynamics in the US, Chinese and Indian economies can also contribute to price swings: for the US and particularly China, their big industrial sectors use Silver in various processes; in India, consumers’ demand for the precious metal for jewellery also plays a key role in setting prices.
Silver prices tend to follow Gold’s moves. When Gold prices rise, Silver typically follows suit, as their status as safe-haven assets is similar. The Gold/Silver ratio, which shows the number of ounces of Silver needed to equal the value of one ounce of Gold, may help to determine the relative valuation between both metals. Some investors may consider a high ratio as an indicator that Silver is undervalued, or Gold is overvalued. On the contrary, a low ratio might suggest that Gold is undervalued relative to Silver.
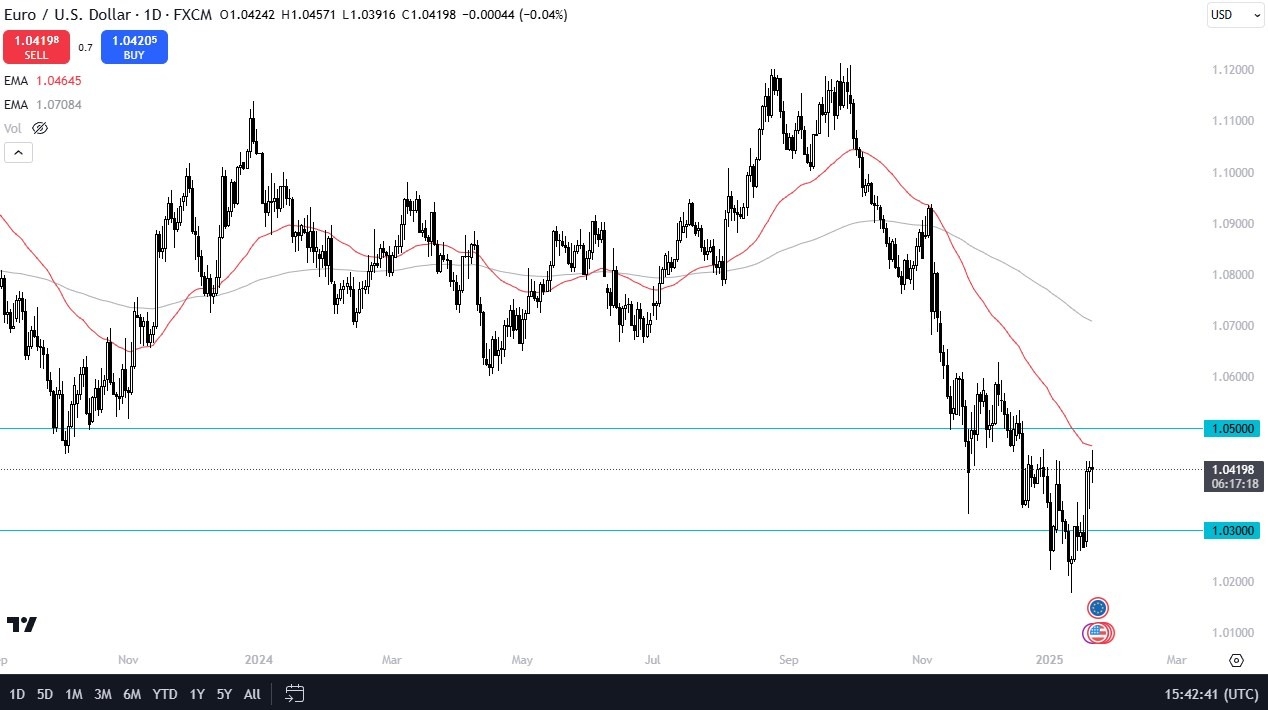
The technical analysis for this pair is rather negative, and it probably will remain so. The neutral candlestick itself isn’t such a big deal, but it’s the fact that it has formed near the 50 Day EMA, so I think that if we break down below the lows of the trading session on Wednesday, it’s very likely that the euro will try to get down to the 1.03 level underneath. The 1.03 level underneath of course is a large, round, psychologically significant figure that a lot of people will be watching. It’s an area that has seen a lot of buying pressure, so I think a revisit of that area makes quite a bit of sense.
However, if we were to break above the 1.05 level, then we have a lot of noise all the way to the 1.06 level. It’s at the 1.06 level that if the euro can overcome that region, I think it finally has proven itself. Ultimately, I think that’s a tall order, and therefore I’m looking for opportunities to fade the euro on signs of exhaustion and today may very well have been that session on Wednesday. If we break down, I will not hesitate to start shorting this pair for a short-term trade. If we can get below the 1.02 level, the euro will end up visiting parity quicker than most people anticipate.

Ready to trade our free trading signals? We’ve made a list of the best European brokers to trade with worth using.
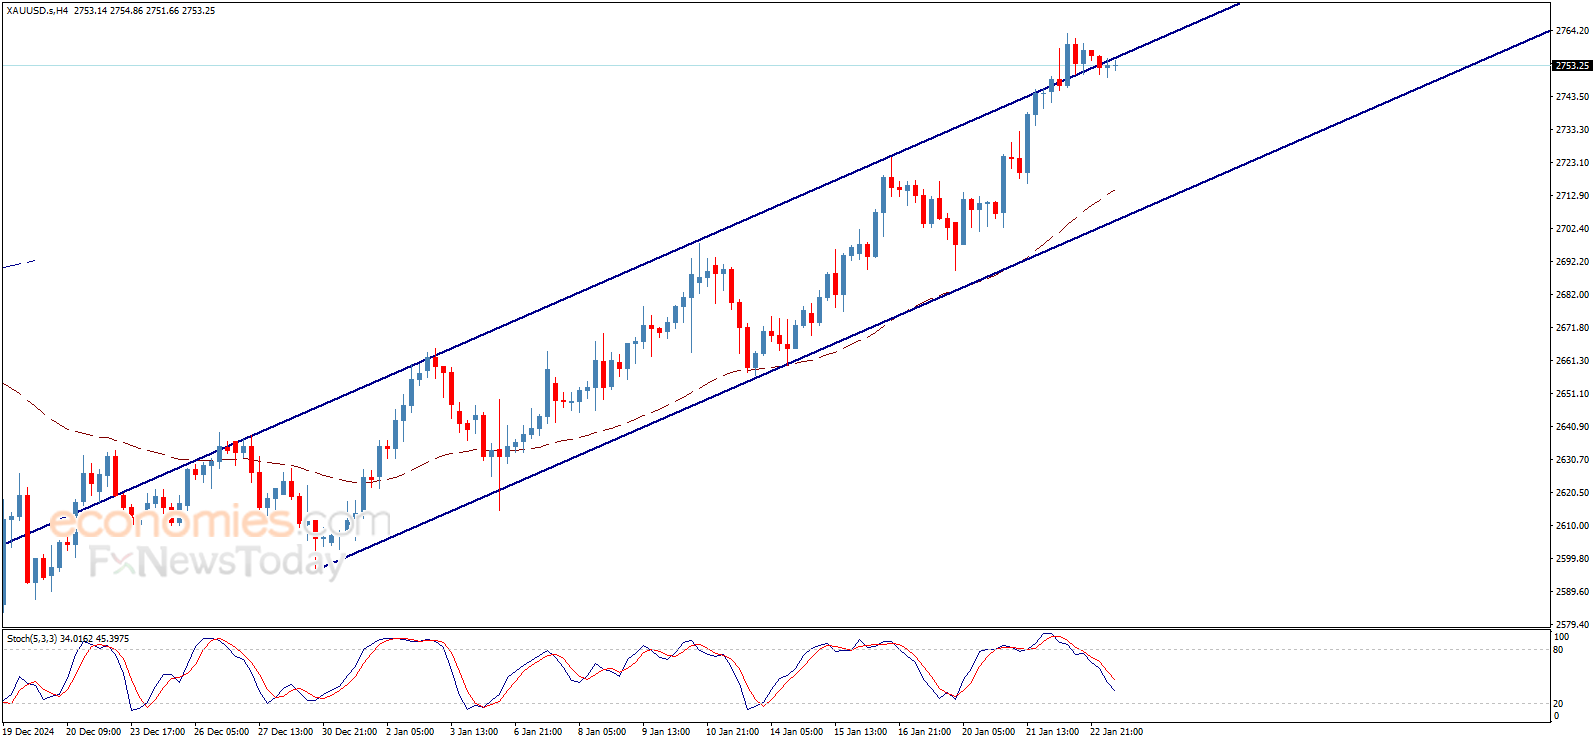
Gold price hovers around the bullish channel’s resistance line and still below it, to keep the bearish trend scenario valid and active for today, waiting to head towards 2707.00$ as a next main target.
We remind you that breaking 2744.00$ is required to reinforce the expectations to decline, which will remain valid unless breaching 2755.00$ and holding above it.
The expected trading range for today is between 2730.00$ support and 2765.00$ resistance.
Trend forecast: Bearish
Overall, the most supportive outcome for the US dollar would involve Trump signalling comprehensive tariffs on imports, which would raise inflation and interest rates in the United States. It would also punish currencies belonging to major exporters. Instead, Trump tasked federal agencies with studying current trade imbalances and tariff scenarios, asking them to report back on April 1st. At this stage, key names such as Jameson Greer will be installed in the government and will be able to lead the new agenda.
Dear TradersUp follower, the Japanese yen will remain in a state of waiting until the reaction to the decisions of the Japanese central bank, in addition to monitoring the appetite of investors to risk or not.
Japanese bond yields rise before the meeting of the Bank of Japan
According to recent trading, the yield on the Japanese government bond for 10 years rose to more than 1.2%, recovering from its lowest levels in two weeks, with growing expectations that the Bank of Japan will raise interest rates this week after hawkish comments from central bank officials. As is known, raising interest rates will increase short-term borrowing costs in Japan to 0.5%, the highest level since the global financial crisis in 2008.
In this regard, Bank of Japan Governor Ueda recently indicated that the central bank would consider raising interest rates if the economy continued to perform well, while Deputy Governor Himeno noted that it would be unusual for real interest rates to remain negative once Japan had overcome deflationary pressures. The Bank of Japan is also expected to revise its inflation forecast upwards, amid growing expectations that wage increases will help Japan achieve its 2% inflation target sustainably.
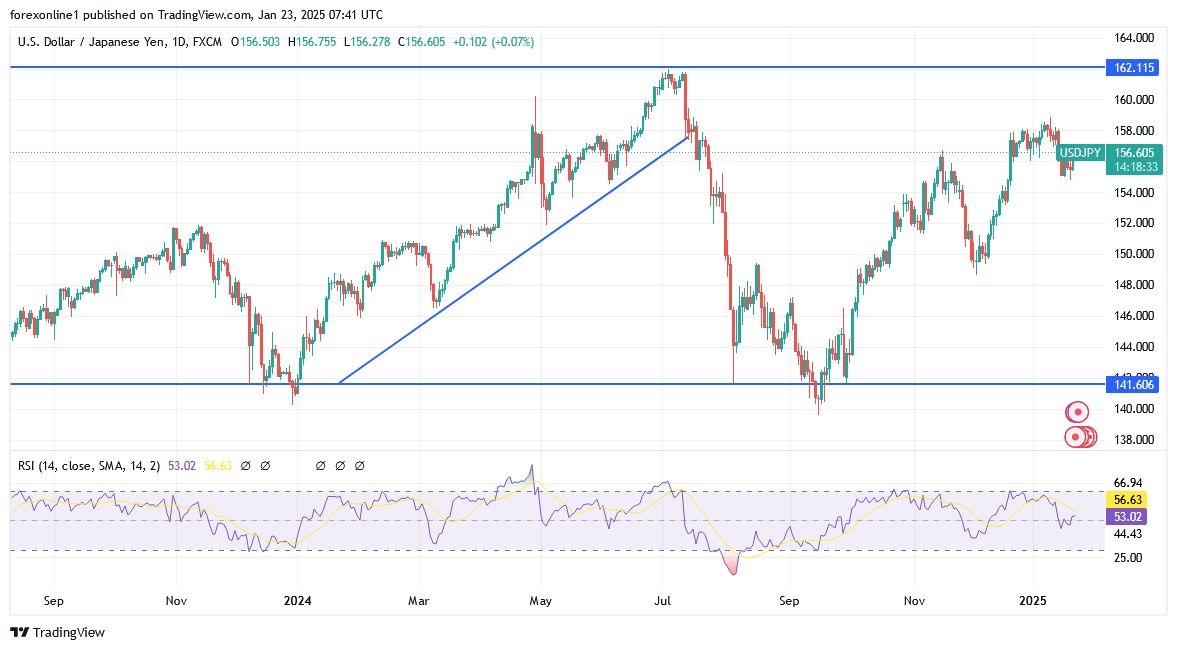
Dear reader, the performance of the USD/JPY currency pair remains neutral. However, we still prefer buying the currency pair from every downward level. Currently, the closest support levels on the daily chart are 154.70 and 152.90 respectively. Conversely, and on the same timeframe, the resistance of 158.30 will remain a key for the bulls to move quickly to the psychological resistance of 160.00, which will move the technical indicators towards strong overbought levels, led by the Relative Strength Index and the Stochastic Oscillator. At the same time, talk of Japanese intervention in the Forex markets to prevent further decline in the value of the Japanese Yen will increase.
Ready to trade our Forex daily forecast? We’ve shortlisted the best FX trading platform in the industry for you.