The main category of Forex News.
You can use the search box below to find what you need.
[wd_asp id=1]
The main category of Forex News.
You can use the search box below to find what you need.
[wd_asp id=1]
Crude oil price shows positive trades now, and it might head to test 77.53$ again before turning back to decline.
Until now, we still suggest the continuation of the correctional bearish trend affected by the previously completed head and shoulders’ pattern, reminding you that our targets begin at 75.53$ and extend to 73.90$ after breaking the previous level.
The expected trading range for today is between 74.60$ support and 77.60$ resistance
Trend forecast: Bearish
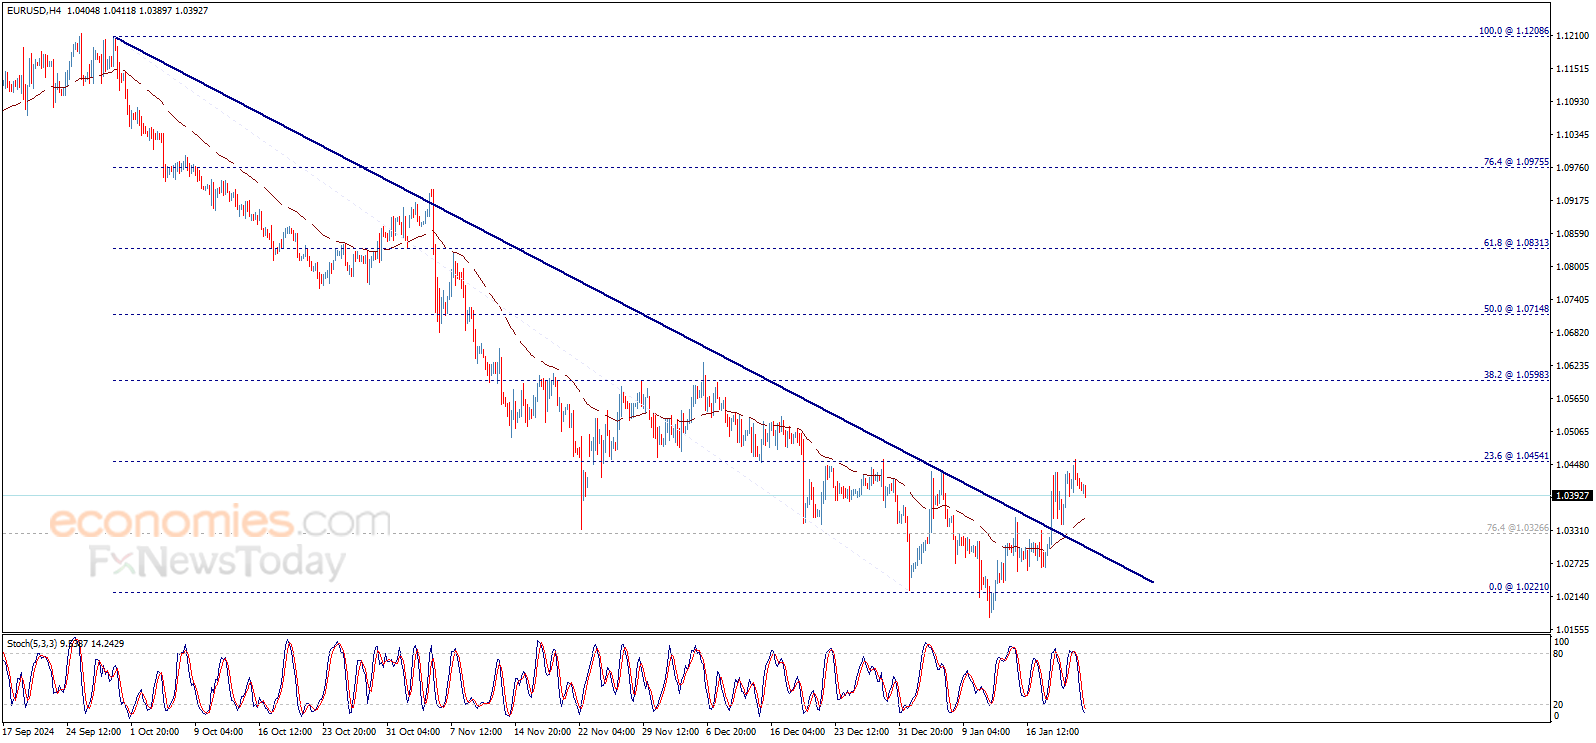
EUR/USD continues to move up and down in a narrow channel above 1.0400 in the American session on Thursday. The pair’s technical outlook suggests that the bullish bias remains intact, while lacking momentum.
The table below shows the percentage change of Euro (EUR) against listed major currencies this week. Euro was the strongest against the US Dollar.
| USD | EUR | GBP | JPY | CAD | AUD | NZD | CHF | |
|---|---|---|---|---|---|---|---|---|
| USD | -1.31% | -1.25% | 0.06% | -0.61% | -1.29% | -1.31% | -0.55% | |
| EUR | 1.31% | -0.01% | 1.29% | 0.60% | 0.07% | -0.11% | 0.64% | |
| GBP | 1.25% | 0.01% | 1.21% | 0.60% | 0.10% | -0.11% | 0.65% | |
| JPY | -0.06% | -1.29% | -1.21% | -0.68% | -1.30% | -1.46% | -0.79% | |
| CAD | 0.61% | -0.60% | -0.60% | 0.68% | -0.61% | -0.70% | 0.05% | |
| AUD | 1.29% | -0.07% | -0.10% | 1.30% | 0.61% | -0.28% | 0.48% | |
| NZD | 1.31% | 0.11% | 0.11% | 1.46% | 0.70% | 0.28% | 0.57% | |
| CHF | 0.55% | -0.64% | -0.65% | 0.79% | -0.05% | -0.48% | -0.57% |
The heat map shows percentage changes of major currencies against each other. The base currency is picked from the left column, while the quote currency is picked from the top row. For example, if you pick the Euro from the left column and move along the horizontal line to the US Dollar, the percentage change displayed in the box will represent EUR (base)/USD (quote).
The data from the US showed on Thursday that the weekly Initial Jobless Claims rose to 223,000 in the week ending January 18 from 217,000 in the previous week. This reading came in above the market expectation of 220,000 and limited the US Dollar’s gains, in turn helping EUR/USD find support.
Meanwhile, Wall Street’s main indexes trade mixed following the opening bell, reflecting a cautious market stance ahead of US President Donald Trump’s speech at the World Economic Forum in Davos. At the time of press, the Dow Jones Industrial Average was up 0.2%, while the Nasdaq Composite was down 0.5%.
In case safe-haven flows dominate the action following Trump’s remarks, EUR/USD could have a hard time regaining its traction.
On Friday, S&P Global will publish the preliminary January Manufacturing and Services Purchasing Managers Index (PMI) data for Germany, the Eurozone and the US.
The Relative Strength Index (RSI) moves sideways above 50, suggesting that the bullish bias remains unchanged but it’s struggling to gather momentum. EUR/USD faces key support level at 1.0390, where the 200-period Simple Moving Average (SMA) meets the Fibonacci 50% retracement of the latest downtrend. A daily close below this level could attract technical sellers and open the door for an extended decline toward 1.0350 (Fibonacci 38.2% retracement) and 1.0320 (100-period SMA).
On the upside, first resistance could be spotted at 1.0440 (Fibonacci 61.8% retracement, 50-day SMA) ahead of 1.0500 (round level, Fibonacci 78.6% retracement).
The Euro is the currency for the 19 European Union countries that belong to the Eurozone. It is the second most heavily traded currency in the world behind the US Dollar. In 2022, it accounted for 31% of all foreign exchange transactions, with an average daily turnover of over $2.2 trillion a day. EUR/USD is the most heavily traded currency pair in the world, accounting for an estimated 30% off all transactions, followed by EUR/JPY (4%), EUR/GBP (3%) and EUR/AUD (2%).
The European Central Bank (ECB) in Frankfurt, Germany, is the reserve bank for the Eurozone. The ECB sets interest rates and manages monetary policy. The ECB’s primary mandate is to maintain price stability, which means either controlling inflation or stimulating growth. Its primary tool is the raising or lowering of interest rates. Relatively high interest rates – or the expectation of higher rates – will usually benefit the Euro and vice versa. The ECB Governing Council makes monetary policy decisions at meetings held eight times a year. Decisions are made by heads of the Eurozone national banks and six permanent members, including the President of the ECB, Christine Lagarde.
Eurozone inflation data, measured by the Harmonized Index of Consumer Prices (HICP), is an important econometric for the Euro. If inflation rises more than expected, especially if above the ECB’s 2% target, it obliges the ECB to raise interest rates to bring it back under control. Relatively high interest rates compared to its counterparts will usually benefit the Euro, as it makes the region more attractive as a place for global investors to park their money.
Data releases gauge the health of the economy and can impact on the Euro. Indicators such as GDP, Manufacturing and Services PMIs, employment, and consumer sentiment surveys can all influence the direction of the single currency. A strong economy is good for the Euro. Not only does it attract more foreign investment but it may encourage the ECB to put up interest rates, which will directly strengthen the Euro. Otherwise, if economic data is weak, the Euro is likely to fall. Economic data for the four largest economies in the euro area (Germany, France, Italy and Spain) are especially significant, as they account for 75% of the Eurozone’s economy.
Another significant data release for the Euro is the Trade Balance. This indicator measures the difference between what a country earns from its exports and what it spends on imports over a given period. If a country produces highly sought after exports then its currency will gain in value purely from the extra demand created from foreign buyers seeking to purchase these goods. Therefore, a positive net Trade Balance strengthens a currency and vice versa for a negative balance.
Gold (XAU/USD) fails to extend its weekly rally on Thursday, coming under some renewed selling pressure following three consecutive days of gains.
Indeed, the precious metal surged past $2,760 per troy ounce for the first time since early November on Wednesday, driven by persistent uncertainty surrounding announcements from United States (US) President Donald Trump, particularly his stance on tariffs.
However, the rally wasn’t without its hurdles. The US Dollar (USD) regained some of its strength, with the Dollar Index (DXY) bouncing off multi-week lows and reaching two-day highs near the key 108.00 milestone. This was in the context of further recovery in US yields across the board.
Despite the yellow metal’s retracement, President Trump’s still unclear plans to impose tariffs on the European Union, Canada, Mexico, and Chinese imports appear to underpin the metal for the time being.
Still around tariffs, Trump’s tariff-driven policies could complicate Gold’s outlook. While gold is traditionally viewed as a hedge against inflation, analysts warn that if tariffs fuel higher inflation, the Federal Reserve (Fed) might be forced to maintain elevated interest rates for a longer period. This could dampen the metal’s appeal, as the non-yielding asset tends to lose favour in a high-rate environment.
In the short term, market attention will remain focused on developments from the White House, especially given the lighter economic calendar this week. Investors are also gearing up for the FOMC January 28–29 meeting, where rates are expected to hold steady in the 4.25%–4.50% range.
As political uncertainty lingers and central bank decisions loom, gold’s position as a safe-haven asset could continue to attract attention.
On the technical front, gold’s next major resistance level lies at $2,763, the 2025 high reached on January 22. A break above this level could see traders eyeing the all-time top of $2,790, recorded on October 31. Beyond these levels, Fibonacci extensions of the 2024 rally suggest potential targets at $3,009, $3,123, and $3,288.
On the downside, key support levels include December’s low of $2,582, November’s low of $2,536, and the 200-day moving average at $2,517. A deeper correction could test $2,471 (September low) ahead of $2,353 (July’s weekly low).
In the event of a more significant selloff, traders should watch for levels near $2,286 (June low) and $2,277 (May low). The ultimate downside target for now stands at $1,984, the lowest level hit in 2024.
Gold daily chart
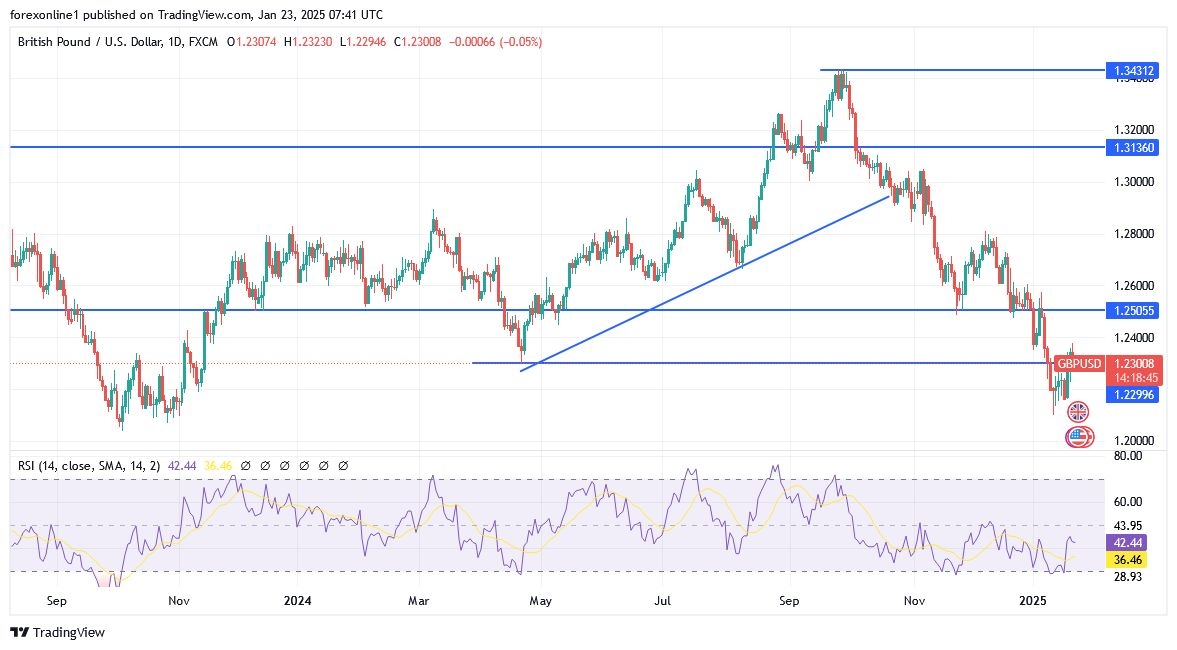
According to reliable trading platforms, the GBP/USD exchange rate has formed a base above 1.2160 and a short-term rise to the resistance of 1.24 may carry it in the coming days. According to trades, the weakness of the US dollar is the current driving force in the global foreign exchange market, reflecting investor relief that Donald Trump is preparing to pursue a more cautious tariff agenda. Overall, it is certain that US tariffs are coming, but the fire and brimstone he promised in the campaign has given way to a mixed message from Trump, who has tasked federal agencies with taking a closer look.

Recently, the most supportive outcome for the US dollar included Trump’s signal to impose comprehensive tariffs on imports, which would have raised inflation and interest rates in the United States. Also, it would have punished currencies belonging to major exporters. Instead, Trump tasked federal agencies with studying current trade imbalances and tariff scenarios, asking them to report back on April 1st. At this stage, key names such as Jameson Greer will be installed in the government and will be able to lead the new agenda.
According to analysts, changes to US tariffs are expected to be announced on or shortly after April 1 and take effect a month or two later. The bottom line is that changes to tariff policy are coming. But the timeline means there is plenty of time for companies (both US and foreign) and foreign governments to lobby for exemptions.
Recently, the foreign exchange “FOREX” market has built up a risk premium in currency valuations following Trump’s victory in November, contributing to new declines in the Pound Sterling against the Dollar and other US dollar exchange rates. With a clearer path to less severe trade outcomes, some of this premium has been priced in, contributing to the rise of the Pound Sterling against the Dollar.
However, tariffs are still coming, and analysts say it is too early to call an end to the US dollar’s advance. Experts believe that delayed tariffs are not cancelled tariffs by any means. This supports JPMorgan’s view that bouts of US dollar weakness will be “fading.” At the same time, Deutsche Bank analysis finds that financial markets may still be underestimating the impending change that Trump will bring. Bank analysts stated, “Our conclusions are not optimistic: Despite recent moves, the market is not pricing in the sustained total divergence between the United States and the rest of the world, nor a major trade war.”
Dear TradersUp follower, the pound has British problems that may affect its gains even if the US dollar declines in the coming days. The selling strategy is still the strongest.
Dear reader, according to the GBP/USD daily chart trades, the upward trend remains weak and awaits more stimulus. Technically, the resistance of 1.2570 will be the key to the bulls’ control of the trend and thus the readiness for stronger gains. Also, it confirms the beginning of the formation of an opposite upward channel. On the same timeframe, the support levels of 1.2260 and 1.2180 will remain the most important for the strength of the bears’ control and thus the readiness to move towards the psychological support level of 1.2000. Which in turn will move the technical indicators towards strong oversold levels.
Ready to trade our daily Forex analysis? Check out the best forex trading company in UK worth using.
Natural gas price kept its stability within the bullish channel that its major support line located at 3.680$, to notice renewing the positive action by targeting 4.030$ barrier now, which formed the first target for the recent bullish overview.
Now, stochastic exit from the oversold areas will reinforce the chances of gathering the positive momentum to manage to surpass the current barrier and achieve additional gains by rallying towards 4.220$ followed by reaching the bullish channel’s resistance line at 4.420$.
The expected trading range for today is between 3.920$ and 4.220$
Trend forecast: Bullish
The USD/JPY forecast shows a pause in the dollar’s recent climb as market participants await key central bank decisions. Traders paused ahead of Friday’s Bank of Japan meeting, where the central bank might hike rates by 25-bps.
-Are you interested in learning about forex tips? Click here for details-
The dollar recovered on Wednesday after Trump’s tariff policy plans became clearer. Although not immediate, the US president plans to impose a 25% tariff on imports from Mexico and Canada. At the same time, the government has united at a 10% tariff on goods from China. All this might happen by next month. However, experts believe the government might reveal concrete tariff plans in April.
Meanwhile, traders look forward to central bank meetings in the US and Japan. The Federal Reserve will meet next week, and economists expect a pause. Therefore, market participants will focus on the messaging for future policy moves. A hawkish outlook will boost the dollar. Meanwhile, a dovish one might lead to a pullback.
On the other hand, the Bank of Japan will meet on Friday, with traders pricing a 96% chance of a rate hike. Moreover, policymakers might signal more rate hikes to balance the impact of Trump’s policies on the global economy. At the same time, if the Fed remains hawkish, the dollar might pressure the yen lower. Therefore, the BoJ will have enough motivation to keep hiking rates.
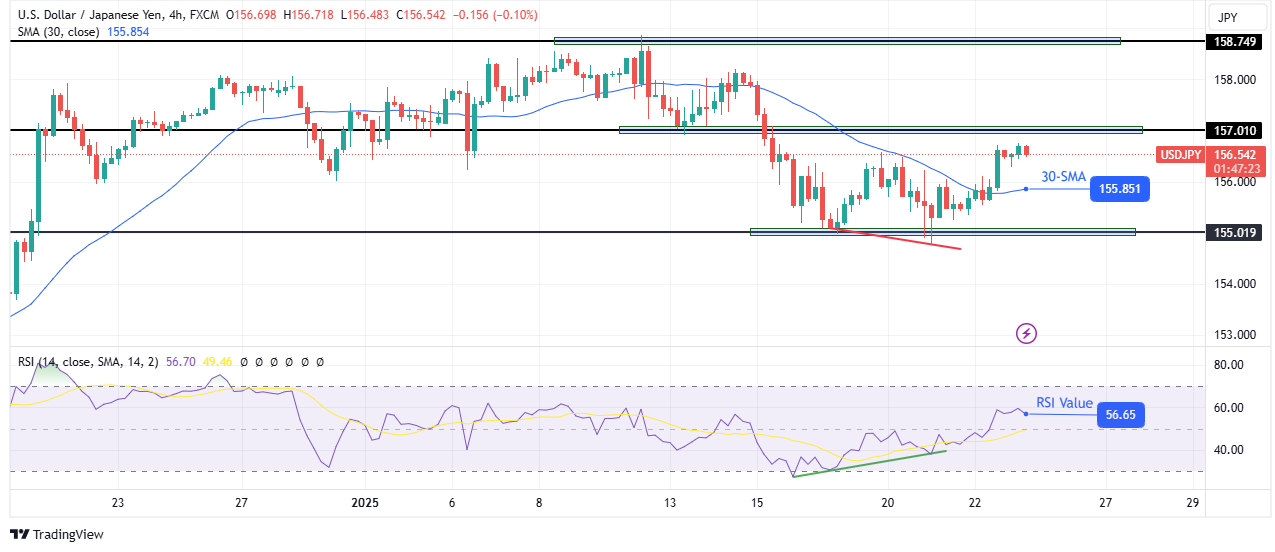
On the technical side, the USD/JPY price has broken above the 30-SMA resistance to indicate a bullish sentiment shift. This move came after the RSI made a bullish divergence, showing weak bearish momentum.
-Are you interested in learning about the forex basics? Click here for details-
The previous downtrend paused at the 155.01 support level, where bulls emerged. Although bears made another attempt to break below this level, the price made a large wick, showing a strong rejection. This allowed bulls to breach the 30-SMA resistance.
Currently, the price is eyeing the 157.01 resistance level. If it holds firm, USD/JPY will likely retest the 30-SMA as support before continuing higher. Meanwhile, if bulls are strong, they will break past the resistance to target the 158.74 key level.
Looking to trade forex now? Invest at eToro!
68% of retail investor accounts lose money when trading CFDs with this provider. You should consider whether you can afford to take the high risk of losing your money.
Platinum price failed to activate the bullish attack yesterday, affected by the MA55 that keeps forming additional barrier by settling near 955.00$, to notice forming some negative trades by fluctuating near 945.00$.
We expect to witness instability due to the continuous contradiction between the major indicators until achieving the required breach to manage to record new gains by rallying towards 983.00$ and 1005.00$ levels, noting that it is important to hold above 920.00$ support line to avoid any losses that might appear due to changing the bullish track.
The expected trading range for today is between 935.00$ and 955.00$
Trend forecast: Sideways
This chart produced by the TradingView platform.
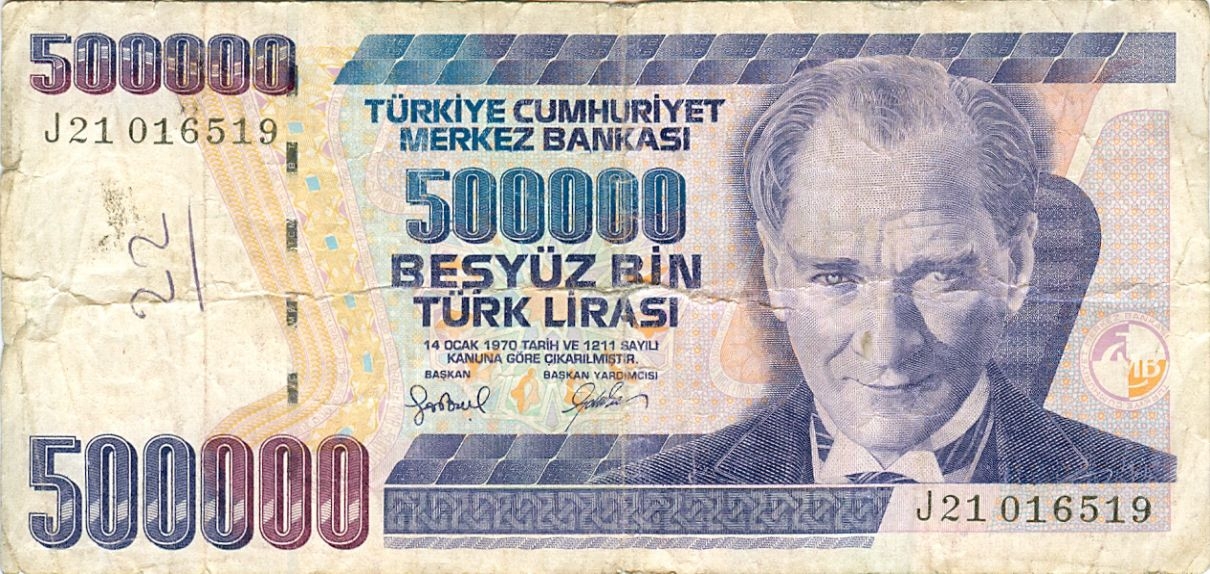
The Turkish Lira pair against the dollar stabilized in trading near its all-time low in early trading on Thursday morning. The pair’s trading stabilized amid anticipation of the Turkish Central Bank’s decision on interest rates, which is scheduled to be announced later today. Concurrently, Most estimates indicate that the interest rate will be held steady after the bank cut the interest rate by 250 basis points in the December meeting.
Previously, the Turkish Central Bank had announced new steps within the framework of its strategy to reduce the “protected deposit accounts against foreign exchange fluctuations” program, as part of the gradual shift towards more traditional economic policies. As of January 20, 2025, opening and renewing protected accounts with maturities of six and 12 months will be stopped, according to a statement by the central bank. The statement also explained that this step aims to reduce the protected deposit program, which was launched in December 2021 to support the stability of the Turkish lira and reduce dollarization. The program, which guaranteed depositors protection against exchange rate fluctuations, was criticized for its high cost and negative impact on the budget. With the government announcing a gradual reduction of the program in the summer of 2023, protected accounts have seen a continuous decline for more than 70 weeks.
Despite the decline in protected accounts, the share of the Turkish lira in total deposits increased to 58.7% at the beginning of this month, in a partial success for the central bank’s strategy to enhance the role of the local currency.
Meanwhile, investors followed the statements of Raghuram Rajan, former chief economist at the International Monetary Fund, during an interview at the Davos Summit on global economic trends and Turkey’s potential. Rajan expressed cautious optimism about the Turkish economy, noting that investments in the Middle East could open great opportunities for Turkey.
Technically, the dollar/lira pair (USD/TRY) stabilized near an all-time high of 35.64 lira on Thursday morning. The pair continued to trade within the upward price channel, while the pair faces resistance in the form of an upward trend line shown by the chart. Furthermore, the pair is expected to continue rising as it receives support by moving above the 50 and 200-day moving averages, as well as by trading the 50-day moving average on the 4-hour timeframe, which represents a strong support level. The Turkish lira price forecast indicates that the pair will continue to rise, targeting levels of 35.70 and 35.75, respectively.
Ready to trade our daily Forex forecast? Here’s a list of some of the top forex brokers in Turkey to check out.
Platinum price failed to activate the bullish attack yesterday, affected by the MA55 that keeps forming additional barrier by settling near 955.00$, to notice forming some negative trades by fluctuating near 945.00$.
We expect to witness instability due to the continuous contradiction between the major indicators until achieving the required breach to manage to record new gains by rallying towards 983.00$ and 1005.00$ levels, noting that it is important to hold above 920.00$ support line to avoid any losses that might appear due to changing the bullish track.
The expected trading range for today is between 935.00$ and 955.00$
Trend forecast: Sideways
Platinum price failed to activate the bullish attack yesterday, affected by the MA55 that keeps forming additional barrier by settling near 955.00$, to notice forming some negative trades by fluctuating near 945.00$.
We expect to witness instability due to the continuous contradiction between the major indicators until achieving the required breach to manage to record new gains by rallying towards 983.00$ and 1005.00$ levels, noting that it is important to hold above 920.00$ support line to avoid any losses that might appear due to changing the bullish track.
The expected trading range for today is between 935.00$ and 955.00$
Trend forecast: Sideways