The main category of Forex News.
You can use the search box below to find what you need.
[wd_asp id=1]
The main category of Forex News.
You can use the search box below to find what you need.
[wd_asp id=1]
Platinum price lost the positive momentum yesterday to force it to form temporary negative rebound and notice its stability near the additional support 935.00$, to settle above it and reinforce the chances of renewing the bullish attempts again.
Also, 920.00 level continues to form major support against the current trades, allowing us to wait to gather the positive momentum again to manage to surpass the MA55 at 955.00$ followed by extending trades towards the next main target at 983.00$.
The expected trading range for today is between 930.00$ and 955.00$
Trend forecast: Bullish
Silver price (XAG/USD) retraces its recent gains from the previous session, trading around $29.80 per barrel during the Asian hours on Wednesday. The price of the safe-haven Silver faces challenges due to risk-on market sentiment following reports about US President-elect Donald Trump’s economic team considering a gradual increase in import tariffs boosted investor confidence.
Bloomberg reported on Monday that Trump’s incoming administration is evaluating a phased approach to implementing tariffs, aiming to prevent a sharp rise in inflation while managing trade policy adjustments.
The non-yielding Silver faces challenges as the recent US labor market figures for December, which is expected to support the US Federal Reserve’s (Fed) decision to maintain interest rates at current levels in January.
Moreover, reinforced hawkish sentiment surrounding the Fed has sparked a rise in US Treasury yields. Rising yields boosted the US Dollar to recent highs, making Silver more expensive for buyers using foreign currencies and dampening Silver demand.
However, the Greenback corrects downwards following the disappointing US December Producer Price Index (PPI) data. Market participants will keep an eye on the US Consumer Price Index (CPI) inflation data, which is due later on Wednesday.
The demand for Silver could increase following China’s recent stimulus measures. As the world’s largest consumer of metals, any improvement in China’s economic conditions could significantly boost the industrial use of Silver.
People’s Bank of China (PBOC) Governor Pan Gongsheng stated on Monday that “interest rate and reserve requirement ratio (RRR) tools will be utilized to maintain ample liquidity.” Gongsheng reaffirmed China’s plans to increase the fiscal deficit and emphasized that China will continue to be a driving force for the global economy.
Silver is a precious metal highly traded among investors. It has been historically used as a store of value and a medium of exchange. Although less popular than Gold, traders may turn to Silver to diversify their investment portfolio, for its intrinsic value or as a potential hedge during high-inflation periods. Investors can buy physical Silver, in coins or in bars, or trade it through vehicles such as Exchange Traded Funds, which track its price on international markets.
Silver prices can move due to a wide range of factors. Geopolitical instability or fears of a deep recession can make Silver price escalate due to its safe-haven status, although to a lesser extent than Gold’s. As a yieldless asset, Silver tends to rise with lower interest rates. Its moves also depend on how the US Dollar (USD) behaves as the asset is priced in dollars (XAG/USD). A strong Dollar tends to keep the price of Silver at bay, whereas a weaker Dollar is likely to propel prices up. Other factors such as investment demand, mining supply – Silver is much more abundant than Gold – and recycling rates can also affect prices.
Silver is widely used in industry, particularly in sectors such as electronics or solar energy, as it has one of the highest electric conductivity of all metals – more than Copper and Gold. A surge in demand can increase prices, while a decline tends to lower them. Dynamics in the US, Chinese and Indian economies can also contribute to price swings: for the US and particularly China, their big industrial sectors use Silver in various processes; in India, consumers’ demand for the precious metal for jewellery also plays a key role in setting prices.
Silver prices tend to follow Gold’s moves. When Gold prices rise, Silver typically follows suit, as their status as safe-haven assets is similar. The Gold/Silver ratio, which shows the number of ounces of Silver needed to equal the value of one ounce of Gold, may help to determine the relative valuation between both metals. Some investors may consider a high ratio as an indicator that Silver is undervalued, or Gold is overvalued. On the contrary, a low ratio might suggest that Gold is undervalued relative to Silver.
The EURUSD price provided additional positive trades yesterday to test the EMA50, noticing that stochastic continues to lose the positive momentum, which supports the chances of bouncing bearishly to resume the main bearish trend, waiting to break 1.0220$ level to confirm rallying towards 1.0100$ as a next main target.
Holding below 1.0325$ is important to the continuation of the expected decline, as breaching it will lead the price to achieve more gains that reach 1.0455$ as a next positive station.
The expected trading range for today is between 1.0210$ support and 1.0360$ resistance
Trend forecast: Bearish
Crude oil price faced negative pressure to break 78.25$ level and settle below it, and by taking a deeper look at the chart, we find that the price is forming head and shoulders’ pattern that its confirmation line located at 77.45$, which means that breaking this level will push the price to continue the decline and achieve negative targets that reach 75.60$.
Therefore, the bearish bias will be suggested for today, noting that breaching 78.25$ followed by 78.80$ levels will stop the negative scenario and lead the price to resume the main bullish track again.
The expected trading range for today is between 76.00$ support and 79.00$ resistance
Trend forecast: Bearish
The EURUSD price provided additional positive trades yesterday to test the EMA50, noticing that stochastic continues to lose the positive momentum, which supports the chances of bouncing bearishly to resume the main bearish trend, waiting to break 1.0220$ level to confirm rallying towards 1.0100$ as a next main target.
Holding below 1.0325$ is important to the continuation of the expected decline, as breaching it will lead the price to achieve more gains that reach 1.0455$ as a next positive station.
The expected trading range for today is between 1.0210$ support and 1.0360$ resistance
Trend forecast: Bearish
Gold price returns to the red early Wednesday as buyers switch to the sidelines, awaiting the US Consumer Price Index (CPI) data release for further insights on the Federal Reserve’s (Fed) interest rate path.
Gold price reverses a part of the previous day’s rebound as sellers continue to lurk above $2,675. The US Dollar (USD) and the US Treasury bond yields remain subdued so far this Wednesday, unable to lend support to the bright metal. Traders refrain from placing fresh bets on Gold price while cashing on the recent long positions heading into the US CPI test, especially after softer-than-expected Producer Price Index (PPI) readings.
Data published on Tuesday showed that the US annual PPI rose 3.3% in December, missing the expected 3.4% growth, while the core PPI inflation rose to 3.5% year-on-year (YoY) in the same period, compared to the market forecast of 3.8%. Monthly figures also disappointed. Despite the softer data, markets have fully priced in a rate cut pause at the Fed’s policy meeting later this month.
Therefore, the stakes are high for the US CPI report as it could alter the market’s pricing of the Fed rate cut outlook this year. Traders have scaled back their bets to only one Fed rate cut in 2025 from two predicted in December last year, according to the CME Group’s FedWatch Tool, following the strong December US Nonfarm Payrolls (NFP) data.
The hawkish Fed bets are backed by the premise that US President-elect Donald Trump, set to begin his second term next week, will likely fuel inflation with his protectionist policies.
Economists expect the headline US CPI to rise 2.9% YoY in December after increasing 2.7% in November. The annual core CPI inflation is seen steady at 3.3% in the reported period. The monthly CPI inflation will likely remain at 0.3%, while the core figure is set to ease slightly to 0.2% in December.
A hotter-than-expected US CPI report could affirm expectations of just one Fed rate cut this year or prompt markets to price out any easing. This could trigger a fresh sell-off in the non-interest-bearing Gold price. Meanwhile, disappointing CPI figures could provide extra legs to the ongoing bullish momentum.
Nothing changes for Gold price from a short-term technical perspective, as buyers have entered a bullish consolidation phase following last week’s symmetrical triangle breakout.
The 14-day Relative Strength Index (RSI) continues to hold well above the midline, currently near 56, suggesting that Gold price remains a ‘buy-the-dips’ trade in the coming days.
Gold price needs to find a sustained break above the $2,675 barrier on the way to the $2,700 barrier to regain upside traction.
Daily candlestick closing above that level is critical to extending the uptrend toward the December 12 high of $2,726.
Alternatively, strong support is located at the January 13 low of $2,656, below which sellers must crack the $2,640 demand area.
That zone is the confluence of the 21-day Simple Moving Average (SMA), 50-day SMA, 100-SMA and the triangle convergence, making it a powerful support.
If the downside momentum accelerates, the January 6 low of $2,615 could come to buyers’ rescue.
Inflationary or deflationary tendencies are measured by periodically summing the prices of a basket of representative goods and services and presenting the data as The Consumer Price Index (CPI). CPI data is compiled on a monthly basis and released by the US Department of Labor Statistics. The YoY reading compares the prices of goods in the reference month to the same month a year earlier.The CPI is a key indicator to measure inflation and changes in purchasing trends. Generally speaking, a high reading is seen as bullish for the US Dollar (USD), while a low reading is seen as bearish.

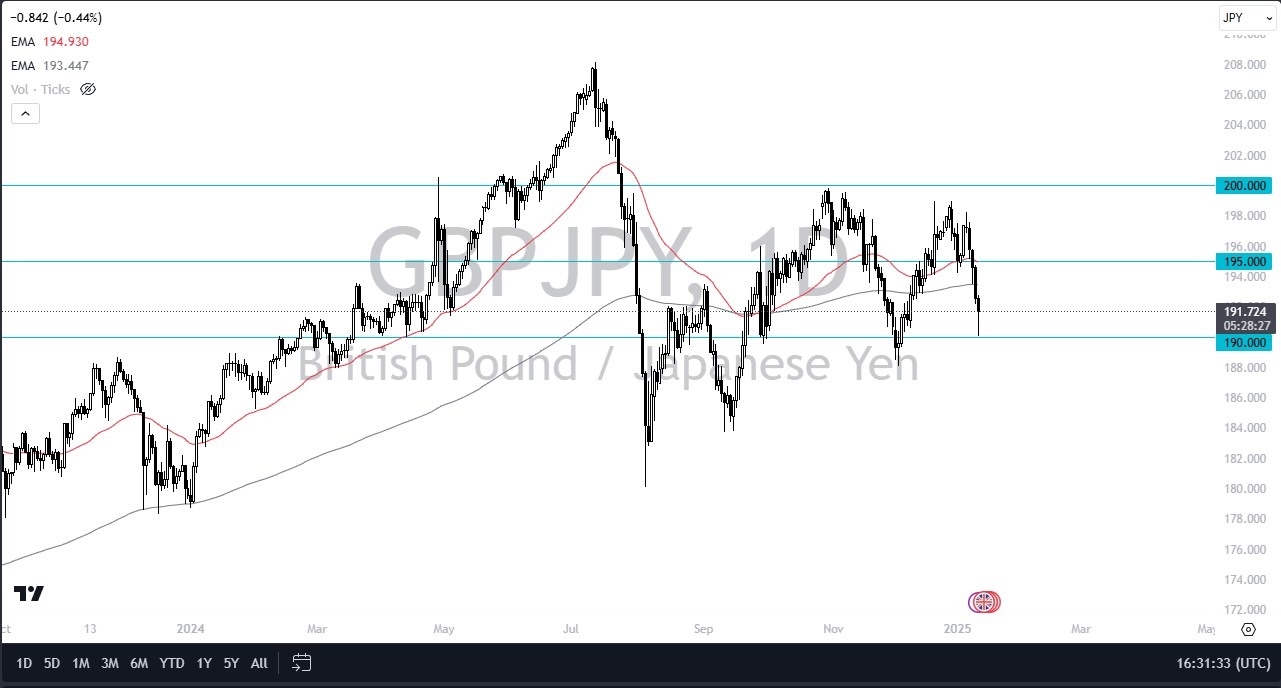
The technical analysis for this GBP/JPY pair is quite interesting, considering that the market has just hit a major floor, and bounced quite significantly. Ultimately, I do think that this pair could recover, but we are going to need to see the British pound recover against the US dollar as well. I don’t know if that happens, but we have fallen so hard that it does make a certain amount of sense that we recover here. All things being equal, this is a market that I think will continue to bounce around the ¥190 level if we do fall, because I think it’s an area that has been extraordinarily important. However, with the mess that the United Kingdom is currently in, I think that if you are looking to short the Japanese yen, it’s probably easier to do it with other currencies.
If we were to break down below the ¥190 level, then we could go looking to the ¥189 level, perhaps even the ¥185 level after that. While there is a short-term “play the bounce” type of trade here, you have to be extraordinarily nimble to be able to profit from this as I think you are certainly going to find easier ways to short the Japanese yen.
Begin trading our daily forecasts and analysis. Here is a list of Forex brokers in Japan to work with.
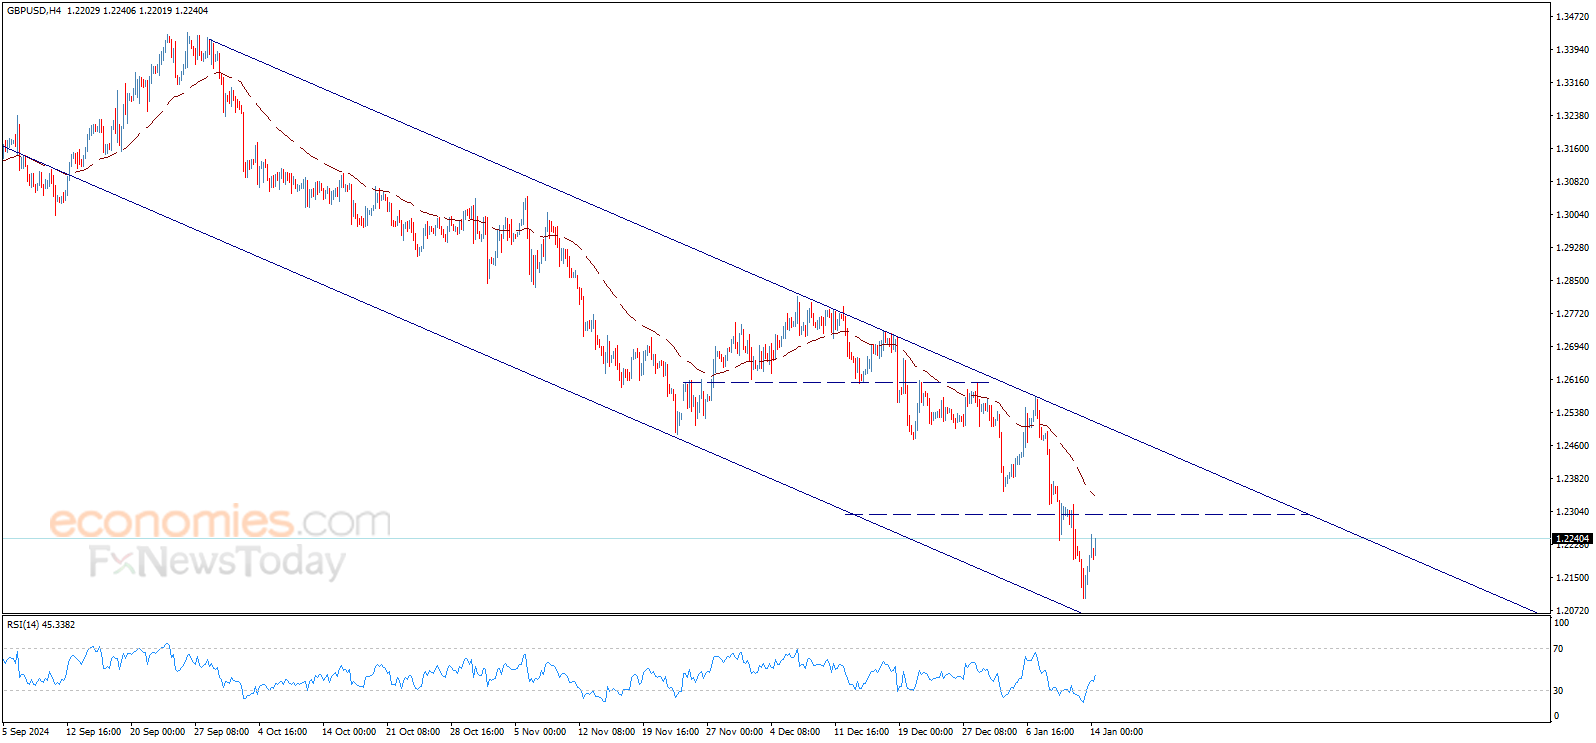
The GBPUSD price shows additional positive trades to move above 1.2200$, waiting to get negative motive that pushes the price to resume the main bearish trend, which its next main target located at 1.2045$.
We remind you that breaking 1.2180$ will ease the mission to achieve the expected decline, while holding below 1.2300$ represents major condition to the continuation of the bearish trend.
The expected trading range for today is between 1.2120$ support and 1.2290$ resistance
Trend forecast: Bearish
Over the last five sessions, the pound has lost enough ground to push the GBP/USD down by approximately 3%. The price is now at a critical support level, primarily due to growing uncertainty stemming from the large-scale bond sell-off in the United Kingdom.
The UK has experienced a significant sell-off of fixed-income securities, attributed to slow economic growth and high levels of government debt. As a result, 10-year bond yields, which move inversely to the price of the bonds themselves, have climbed to 4.94%, a level not seen since the 2008 financial crisis.

Source: TradingEconomics
Although higher bond yields might seem attractive for international investment, the current context paints a different picture. High yields are perceived as a hindrance to controlling the government’s growing debt levels, which could destabilize plans announced in October 2024 involving tax increases and debt strategies aimed at boosting stable economic growth.
In this scenario, the UK government is not directly responsible for the rising borrowing costs (increased government bond yields), but the situation could further erode confidence in the pound, exerting additional bearish pressure on the GBP/USD. For now, the market views the dollar as a safer option compared to the debt issues plaguing the UK.
The GBP/USD has logged six consecutive sessions of losses, reflecting the pound’s significant weakness. The bearish trend has notably accelerated in the short term.

Source: StoneX, Tradingview
Key Levels:
Xerox Holdings’ stock price (XRX) inched higher in the intraday levels, buoyed by positive signals from the RSI as the stock tries to correct the main downward trend while trading alongside the negative trend line in the medium term, with negative pressure due to trading below the 50-day SMA.
Therefore we expect the stock to return lower, targeting the support of $8.04 anew, provided it settles below the resistance of $9.50.
Trend forecast for today: Likely Bearish