The main category of Forex News.
You can use the search box below to find what you need.
[wd_asp id=1]
The main category of Forex News.
You can use the search box below to find what you need.
[wd_asp id=1]
GBP/USD is edging higher after cooler-than-expected inflation helped pull gilt yields lower
UK CPI unexpectedly fell to 2.5% YoY in December, down from 2.6% and below forecasts of 2.7%. Meanwhile, service sector inflation, which the Bank of England is watching closely, cooled by more than expected to 4.4%, well below the 4.8% predicted and down from 5% in November. Sticky service sector inflation has hindered the BoE from cutting interest rates further.
Following the data the market has ramped up BoE rate cut expectations, adding 12 basis points to bets for 2025 cuts, which are now seen at 49 basis points across the year. This is still short of the central bank’s forecast for 4 rate cuts this year.
Usually, with rising rate cut expectations, the pound would fall. However, today’s data has also pulled guilty yields sharply lower, dropping by around 9 basis points on the 2-year bond, the most sensitive to Bank of England policy, which is helping to support the pound.
The data is a step in the right direction but it doesn’t mean that the UK is out of the woods just yet, particularly given that a recent survey by the British Retail Consortium shows that 2/3 of retailers will raise prices in response to higher employer Social Security costs from the budget which bodes poorly for progress in disinflation outlook. Meanwhile, the same survey of chief financial officers and finance directors at 52 major retailers found that around half plan to reduce staff hours and headcount.
There are also growing worries about UK growth, which has been on a downward trajectory since labour came to power in July. This, combined with the prospect of sticky inflation, means a stagflationary outlook is a very real problem. UK GDP data is due tomorrow and will provide further clues about the health of the UK economy.
Attention also turns to the US CPI, which is due later today and is expected to rise to 2.9% from 2.7%. What inflation could further dampen rate cut expectations, boosting the USD and pulling GBP USD lower?
GBP/USD trended lower from 1.34 to a low of 1.21 at the start of the week. The price recovered from 1.21 and trades back above the 1.22 level, bringing the RSI out of oversold territory. The long-term downtrend remains intact, but the hammer candlestick and the long lower wicks on candles this week suggest that the bottom could be in, and a bullish reversal could be in the cards.
Buyers will look to extend gains above 1.23, the April low, before focusing on 1.25, the December low into focus.
Sellers will need to take out the 1.21 low to extend losses to 1.2050, the 2023 low, and 1.20, the psychological level.

USD/JPY is falling amid a stronger yen following hawkish BoJ’s Ueda remarks. However, those gains could be short-lived ahead of US inflation data.
Governor Ueda reiterated the central bank’s commitment to raising borrowing costs if the economy continues to improve. His comments followed days of the OJ deputy governor him me know on Tuesday. The end raise as markets priced in the possibility of a rate hike at next weeks meeting.
Comments from Finance Minister Kato, who revived concerns about potential government intervention in the FX markets, also supported the yen.
Attention is now turning to US inflation data, which is expected to show that CPI increased 2.9% from 2.7% in November, marking its fifth straight monthly increase and moving further from the Fed’s 2% target.
Worries about hot inflation are already rampant in the market, with treasury yields elevated. I mean, the resilient U.S. economy and ahead of Trump’s administration. Trump is expected to implement inflationary policies.
Hotter-than-expected inflation could see the market further resist Fed rate cut bets. Currently, the market sees just one rate shot right at the end of this year. This could see USD/JPY recover higher above 158.
After a strong run-up from the 148.65 low, USD/JPY has been consolidating just below 158. The price is testing support at the 78.6% fib retracement at 157.10, as the MACD shows a bearish cross-over.
Should sellers meaningfully break below 157.10 and 156.75 the November high, a deeper selloff towards 155 round number and 152.40 the 61.8% fib level could be on the cards.
Should the 157.10-156.75 support zone hold, buyers will look to extend gains above 168.80, the 2025 high, towards 160 and 162, the 2024 high.

Silver (XAG/USD) attracts some buyers for the second straight day and climbs back above the $30.00 psychological mark during the first half of the European session on Wednesday. The technical setup, however, warrants some caution for bullish traders and before positioning for any further appreciating move.
The recent pullback from the vicinity of the $35.00 mark, or a multi-year peak touched in October, has been along a descending channel, which points to a well-established downtrend. Moreover, oscillators on the daily chart – though have recovered from bearish territory – are yet to gain positive traction. Hence, any subsequent move up might continue to confront some hurdle near the top boundary of the said channel, around the $30.45 region.
This is followed by the 100-day Simple Moving Average (SMA), currently pegged ahead of the $31.00 round figure. A sustained strength beyond the latter will suggest that a nearly three-month-old corrective decline has run its course and pave the way for further gains. The XAG/USD might then accelerate the positive move towards the $31.70 intermediate hurdle en route to the $32.00 mark and the December swing high, around the $32.30-$32.35 region.
On the flip side, the weekly trough, around mid-$29.00s touched on Monday, could offer immediate support. A convincing break below will reaffirm the negative setup and make the XAG/USD vulnerable to weaken further below the $29.00 mark, towards retesting the $28.75-$28.70 support, or a multi-month low touched in December. Some follow-through selling will be seen as a fresh trigger for bearish traders and pave the way for a further depreciating move.
Silver is a precious metal highly traded among investors. It has been historically used as a store of value and a medium of exchange. Although less popular than Gold, traders may turn to Silver to diversify their investment portfolio, for its intrinsic value or as a potential hedge during high-inflation periods. Investors can buy physical Silver, in coins or in bars, or trade it through vehicles such as Exchange Traded Funds, which track its price on international markets.
Silver prices can move due to a wide range of factors. Geopolitical instability or fears of a deep recession can make Silver price escalate due to its safe-haven status, although to a lesser extent than Gold’s. As a yieldless asset, Silver tends to rise with lower interest rates. Its moves also depend on how the US Dollar (USD) behaves as the asset is priced in dollars (XAG/USD). A strong Dollar tends to keep the price of Silver at bay, whereas a weaker Dollar is likely to propel prices up. Other factors such as investment demand, mining supply – Silver is much more abundant than Gold – and recycling rates can also affect prices.
Silver is widely used in industry, particularly in sectors such as electronics or solar energy, as it has one of the highest electric conductivity of all metals – more than Copper and Gold. A surge in demand can increase prices, while a decline tends to lower them. Dynamics in the US, Chinese and Indian economies can also contribute to price swings: for the US and particularly China, their big industrial sectors use Silver in various processes; in India, consumers’ demand for the precious metal for jewellery also plays a key role in setting prices.
Silver prices tend to follow Gold’s moves. When Gold prices rise, Silver typically follows suit, as their status as safe-haven assets is similar. The Gold/Silver ratio, which shows the number of ounces of Silver needed to equal the value of one ounce of Gold, may help to determine the relative valuation between both metals. Some investors may consider a high ratio as an indicator that Silver is undervalued, or Gold is overvalued. On the contrary, a low ratio might suggest that Gold is undervalued relative to Silver.
The GBP/USD forecast shows a bright day for the pound despite downbeat UK inflation figures. A decline in UK yields has relieved the currency after its recent plunge. On the other hand, the dollar halted its rally after soft wholesale inflation data. Moreover, traders eagerly await the CPI report for more clues on future Fed moves.
-Are you looking for tips for forex trading? Check out the details-
Data on Wednesday revealed that UK consumer inflation increased by 2.5% annually. This was a smaller number than the forecast of 2.6%. As a result, market participants increased the likelihood of a Feb BoE rate cut from 60% to 80%.
The pound dropped in response, but only for a while. The increase in rate-cut bets also led to a drop in UK yields, which have rallied in recent weeks. The rally had caused uncertainty about UK finances and the economy, hurting the pound. Therefore, Wednesday’s pullback came as a welcome surprise, boosting sterling.
The pound also got support from a weak dollar. The greenback eased on Tuesday after cooler-than-expected wholesale inflation data. However, all focus is on the upcoming US consumer inflation report. Economists expect inflation to increase by 2.6% annually, holding from the previous month. A surprising number will cause volatility by shifting the outlook for Fed rate cuts.
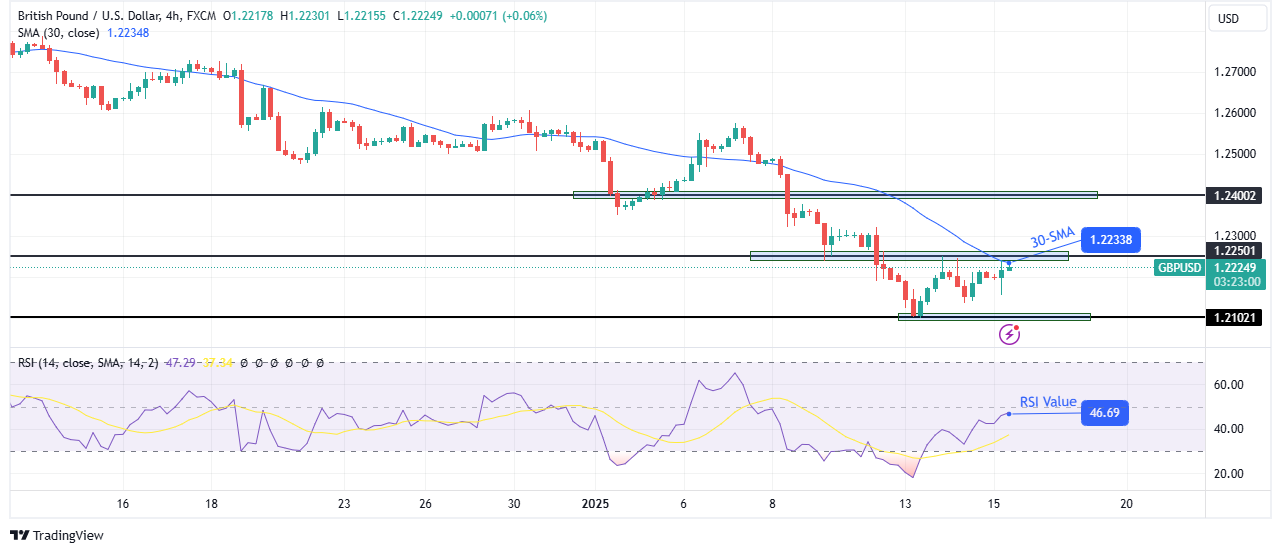
On the technical side, the GBP/USD price has rebounded to retest the 30-SMA resistance after making a new low at the 1.2102 support level. At the same time, the price has revisited the 1.2250 resistance level. However, the downtrend remains intact as the price trades below the 30-SMA with the RSI in bearish territory.
-Are you looking for crypto exchanges? Check our detailed guide-
The rebound has been a corrective move, with both bears and bulls showing some strength. However, the price must make an impulsive leg for the price to start trending. Therefore, if bears are ready to resume the downtrend, the price will make a new swing low below the 1.2102 support level.
On the other hand, an impulsive leg to break above the 30-SMA would signal a shift in sentiment that would likely lead to a bullish reversal.
Looking to trade forex now? Invest at eToro!
67% of retail investor accounts lose money when trading CFDs with this provider. You should consider whether you can afford to take the high risk of losing your money.
Brent oil price attempted to rise but it declines again to keep the correctional bearish scenario active for today, waiting to visit 79.404 as a first station, which breaking it represents the key to extend the bearish wave towards 77.83$ areas.
Therefore, our bearish overview will remain valid and active unless breaching 81.00$ and holding above it.
The expected trading range for today is between 78.40$ support and 81.40$ resistance.
Trend forecast: Bearish
GBP/USD is edging higher after cooler-than-expected inflation helped pull gilt yields lower
UK CPI unexpectedly fell to 2.5% YoY in December, down from 2.6% and below forecasts of 2.7%. Meanwhile, service sector inflation, which the Bank of England is watching closely, cooled by more than expected to 4.4%, well below the 4.8% predicted and down from 5% in November. Sticky service sector inflation has hindered the BoE from cutting interest rates further.
Following the data the market has ramped up BoE rate cut expectations, adding 12 basis points to bets for 2025 cuts, which are now seen at 49 basis points across the year. This is still short of the central bank’s forecast for 4 rate cuts this year.
Usually, with rising rate cut expectations, the pound would fall. However, today’s data has also pulled guilty yields sharply lower, dropping by around 9 basis points on the 2-year bond, the most sensitive to Bank of England policy, which is helping to support the pound.
The data is a step in the right direction but it doesn’t mean that the UK is out of the woods just yet, particularly given that a recent survey by the British Retail Consortium shows that 2/3 of retailers will raise prices in response to higher employer Social Security costs from the budget which bodes poorly for progress in disinflation outlook. Meanwhile, the same survey of chief financial officers and finance directors at 52 major retailers found that around half plan to reduce staff hours and headcount.
There are also growing worries about UK growth, which has been on a downward trajectory since labour came to power in July. This, combined with the prospect of sticky inflation, means a stagflationary outlook is a very real problem. UK GDP data is due tomorrow and will provide further clues about the health of the UK economy.
Attention also turns to the US CPI, which is due later today and is expected to rise to 2.9% from 2.7%. What inflation could further dampen rate cut expectations, boosting the USD and pulling GBP USD lower?
GBP/USD trended lower from 1.34 to a low of 1.21 at the start of the week. The price recovered from 1.21 and trades back above the 1.22 level, bringing the RSI out of oversold territory. The long-term downtrend remains intact, but the hammer candlestick and the long lower wicks on candles this week suggest that the bottom could be in, and a bullish reversal could be in the cards.
Buyers will look to extend gains above 1.23, the April low, before focusing on 1.25, the December low into focus.
Sellers will need to take out the 1.21 low to extend losses to 1.2050, the 2023 low, and 1.20, the psychological level.

USD/JPY is falling amid a stronger yen following hawkish BoJ’s Ueda remarks. However, those gains could be short-lived ahead of US inflation data.
Governor Ueda reiterated the central bank’s commitment to raising borrowing costs if the economy continues to improve. His comments followed days of the OJ deputy governor him me know on Tuesday. The end raise as markets priced in the possibility of a rate hike at next weeks meeting.
Comments from Finance Minister Kato, who revived concerns about potential government intervention in the FX markets, also supported the yen.
Attention is now turning to US inflation data, which is expected to show that CPI increased 2.9% from 2.7% in November, marking its fifth straight monthly increase and moving further from the Fed’s 2% target.
Worries about hot inflation are already rampant in the market, with treasury yields elevated. I mean, the resilient U.S. economy and ahead of Trump’s administration. Trump is expected to implement inflationary policies.
Hotter-than-expected inflation could see the market further resist Fed rate cut bets. Currently, the market sees just one rate shot right at the end of this year. This could see USD/JPY recover higher above 158.
After a strong run-up from the 148.65 low, USD/JPY has been consolidating just below 158. The price is testing support at the 78.6% fib retracement at 157.10, as the MACD shows a bearish cross-over.
Should sellers meaningfully break below 157.10 and 156.75 the November high, a deeper selloff towards 155 round number and 152.40 the 61.8% fib level could be on the cards.
Should the 157.10-156.75 support zone hold, buyers will look to extend gains above 168.80, the 2025 high, towards 160 and 162, the 2024 high.

A key support zone starts is indicated around the confluence of several indicators. It starts with the 50% retracement at 3.67 and includes the 20-Day MA around 3.66. However, the more significant price level is 3.64. That was the peak in 2023, and it created a lower swing high for the downtrend and subsequently led to a decline to the 2024 trend low of 1.52.
If natural gas can continue to trade above the bottom of the range at 3.64 it looks to have a good chance of retaining the near-term rising trend structure. Otherwise, a sustained decline below 3.64 heads to test support of the 50-Day MA at 3.29. If that level fails to lead to a bullish reversal, then 3.02 becomes a target, followed by the top boundary line for a large symmetrical triangle formation.
Both Monday’s rally and the prior swing high at 4.20 from December 30 found resistance around the top line of the larger trend channel (solid blue). Therefore, that top line continues to mark areas where resistance may be seen if natural gas is able to again strengthen and test recent highs. There is a pattern like a bearish wedge when considering the rising lower solid trendline that coincides with the January 3 swing low at 3.33. The top line of the wedge would be the dashed blue line connecting the 3.02 swing high.
It is interesting to note that Monday’s advance completed a rising ABCD pattern (purple) at 4.33 before strong resistance was encountered following the 4.37 high. A quick bearish intraday reversal and weak daily close followed. The ABCD pattern is measuring price symmetry of the two upswings in the pattern. The AB leg is the first leg up and the CD leg is the second. Once the two swings show the same appreciation in price, the potential for a pivot, resistance in this case, may improve.
For a look at all of today’s economic events, check out our economic calendar.
According to recent trades, investors in the $13 trillion high-grade corporate bond market are focusing on an unprecedented divergence between expected US and European monetary policy paths. US Treasury yields are likely to outperform their European counterparts as the European Central Bank is still expected to deliver several interest rates cuts this year, while the Federal Reserve is seen keeping US interest rates higher for longer, according to some fund managers.

This divergence has not been seen early in the year for as long as Bloomberg has tracked interest rate expectations for the US Federal Reserve, the European Central Bank, and the Bank of England. The only notable divergence at the beginning of the year was recorded in 2023, when traders were pricing in rising interest rates – a backdrop typically associated with falling bond prices – rather than cuts.
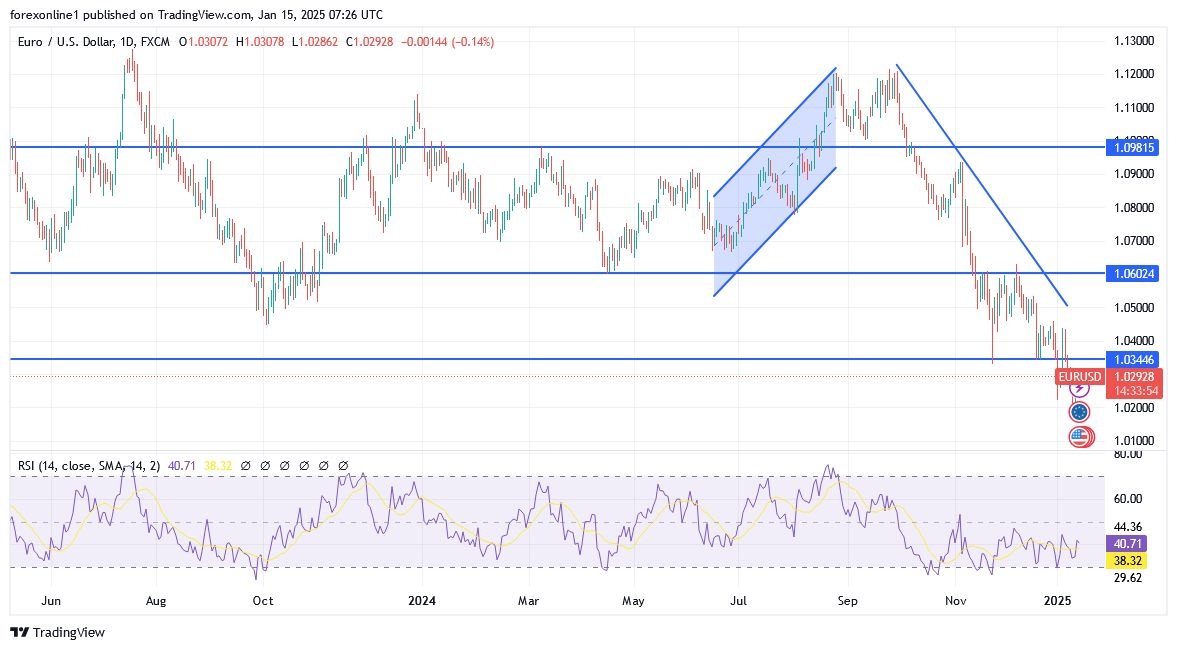
Also, the divergence between the policies of the European Central Bank and the Federal Reserve weighs heavily on the euro-dollar exchange rate.
Investors and markets expect the European Central Bank to cut interest rates by 25 basis points more than three times by the end of 2025, even after they lowered their expectations in recent days. In contrast, they expect only one cut from the US Federal Reserve after US jobs data showed that the US labor market remains strong. According to officials, the European Central Bank should continue to cut interest rates, regardless of what the US Federal Reserve does.
In general, market expectations for central bank cuts can certainly change quickly with the release of new economic data. At the beginning of December 2024, traders were pricing in more than three cuts by the Federal Reserve in 2025.
Dear follower of the TradersUp website, the euro-dollar is still on its way to parity. So, be careful, do not take risks, and always monitor the factors affecting the performance of the currency pair.
Dear reader, there is no change in my technical outlook for the EUR/USD pair. The overall trend remains bearish, and the recent rebound is temporary. Investors are awaiting important US economic events. Currently, the closest support levels for the euro dollar are 1.0220, 1.0170, and 1.0080. technically, these levels are sufficient to push technical indicators towards oversold levels. The Relative Strength Index and the MACD are in the bearish zone. Furthermore, we still recommend selling the euro dollar at every opportunity.
Ready to trade our daily Forex forecast? Here’s a list of some of the top forex brokers in Europe to check out.
Ethereum price (ETHUSD) provided additional positive trades to test 3222.00$ level, noticing that the price is attempting to breach this level to hint stopping the bearish correction that dominated the recent trades and regain the main bullish trend again, on its way to achieve gains that start by testing 3425.50$ level.
Therefore, the bullish bias will be expected for today, noting that failing to confirming breaching 3222.00$ will stop the bullish wave and push the price to decline again.
The expected trading range for today is between 3130.00$ support and 3400.00$ resistance.
Trend forecast: Bullish
Platinum price lost the positive momentum yesterday to force it to form temporary negative rebound and notice its stability near the additional support 935.00$, to settle above it and reinforce the chances of renewing the bullish attempts again.
Also, 920.00 level continues to form major support against the current trades, allowing us to wait to gather the positive momentum again to manage to surpass the MA55 at 955.00$ followed by extending trades towards the next main target at 983.00$.
The expected trading range for today is between 930.00$ and 955.00$
Trend forecast: Bullish
Silver price (XAG/USD) retraces its recent gains from the previous session, trading around $29.80 per barrel during the Asian hours on Wednesday. The price of the safe-haven Silver faces challenges due to risk-on market sentiment following reports about US President-elect Donald Trump’s economic team considering a gradual increase in import tariffs boosted investor confidence.
Bloomberg reported on Monday that Trump’s incoming administration is evaluating a phased approach to implementing tariffs, aiming to prevent a sharp rise in inflation while managing trade policy adjustments.
The non-yielding Silver faces challenges as the recent US labor market figures for December, which is expected to support the US Federal Reserve’s (Fed) decision to maintain interest rates at current levels in January.
Moreover, reinforced hawkish sentiment surrounding the Fed has sparked a rise in US Treasury yields. Rising yields boosted the US Dollar to recent highs, making Silver more expensive for buyers using foreign currencies and dampening Silver demand.
However, the Greenback corrects downwards following the disappointing US December Producer Price Index (PPI) data. Market participants will keep an eye on the US Consumer Price Index (CPI) inflation data, which is due later on Wednesday.
The demand for Silver could increase following China’s recent stimulus measures. As the world’s largest consumer of metals, any improvement in China’s economic conditions could significantly boost the industrial use of Silver.
People’s Bank of China (PBOC) Governor Pan Gongsheng stated on Monday that “interest rate and reserve requirement ratio (RRR) tools will be utilized to maintain ample liquidity.” Gongsheng reaffirmed China’s plans to increase the fiscal deficit and emphasized that China will continue to be a driving force for the global economy.
Silver is a precious metal highly traded among investors. It has been historically used as a store of value and a medium of exchange. Although less popular than Gold, traders may turn to Silver to diversify their investment portfolio, for its intrinsic value or as a potential hedge during high-inflation periods. Investors can buy physical Silver, in coins or in bars, or trade it through vehicles such as Exchange Traded Funds, which track its price on international markets.
Silver prices can move due to a wide range of factors. Geopolitical instability or fears of a deep recession can make Silver price escalate due to its safe-haven status, although to a lesser extent than Gold’s. As a yieldless asset, Silver tends to rise with lower interest rates. Its moves also depend on how the US Dollar (USD) behaves as the asset is priced in dollars (XAG/USD). A strong Dollar tends to keep the price of Silver at bay, whereas a weaker Dollar is likely to propel prices up. Other factors such as investment demand, mining supply – Silver is much more abundant than Gold – and recycling rates can also affect prices.
Silver is widely used in industry, particularly in sectors such as electronics or solar energy, as it has one of the highest electric conductivity of all metals – more than Copper and Gold. A surge in demand can increase prices, while a decline tends to lower them. Dynamics in the US, Chinese and Indian economies can also contribute to price swings: for the US and particularly China, their big industrial sectors use Silver in various processes; in India, consumers’ demand for the precious metal for jewellery also plays a key role in setting prices.
Silver prices tend to follow Gold’s moves. When Gold prices rise, Silver typically follows suit, as their status as safe-haven assets is similar. The Gold/Silver ratio, which shows the number of ounces of Silver needed to equal the value of one ounce of Gold, may help to determine the relative valuation between both metals. Some investors may consider a high ratio as an indicator that Silver is undervalued, or Gold is overvalued. On the contrary, a low ratio might suggest that Gold is undervalued relative to Silver.