The main category of Forex News.
You can use the search box below to find what you need.
[wd_asp id=1]
The main category of Forex News.
You can use the search box below to find what you need.
[wd_asp id=1]
The US Dollar losses some ground against the Japanese Yen on Monday amid a bank holiday in Japan as the USD/JPY shrugged off a rise in the US 10-year T-note yield. At the time of writing, the pair trades at 157.54, down by 0.11%.
The USD/JPY daily chart remains upward biased, but faces strong resistance at 158.00, amid fears that the Bank of Japan (BoJ) might intervene in the Forex markets. Momentum favors further upside, after the 50-day Simple Moving Average (SMA) at 154.58 crossed above the 200-day SMA, forming a ‘golden cross,’ implying that further upside is seen.
For a bullish continuation, the USD/JPY first ceiling level would be the 158.00 figure followed by the January 10 peak hit following US NFP data on Friday at 158.88. A breach of the latter will expose 159.00.
If USD/JPY tumbles below Tenkan-sen, the next support would be the January 6 low of 156.24, followed by the December 31 pivot low of 156.02.
The table below shows the percentage change of Japanese Yen (JPY) against listed major currencies today. Japanese Yen was the strongest against the US Dollar.
| USD | EUR | GBP | JPY | CAD | AUD | NZD | CHF | |
|---|---|---|---|---|---|---|---|---|
| USD | -0.25% | -0.20% | -0.11% | -0.13% | -0.23% | -0.31% | -0.16% | |
| EUR | 0.25% | 0.07% | 0.11% | 0.13% | 0.02% | -0.06% | 0.13% | |
| GBP | 0.20% | -0.07% | 0.10% | 0.07% | -0.04% | -0.13% | 0.04% | |
| JPY | 0.11% | -0.11% | -0.10% | 0.06% | -0.15% | -0.22% | -0.04% | |
| CAD | 0.13% | -0.13% | -0.07% | -0.06% | -0.14% | -0.17% | 0.01% | |
| AUD | 0.23% | -0.02% | 0.04% | 0.15% | 0.14% | -0.08% | 0.08% | |
| NZD | 0.31% | 0.06% | 0.13% | 0.22% | 0.17% | 0.08% | 0.17% | |
| CHF | 0.16% | -0.13% | -0.04% | 0.04% | -0.01% | -0.08% | -0.17% |
The heat map shows percentage changes of major currencies against each other. The base currency is picked from the left column, while the quote currency is picked from the top row. For example, if you pick the Japanese Yen from the left column and move along the horizontal line to the US Dollar, the percentage change displayed in the box will represent JPY (base)/USD (quote).
The EUR/USD has been struggling to find its footing, slipping to a new multi-year low today of just below the 1.0200 handle. The pair remains on a downward trajectory, now eyeing a potential fourth consecutive monthly decline. The bearish momentum has been fuelled by a surging US dollar, which has been supported on the back of stronger labour market data and expectations inflationary pressures will return under Trump. Combined with weak economic data from the Eurozone and China, this is all helping to keep the EUR/USD forecast and trend bearish.
The greenback continues to dominate, supported by rising US bond yields and robust economic data. Investors have been repricing US interest rates higher, driven by persistent inflation concerns and unexpectedly strong labour market data. December’s non-farm payrolls report showed remarkable resilience, with job gains significantly outpacing expectations. While revisions shaved 8,000 jobs off previous months’ totals, the unemployment rate dipped to 4.1% from 4.2%, reinforcing the case for a prolonged pause in Federal Reserve policy shifts. Wage growth, although steady, underscores a resilient labour market, adding to the dollar’s appeal.
As a result, US bond yields have climbed further, with the benchmark 10-year yield nearing its October highs of 5.02%. This upward trajectory in yields continues to attract capital into the US dollar, keeping the EUR/USD forecast under bearish pressure.
Of course, it is not just the euro that the dollar is rising against. Rising bond yields and diminishing hopes for further US rate cuts have given the Dollar Index a solid boost, pushing it higher for the seventh straight week and setting it up for a fourth consecutive monthly gain. On Friday, US 30-year bond yields hit 5%, inching closer to October’s peak of 5.178%, while the 10-year yields aren’t far behind, hovering near 4.80%.
It’s not just the US seeing this trend. In Europe, bond yields are climbing steadily, with German, French, Spanish, and Italian yields all extending their upward momentum. Over in the UK, the 10-year yield has surged past last year’s high of 4.755%, touching levels not seen since the 2008 financial crisis at nearly 5%. Even Japan has joined the mix, with its 10-year yields hitting 1.20%, their highest level since May 2011, although still relatively modest.
The takeaway? Bond yields are rising across the board, fuelled by resilient US economic data and persistent global inflation—except for China. With higher yields offering attractive returns, investors may hesitate to buy overbought growth stocks and government debt is proving a tempting alternative. This is an additional bearish factor for risk-sensitive currencies like the euro.
All eyes will be on the US Consumer Price Index (CPI) release this Wednesday. Any indication of stubborn inflation could dash any remaining hopes of a Fed rate cut in the first half of the year, further bolstering the dollar. Conversely, a surprisingly weak CPI print could offer the Euro some breathing room, although a significant shift in market sentiment seems unlikely without a major downside surprise.
Later in the week, Friday’s Chinese GDP release, along with retail sales and industrial production data, will also be in the spotlight. The Chinese economy’s sluggish performance has already impacted global markets, with weaker growth dampening demand for European exports. Any further signs of economic slowdown in China could exacerbate concerns about the Eurozone’s growth prospects, amplifying the bearish EUR/USD forecast.

Source: TradingView.com
The near-term outlook for EUR/USD remains tilted to the downside, with the pair likely to test and possibly break below the parity (1.000) level if data this week favours the dollar, or we see further rising in US yields. Persistent geopolitical tensions and weak economic performance in the Eurozone only add to the challenges for the Euro. Traders should stay cautious and watch for significant shifts in market sentiment, particularly around Wednesday’s CPI data. While the dollar’s bullish momentum shows no immediate signs of slowing, a potential inflection point could arise if inflation surprises to the downside or Chinese data beats expectations, offering a glimmer of hope for the Euro.
In terms of resistance levels to watch, 1.0300-1.0340 now marks a key resistance zone, having previously served as support. The bearish trend line comes in just above this zone, too. While below these levels, the path of least resistance on the EUR/USD is unambiguously bearish.
— Written by Fawad Razaqzada, Market Analyst
Follow Fawad on Twitter @Trader_F_R
Certainly, today’s bearish reaction to new highs seems to lower the chance for a new trend high in the short term. At least until after there is a test of lower support levels. There are a few things to be aware of. Notice that resistance was seen around the confluence of several technical price targets, beginning with 4.33. A rising ABCD pattern (purple) reached its initial target from the pattern and therefore identified a possible pivot level. So far, the market reaction confirms this.
In addition, to completing a target for the ABCD pattern today, a breakout above the top trendline of a rising channel also triggered on the way to 4.37. Resistance was seen around that line on the most recent swing high of 4.20. So, today’s price action shows a failed breakout of the channel. Once a failure occurs, the possibility of a swing in the other direction increases. That is what is being shown so far.
The first lower trend support area is around the 20-Day MA, now at 3.62, along with an internal uptrend line. Moreover, the 20-Day line can be combined with the 50% retracement at 3.67 and the 2023 swing high of 3.64. The 2023 high has some significance and therefore a solid chance of being tested as support during a correction. Having the 20-Day line and 50% retracement nearby increases the chance for signs of support.
For a look at all of today’s economic events, check out our economic calendar.
The EUR/USD has been struggling to find its footing, slipping to a new multi-year low today of just below the 1.0200 handle. The pair remains on a downward trajectory, now eyeing a potential fourth consecutive monthly decline. The bearish momentum has been fuelled by a surging US dollar, which has been supported on the back of stronger labour market data and expectations inflationary pressures will return under Trump. Combined with weak economic data from the Eurozone and China, this is all helping to keep the EUR/USD forecast and trend bearish.
The greenback continues to dominate, supported by rising US bond yields and robust economic data. Investors have been repricing US interest rates higher, driven by persistent inflation concerns and unexpectedly strong labour market data. December’s non-farm payrolls report showed remarkable resilience, with job gains significantly outpacing expectations. While revisions shaved 8,000 jobs off previous months’ totals, the unemployment rate dipped to 4.1% from 4.2%, reinforcing the case for a prolonged pause in Federal Reserve policy shifts. Wage growth, although steady, underscores a resilient labour market, adding to the dollar’s appeal.
As a result, US bond yields have climbed further, with the benchmark 10-year yield nearing its October highs of 5.02%. This upward trajectory in yields continues to attract capital into the US dollar, keeping the EUR/USD forecast under bearish pressure.
Of course, it is not just the euro that the dollar is rising against. Rising bond yields and diminishing hopes for further US rate cuts have given the Dollar Index a solid boost, pushing it higher for the seventh straight week and setting it up for a fourth consecutive monthly gain. On Friday, US 30-year bond yields hit 5%, inching closer to October’s peak of 5.178%, while the 10-year yields aren’t far behind, hovering near 4.80%.
It’s not just the US seeing this trend. In Europe, bond yields are climbing steadily, with German, French, Spanish, and Italian yields all extending their upward momentum. Over in the UK, the 10-year yield has surged past last year’s high of 4.755%, touching levels not seen since the 2008 financial crisis at nearly 5%. Even Japan has joined the mix, with its 10-year yields hitting 1.20%, their highest level since May 2011, although still relatively modest.
The takeaway? Bond yields are rising across the board, fuelled by resilient US economic data and persistent global inflation—except for China. With higher yields offering attractive returns, investors may hesitate to buy overbought growth stocks and government debt is proving a tempting alternative. This is an additional bearish factor for risk-sensitive currencies like the euro.
All eyes will be on the US Consumer Price Index (CPI) release this Wednesday. Any indication of stubborn inflation could dash any remaining hopes of a Fed rate cut in the first half of the year, further bolstering the dollar. Conversely, a surprisingly weak CPI print could offer the Euro some breathing room, although a significant shift in market sentiment seems unlikely without a major downside surprise.
Later in the week, Friday’s Chinese GDP release, along with retail sales and industrial production data, will also be in the spotlight. The Chinese economy’s sluggish performance has already impacted global markets, with weaker growth dampening demand for European exports. Any further signs of economic slowdown in China could exacerbate concerns about the Eurozone’s growth prospects, amplifying the bearish EUR/USD forecast.

Source: TradingView.com
The near-term outlook for EUR/USD remains tilted to the downside, with the pair likely to test and possibly break below the parity (1.000) level if data this week favours the dollar, or we see further rising in US yields. Persistent geopolitical tensions and weak economic performance in the Eurozone only add to the challenges for the Euro. Traders should stay cautious and watch for significant shifts in market sentiment, particularly around Wednesday’s CPI data. While the dollar’s bullish momentum shows no immediate signs of slowing, a potential inflection point could arise if inflation surprises to the downside or Chinese data beats expectations, offering a glimmer of hope for the Euro.
In terms of resistance levels to watch, 1.0300-1.0340 now marks a key resistance zone, having previously served as support. The bearish trend line comes in just above this zone, too. While below these levels, the path of least resistance on the EUR/USD is unambiguously bearish.
— Written by Fawad Razaqzada, Market Analyst
Follow Fawad on Twitter @Trader_F_R
Spot Gold is on the back foot on Monday amid persistent US Dollar’s (USD) demand. The XAU/USD hit a multi-week high of $2,697.88 on Friday, as a solid United States (US) monthly employment report spurred risk aversion. The Nonfarm Payrolls (NFP) report showed the country added 256,000 new jobs in December, while the Unemployment Rate edged lower to 4.1%. The figures were upbeat. Even further, Average Hourly Earnings rose by 3.9%, easing from the previous 4%. The combined headlines hint at an on-hold Federal Reserve (Fed) for longer.
Demand for safety equally benefited Gold and the Greenback at the end of the previous week, yet persistent USD demand finally took its toll on XAU/USD, now trading at around $2,665. In the absence of relevant macroeconomic data, the focus remained on sentiment, and stocks’ behaviour. Asian and European indexes closed in the red, while Wall Street trades mixed: only the Dow Jones Industrial Average trades in the green after collapsing on Friday, while the S&P500 and the Nasdaq Composite remain in the red.
Meanwhile, the focus this week will be on inflation. The United Kingdom (UK) and the US will release fresh Consumer Price Index (CPI) figures next Wednesday. Market participants will also be waiting for President-elect Donald Trump and tariffs updates.
From a technical point of view, the daily chart for the XAU/USD pair shows sellers have gained courage, yet at stepper decline is far from evident. The pair remains above all its moving averages, although a mildly bearish 20 Simple Moving Average (SMA) converges with a bullish 100 SMA at around $2,635. Technical indicators, in the meantime, turned sharply lower, yet remain within positive levels.
In the 4-hour chart, Gold is developing below its 20 SMA, which lost its bullish strength and provides resistance at around $2,672. The 100 and 200 SMAs, in the meantime, remain flat below the current level. Finally, technical indicators head firmly south, pressuring their midlines straight from overbought readings, suggesting the near-term slide could continue.
Support levels: 2,660.70 2,645.15 2,635.00
Resistance levels: 2,672.20 2,683.20 2,697.90
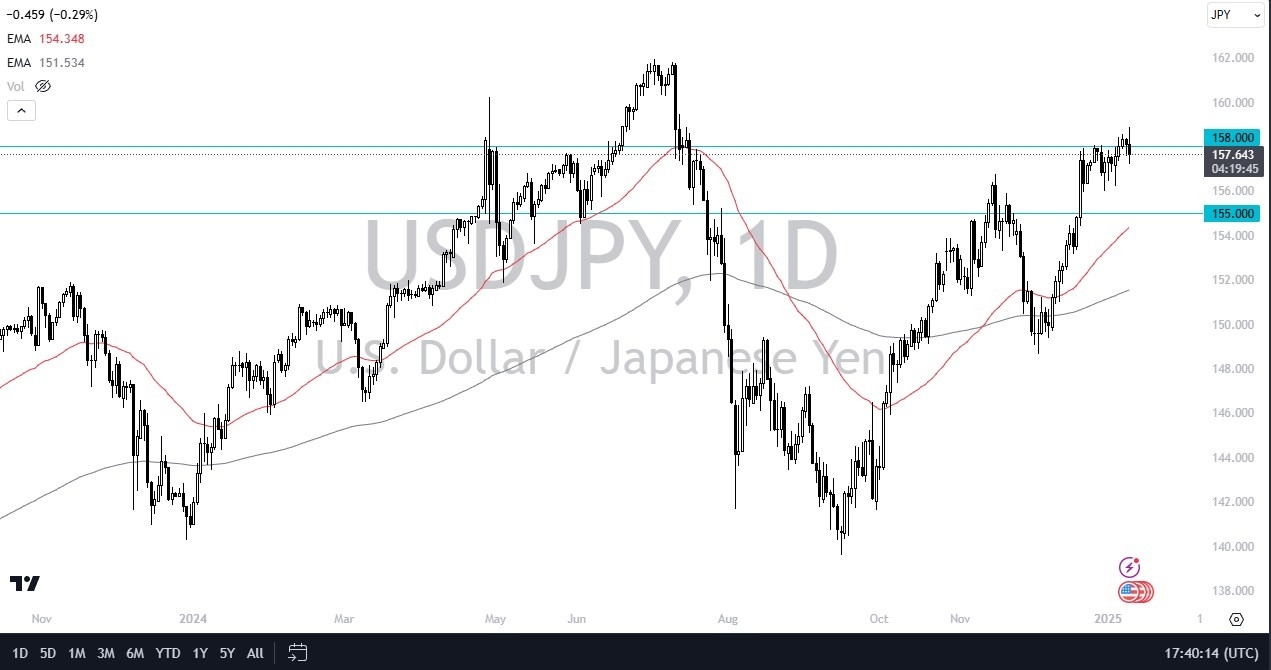
I think at this point, you have to look to the longer term outlook for both of these central banks. And the reality is, even though Japan’s getting a little better, the U.S. economy is still very strong. And as a result, you should continue to see the U.S. dollar strengthen against most currencies, including the Japanese yen, but I also recognize that with the sell-off that we had seen in the stock market, it does make a certain amount of sense that people might’ve been looking for the safety of the Japanese yen, specifically Japanese investors involved in America.

But in the longer term, you do get paid to hang on to this USD/JPY pair. And I think that’s something that a lot of people ignore, at least in the retail space. If we can break above the 158 yen level, then I think you’ve got a situation where we could make another attempt to break out completely, but right now it looks like we’re going to bounce around a little bit and just panic.
That’s not that unusual for this pair, but it’s difficult to make an argument for anything other than an uptrend right now. So I wouldn’t read too much into this other than there might’ve been some liquidity issues. The Bank of Japan might’ve been involved. We just don’t know, and of course, there was a lot of repositioning after that non-farm payroll announcement. I remain bullish, but I recognize this is going to be a headache.
Want to trade our USD/JPY forex analysis and predictions? Here’s a list of forex brokers in Japan to check out.
The natural gas markets have shown quite a bit of upward momentum. But really, at this point in time, I think you have to look at them through the prism of how many rallies do we have left in the winter? Clearly, we’re in one. Now, the question of course will be whether or not we can break to the $4.50 level. If we can break there, then it’s likely that we could see a lot of upward momentum, perhaps to the $5 level. Ultimately, this is a market that I have no interest in shorting whatsoever. So, with that being the case, I’m just looking for dips to buy.
The $4 level should be support as well, but I also think there’s probably even more support at the $3.60 level. Sooner or later, we are going to focus on spring, but we’ve got some time before that. So, I think we’ve got one, maybe two more bounces and shots higher before we turn around and start focusing on winter being gone. The market breaking down below the $3.40 level could of course break things down significantly, but we’re so far away from that right now, it’s not really a concern of mine.
According to reliable trading company platforms, the pound sterling (GBP) faced further losses against other major currencies as ongoing concerns about rising borrowing costs in Britain continued to weigh on sentiment. Recently, the yield on 10-year UK government bonds rose to its highest level since 2008, raising concerns about the country’s financial stability and the ability of the British government to effectively manage its economic challenges.
The pressure on the pound and the US dollar are still receiving more strength, which will ensure that the downtrend in the pound/dollar will remain for some time.
In this regard, according to analysts from Deutsche Bank, the fundamental shifts that could work against the pound in the future include:
Loss of volatility-adjusted carry. This is where capital flows to countries with higher interest rates, which the UK prides itself on. But for this strategy to work, volatility must be low. According to the analysts: “Recent volatility is harmful.”
Meanwhile, the UK is printing “significantly weaker-than-expected economic data”. The first half of 2024 saw the opposite, with the UK growing faster than all its G7 peers.
Deutsche Bank therefore believes that the economic deterioration means there is a growing possibility of further interest rate cuts by the Bank of England this year compared to the current 50 basis points in money markets. Furthermore, the improvements in the current account deficit seen over recent years are also likely to fade as energy prices rise again. Deutsche Bank analysts added, “A wider current account deficit ahead increases the case for sterling weakness in an environment where UK yield rises are limited by the need for monetary policy easing,”.
They added, “After profiting on our long sterling positions at mid-December highs, we now recommend selling sterling,”.
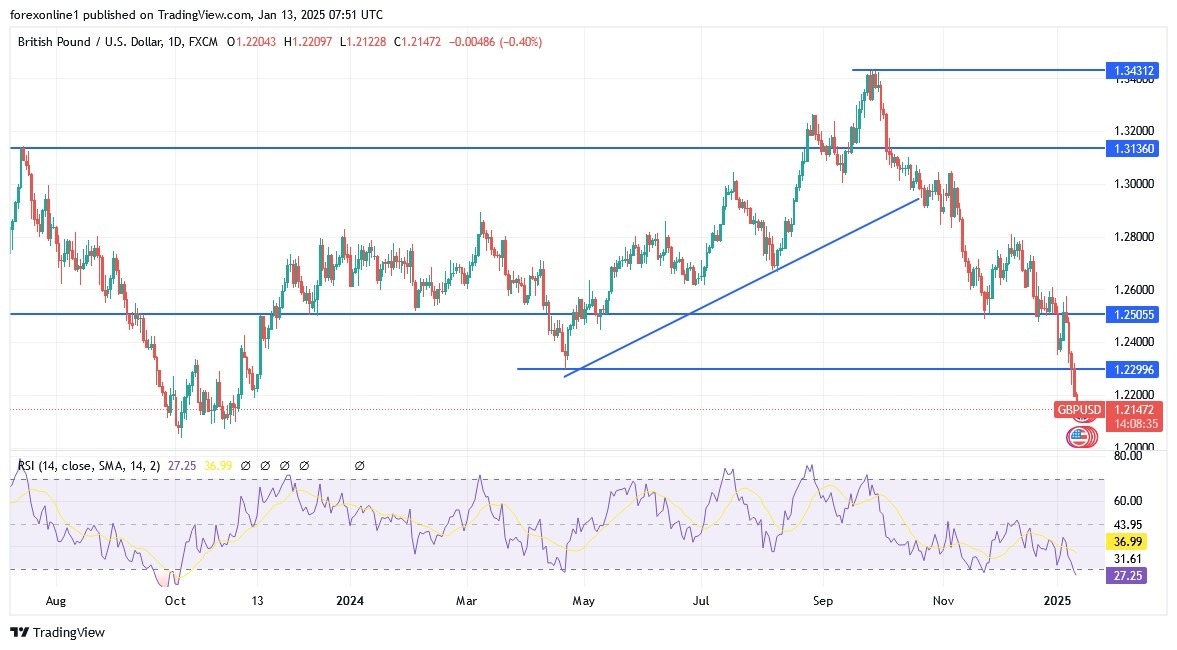
Dear reader, according to recent trades, the overall trend of the GBP/USD currency pair is increasingly downward, and its recent losses were enough to push technical indicators towards oversold levels, led by the Relative Strength Index and the MACD. Currently, the closest support levels for the pound sterling are 1.2155, 1.2080, and the psychological support of 1.2000. Forex investors may look for buying opportunities, but this may be cautious until sentiment towards the sterling improves.
Conversely, and over the same timeframe, any attempts by bulls to rebound upwards may encounter resistance at levels of 1.2440 and 1.2600 respectively. Until then, gains in the pound sterling will remain vulnerable to a rapid collapse.
Ready to trade our daily GBP/USD Forex forecast? Here’s some of the best forex broker UK reviews to check out.
Copper prices broke a two-year losing streak in 2024 after rising by about 3% following declines of 12% and 8% in 2022 and 2023, respectively.
The red metal performed exceptionally well in the first half of last year, rising above $5 per pound before retreating in the second half of the year, falling back to nearly $4 per pound.
The global economic uncertainty that developed in the second half of last year, particularly in China—the largest copper consumer in the world—dragged on the red metal’s sentiment.
Copper prices got off to a great start in 2025, rising nearly 5% through the first week of trading. The move came despite a rise in the dollar—which usually works against prices because of the currency’s impact on trade.
However, several developments bode well for the industrial metal’s outlook this year.
The first is that China’s government appears more willing to introduce stimulus measures—both from the fiscal and monetary sides.
China expects a new trade war with the incoming Trump administration. While that will likely be negative for global trade, it may also increase Beijing’s willingness to bolster domestic consumption.
A 5% target for Chinese gross domestic product (GDP) growth remains in place for 2025. Beijing has already introduced several measures to boost consumption, including expanding a subsidized program that allows consumers to trade in goods, such as phones.
China also boosted pay for millions of government workers, with about $20 billion in economic impact from those wage hikes. Beijing also agreed to issue about $409 billion in bonds for 2025, the highest on record.
Meanwhile, smelters in China are expected to continue to increase production this year even as the supply of copper concentrate narrows. The increased production estimates follow lower benchmark prices for copper concentrate, which could help to bolster smelters’ profit margins.
The Trump administration appears likely to take measures to make it easier for mining projects to take off. That could include faster permitting and reduced regulations, especially around environmental concerns. That should help boost copper supply, but it won’t come in 2025 because mines take years and sometimes decades to start producing.
That said, demand in the United States is likely to increase, especially if current economic conditions persist and the Federal Reserve cuts interest rates. Still, if the U.S. economy continues to chug along, it could help to support copper prices. The main tailwinds could come from electric vehicles and increased data centers to support artificial intelligence.
A possible target for copper this year could be $5 per pound, according to several analysts. However, there will likely be considerable volatility along the way. A trade war would have an oversized impact on financial markets, especially assets like copper, which are sensitive to trade and overall economic conditions.
Traders increased their short bets on copper late in 2024, with short positioning now at the highest levels since last summer. Prices are still increasing, which could increase copper prices should the current trajectory hold, forcing traders to close their short positions.
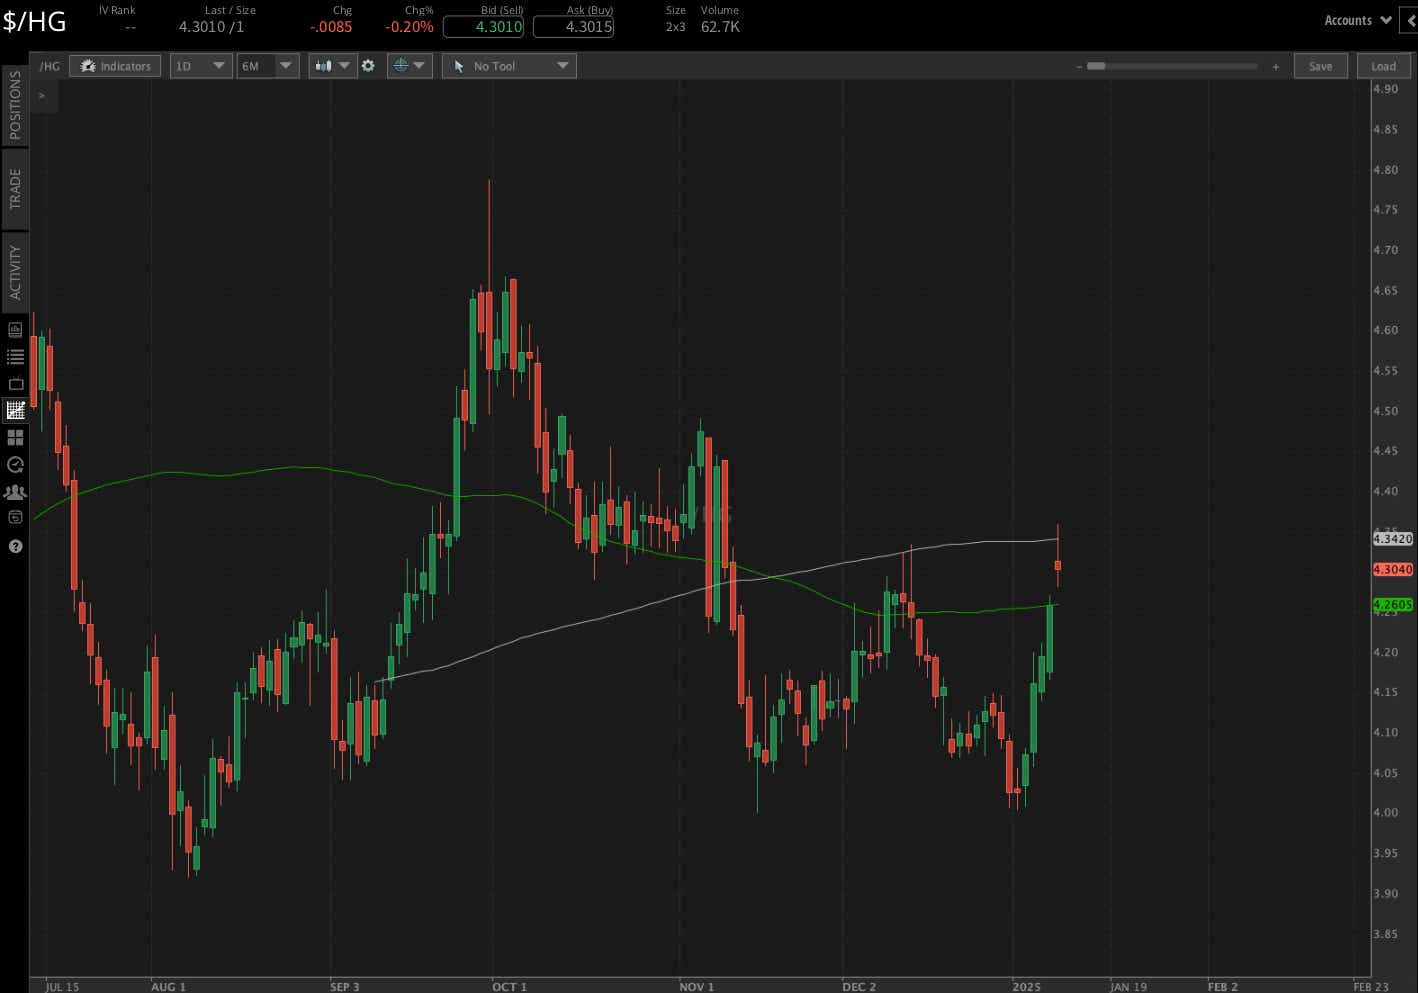
Copper prices made a notable technical move early this month, crossing above the 100-day simple moving average (SMA) on Jan. 10. The 200-day SMA is now being attacked, which could lead to a material improvement in the metal’s technical structure if prices manage to close above. Possible resistance from recent swing highs, notably the November swing high at 4.4930, and the September high at 4.79, could come into play in the coming months.
Thomas Westwater, a tastylive financial writer and analyst, has eight years of markets and trading experience. @fxwestwater
For live daily programming, market news and commentary, visit tastylive or the YouTube channels tastylive (for options traders), and tastyliveTrending for stocks, futures, forex & macro.
Trade with a better broker, open a tastytrade account today. tastylive, Inc. and tastytrade, Inc. are separate but affiliated companies.
USD/JPY Forecast: The Psychological Resistance Level of 160.00 Remains in Sight
On the economic data front, household spending in Japan fell 0.4% year-on-year in November, while household income rose 0.7%. Externally, the Japanese yen faced additional pressure from the recent widening of the yield differential between the United States and Japan, driven by hawkish signals from the US Federal Reserve.
On the US side, according to economic calendar data, US job growth rates increased and unemployment rates decreased last month. According to an official announcement, the US economy added a total of 256,000 jobs last month, up from 212,000 jobs in November. The country’s unemployment rate, which was expected to remain at around 4.2%, fell to 4.1% last month. Overall, the final US jobs report for 2024 confirms that the economy and employment were able to grow at a strong pace even with interest rates significantly higher than before the pandemic. As a result, the likelihood of the US Federal Reserve cutting borrowing costs again in the coming months may be much lower.
Overall, the Federal Reserve has cut US interest rates three times in the past year in part due to concerns about slowing employment and growth. Strong jobs numbers suggest the economy is entering a post-Covid period of steady growth, higher interest rates, low unemployment and slightly higher inflation.
Don’t be fooled by the recent USD/JPY sell-off, it’s a natural thing after recent gains. The foundations of bullish control are in place and eyes are still easily set on the psychological resistance of 160.00
Following the latest economic data, expectations have increased that the US Federal Reserve may pause the pace of US interest rate cuts in the coming months amid concerns that Trump’s aggressive trade policies towards major global economies could re-ignite inflation.
Overall, the US numbers are likely to support policymakers’ intention to move cautiously this year – their December forecasts showed only two US interest rate cuts by 2025 – amid a clear pause in progress towards the 2% inflation target. Recently, Wall Street investors and economists had already scaled back expectations for rate cuts after the release. Also, this week’s US consumer and wholesale price reports will provide further clues on where inflation is headed ahead of the Fed’s next policy meeting on January 28-29.
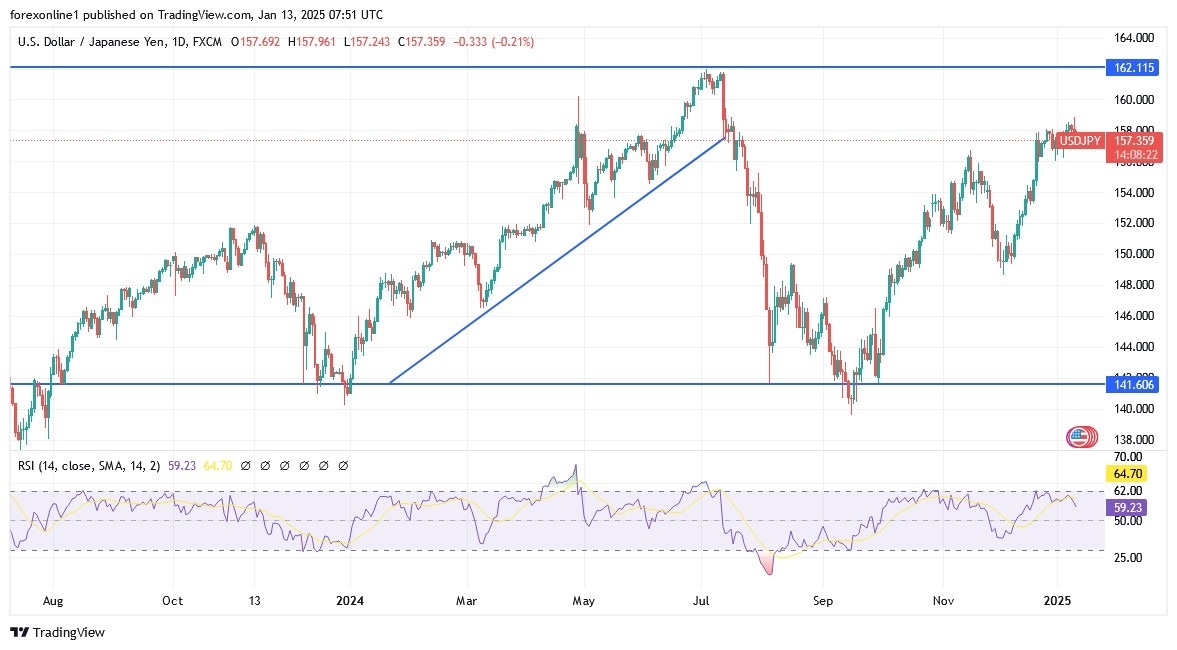
Based on recent trading, USD/JPY is now trading slightly below its 100-hour moving average. However, the currency pair still has plenty of room to run before reaching oversold levels on the 14-hour RSI. In the near term, bears will look to extend the current decline towards 157.48 or lower to the support at 156.90. Bulls, on the other hand, will look to rebound higher with gains to the resistance levels at 158.00 and 158.65, respectively.
In the long term, based on the daily chart, the USD/JPY pair is trading in an ascending channel formation. Also, the 14-day RSI supports a long-term bullish bias as it approaches overbought levels. Therefore, bulls will seek to extend the overall uptrend gains towards the psychological resistance level of 160.00 or higher to the resistance of 162.60 respectively, which is enough to push all technical indicators towards strong overbought levels. On the other hand, and in the same time frame, bears will seek to benefit from pullbacks around 155.00 or lower at the support of 152.30 respectively.
Want to trade our USD/JPY forex analysis and predictions? Here’s a list of forex brokers in Japan to check out.