The main category of Forex News.
You can use the search box below to find what you need.
[wd_asp id=1]
The main category of Forex News.
You can use the search box below to find what you need.
[wd_asp id=1]
Gold price pauses its four-day uptrend, treading water below $2,700 in Asian trading on Monday. Gold buyers seem to face exhaustion following a relentless rise in the previous week.
The US Dollar (USD) has entered a bullish consolidation phase alongside the US Treasury bond yields, leaving Gold price gyrating in a tight range below the monthly high of $2,698 set on Friday.
However, China’s efforts to stabilize the Chinese Yuan and prop up economic growth lend support to the non-yielding Gold price, keeping its downside attempts capped. Additionally, markets remain wary of the potential trade policies implemented by US President-elect Donald Trump and their impact on inflation and the economy, underpinning the safe-haven appeal of the bright metal.
Furthermore, the ongoing upsurge in WTI oil prices also adds to the inflationary concerns in the Trump 2.0 era, supporting the inflation-hedge Gold price. Oil price shot through the roof on Friday after the US Treasury imposed wider sanctions on Russian oil supply. US sanctions are expected to affect Russian crude exports to top buyers China and India.
In the day ahead, it remains to be seen if Gold price manages to resume the uptrend as traders could resort to profit-taking on their long positions heading toward Wednesday’s US Consumer Price Index (CPI) data release, which holds more relevance after Friday’s stellar Nonfarm Payrolls (NFP) report ramped up bets for just one interest rate cut by the US Federal Reserve (Fed) this year.
The Labor Department’s NFP report showed that the US economy created 256,000 jobs in December against November’s 227,000 job gains and the expected 160,000 figure. The Unemployment Rate unexpectedly fell to 4.1% versus a steady reading of 4.2% expected in the reported period.
“Markets have already scaled back expectations for Fed rate cuts to just 27 basis points (bps) for all of 2025, with the terminal level now seen around 4.0% compared to the 3.0% many had hoped for this time last year,” according to Refinitiv’s US Dollar Interest Rate Probabilities.
More so, traders will monitor the demand for physical Gold in India and China for fresh trading impulses. Reuters reported that “Gold discounts in India rose this week as consumers refrained from buying as local prices hit a month’s high.” In China, the world’s top Gold consumer, Gold buying activity seems to have picked as the Year of the Snake draws closer.
The daily chart shows that despite a Bear Cross in play, Gold buyers remained defiant and flexed their muscles on Friday, extending the symmetrical triangle breakout.
Gold price confirmed an upside break from a month-long symmetrical triangle pattern on January 8, adding credence to the ongoing bullish momentum. Meanwhile, the 21-day Simple Moving Average (SMA) crossed the 100-day SMA from above on a daily closing basis on Thursday, validiting the Bear Cross.
The 14-day Relative Strength Index (RSI) holds comfortably above the midline, currently near 60.00, backing the case for more upside in Gold price.
Gold price could extend its four-day advance to take out the $2,700 barrier should buyers regain poise.
The next upside barriers are aligned at the $2,710 round level and the December 12 high of $2,726.
Conversely, strong support is around $2,645, where the 50-day SMA coincides with the triangle resistance.
If that cap is cracked, Gold price will find immediate respite at $2,635, the confluence of the 21-day SMA, the 100-day SMA and the triangle support.
The last line of defense for Gold buyers is seen at the January 6 low of $2,615.
(This story was corrected on January 13 at 6:50 GMT to say that a stellar NFP report ramped up bets for just one interest rate cut by the Fed this year, not a hike.)
Gold has played a key role in human’s history as it has been widely used as a store of value and medium of exchange. Currently, apart from its shine and usage for jewelry, the precious metal is widely seen as a safe-haven asset, meaning that it is considered a good investment during turbulent times. Gold is also widely seen as a hedge against inflation and against depreciating currencies as it doesn’t rely on any specific issuer or government.
Central banks are the biggest Gold holders. In their aim to support their currencies in turbulent times, central banks tend to diversify their reserves and buy Gold to improve the perceived strength of the economy and the currency. High Gold reserves can be a source of trust for a country’s solvency. Central banks added 1,136 tonnes of Gold worth around $70 billion to their reserves in 2022, according to data from the World Gold Council. This is the highest yearly purchase since records began. Central banks from emerging economies such as China, India and Turkey are quickly increasing their Gold reserves.
Gold has an inverse correlation with the US Dollar and US Treasuries, which are both major reserve and safe-haven assets. When the Dollar depreciates, Gold tends to rise, enabling investors and central banks to diversify their assets in turbulent times. Gold is also inversely correlated with risk assets. A rally in the stock market tends to weaken Gold price, while sell-offs in riskier markets tend to favor the precious metal.
The price can move due to a wide range of factors. Geopolitical instability or fears of a deep recession can quickly make Gold price escalate due to its safe-haven status. As a yield-less asset, Gold tends to rise with lower interest rates, while higher cost of money usually weighs down on the yellow metal. Still, most moves depend on how the US Dollar (USD) behaves as the asset is priced in dollars (XAU/USD). A strong Dollar tends to keep the price of Gold controlled, whereas a weaker Dollar is likely to push Gold prices up.
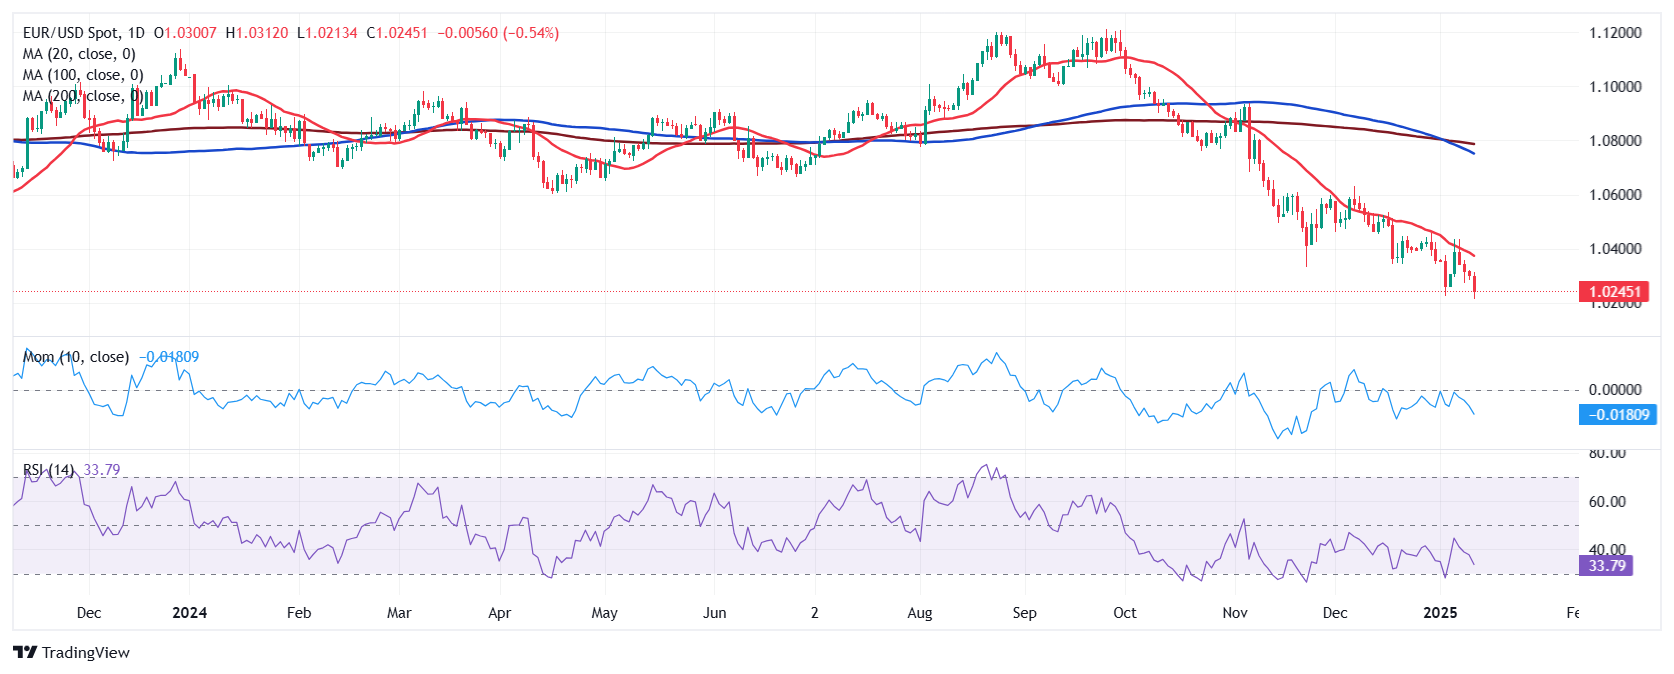
The EUR/USD pair remained under selling pressure this week, with the US Dollar (USD) retaining its overall strength. The Greenback benefited from risk-aversion bouts, triggered by United States (US) President-elect Donald Trump’s tariffs plan. The pair heads into the weekend trading at around 1.0250, not far from the multi-year low posted on Friday at 1.0212.
The Washington Post reported on Monday that Donald Trump’s transition team was working on narrowing tariffs, focusing only on key sectors deemed vital to national security, such as defence, medical supplies and energy, narrowing the universal tariffs plan that Trump anticipated during his campaign. Latter in the day, however, Trump denied the headlines, saying that the story about paring back tariffs was wrong.
The EUR/USD pair jumped to 1.0431 with the initial headlines, as markets welcomed the idea of limited tariffs. Trump’s denial, on the other hand, boosted the US Dollar (USD) while sending stocks into a selling spiral.
Fears resumed mid-week when CNN reported that Trump was considering declaring a national economic emergency to impose widespread tariffs. Using the International Economic Emergency Powers Act (IEEPA) will unilaterally authorize a president to manage imports during a national emergency.
The Federal Open Market Committee (FOMC) released the Minutes of the December Federal Reserve (Fed) monetary policy meeting on Wednesday, and the document brought some negative headlines.
Yet what caught investors’ attention is that the Minutes showed almost all members judged that the upside risk to inflation has increased. Officials mentioned “potential changes in trade, immigration, fiscal, and regulatory policies” as the reasons behind their fresh growth and inflation-related concerns. Without saying it, officials said they are concerned about what Trump’s policies would mean to the economy.
Meanwhile, the US released multiple employment figures. The December ADP Employment Report showed that the private sector added 122K new jobs in the month, missing expectations of 140K. Additionally, Initial Jobless Claims for the week ended January 3 increased by 201K, better than the 218K expected and below the previous 211K. Also, US-based employers announced 38,792 cuts in December, a 33% decrease from the 57,727 cuts announced one month prior. It is up 11% from the 34,817 cuts announced in the last month of 2023, according to the Challenger Job Cuts report.
Finally, on Friday, the US published the Nonfarm Payrolls (NFP) report, which showed 256,000 new jobs were added in December. The reading was much stronger than the 160,000 anticipated and the November 212,000 reading. Even further, the Unemployment Rate edged lower to 4.1% from 4.2%, while the Labor Force Participation remained steady at 62.5%. Finally, annual wage inflation, as measured by the change in the Average Hourly Earnings, declined to 3.9% from 4%.
Markets turned risk-averse with the news, with the US Dollar rallying and stocks plummeting, as such figures suggest the Federal Reserve (Fed) will refrain from cutting interest rates in the upcoming months.
European data fell once again short of encouraging. The preliminary estimate of the German Harmonized Index of Consumer Prices (HICP) was higher than anticipated, as the index rose 2.8% on its yearly comparison, above the 2.6% anticipated and the previous 2.4%. Retail Sales in the country fell 0.6% in November, while Factory Orders declined by 5.4% in the same period.
The Eurozone HICP rose 2.7% in the year to December as expected, yet the Producer Price Index (PPI) was down 1.2% YoY in November, higher than the previous -3.3% or the -1.3% expected.
The European Central Bank (ECB) will likely continue trimming interest rates. That would keep the Euro on the downside, while a hawkish Fed means a stronger US Dollar. EUR/USD at parity is in the foreseeable future.
For the upcoming week, the focus will be on the US Consumer Price Index. The country will publish it next Wednesday, and Retail Sales will be published on Thursday. Other than that, the macroeconomic calendar has little relevant to offer.
From a technical perspective, the EUR/USD pair is down for a fifth consecutive week and there are no technical signs that suggest an interim bottom is nearby. Indeed, EUR/USD is oversold in the weekly chart, yet the Relative Strength Index (RSI) indicator keeps heading south despite being at 28. The Momentum indicator in the same chart bounced just modestly from extreme levels but remains far below its midline, not enough to suggest an upcoming bounce. Finally, the 20 Simple Moving Average (SMA) has accelerated its slump and crossed below a flat 100 SMA, reflecting sellers’ strength.
In the daily chart, EUR/USD has plenty of room to extend its slide. Technical indicators head south within negative levels, still far from oversold readings. Even further, the EUR/USD pair posted lower lows after a couple of failed attempts to overcome a bearish 20 SMA, currently providing dynamic resistance at around 1.0380. In the same chart, the 100 SMA crossed below the 200 SMA after holding above it for roughly five months. Both moving averages stand around the 1.0800 level, not only anticipating additional slides but also reflecting sellers’ strength.
September 2022 high at 1.0197 is the immediate support level, ahead of the 1.0100 figure. A break below the latter exposes parity, albeit further slides seem unlikely in the upcoming days. The 1.0300 – 1.0330 area provides near-term support ahead of the 1.0400 mark.
The table below shows the percentage change of US Dollar (USD) against listed major currencies last 7 days. US Dollar was the strongest against the British Pound.
| USD | EUR | GBP | JPY | CAD | AUD | NZD | CHF | |
|---|---|---|---|---|---|---|---|---|
| USD | -0.04% | 1.03% | -0.19% | 0.02% | 0.52% | 0.40% | 0.30% | |
| EUR | 0.04% | 1.05% | -0.15% | 0.05% | 0.54% | 0.43% | 0.33% | |
| GBP | -1.03% | -1.05% | -1.16% | -0.99% | -0.50% | -0.61% | -0.71% | |
| JPY | 0.19% | 0.15% | 1.16% | 0.20% | 0.69% | 0.58% | 0.48% | |
| CAD | -0.02% | -0.05% | 0.99% | -0.20% | 0.48% | 0.38% | 0.28% | |
| AUD | -0.52% | -0.54% | 0.50% | -0.69% | -0.48% | -0.11% | -0.21% | |
| NZD | -0.40% | -0.43% | 0.61% | -0.58% | -0.38% | 0.11% | -0.10% | |
| CHF | -0.30% | -0.33% | 0.71% | -0.48% | -0.28% | 0.21% | 0.10% |
The heat map shows percentage changes of major currencies against each other. The base currency is picked from the left column, while the quote currency is picked from the top row. For example, if you pick the US Dollar from the left column and move along the horizontal line to the Japanese Yen, the percentage change displayed in the box will represent USD (base)/JPY (quote).
Silver price (XAG/USD) falls sharply to near $30.00 after failing to extend its upside above the key hurdle of $30.60 in Monday’s European session. The white metal weakens as the US bond yields strengthens, with market participants reassessing their expectations for the Federal Reserve’s (Fed) monetary policy outlook after the release of the United States (US) Nonfarm Payrolls (NFP) data for December.
10-year US Treasury yields post fresh yearly high to near 4.80% as traders have pared Fed dovish bets after the release of the surprisingly upbeat labor market data. Higher yields on interest-bearing assets weigh on non-yielding assets, such as Silver, as they result in higher opportunity costs for them. The US Dollar Index (DXY), which tracks the Greenback’s value against six major currencies, posts a fresh two-year high above 110.00.
According to the CME FedWatch tool, the Fed is expected to keep interest rates unchanged in the current range of 4.25%-4.50% atleast in the next three policy meetings.
Meanwhile, the broader outlook of the Silver price remains firm as the market sentiment is bearish amid uncertainty over the incoming trade policies under the administration of US President-elect Donald Trump. The appeal of non-yielding assets strengthens in a highly uncertain environment.
This week, investors will focus on the US Consumer Price Index (CPI) data for December, which will be published on Wednesday.
Silver price continues to face selling pressure near the 50-day Exponential Moving Average (EMA), which trades near $30.35. The white metal remains below the upward-sloping trendline around $30.50 on a daily timeframe, which is plotted from the February 29 low of $22.30
The 14-day Relative Strength Index (RSI) oscillates inside the 40.00-60.00 range, suggesting a sideways trend.
Looking down, the September low of $27.75 would act as key support for the Silver price. On the upside, the December 12 high of $32.33 would be the barrier.
Silver is a precious metal highly traded among investors. It has been historically used as a store of value and a medium of exchange. Although less popular than Gold, traders may turn to Silver to diversify their investment portfolio, for its intrinsic value or as a potential hedge during high-inflation periods. Investors can buy physical Silver, in coins or in bars, or trade it through vehicles such as Exchange Traded Funds, which track its price on international markets.
Silver prices can move due to a wide range of factors. Geopolitical instability or fears of a deep recession can make Silver price escalate due to its safe-haven status, although to a lesser extent than Gold’s. As a yieldless asset, Silver tends to rise with lower interest rates. Its moves also depend on how the US Dollar (USD) behaves as the asset is priced in dollars (XAG/USD). A strong Dollar tends to keep the price of Silver at bay, whereas a weaker Dollar is likely to propel prices up. Other factors such as investment demand, mining supply – Silver is much more abundant than Gold – and recycling rates can also affect prices.
Silver is widely used in industry, particularly in sectors such as electronics or solar energy, as it has one of the highest electric conductivity of all metals – more than Copper and Gold. A surge in demand can increase prices, while a decline tends to lower them. Dynamics in the US, Chinese and Indian economies can also contribute to price swings: for the US and particularly China, their big industrial sectors use Silver in various processes; in India, consumers’ demand for the precious metal for jewellery also plays a key role in setting prices.
Silver prices tend to follow Gold’s moves. When Gold prices rise, Silver typically follows suit, as their status as safe-haven assets is similar. The Gold/Silver ratio, which shows the number of ounces of Silver needed to equal the value of one ounce of Gold, may help to determine the relative valuation between both metals. Some investors may consider a high ratio as an indicator that Silver is undervalued, or Gold is overvalued. On the contrary, a low ratio might suggest that Gold is undervalued relative to Silver.
Crude oil futures reached their highest levels since October earlier this week, and the momentum wasn’t slowing as of Friday morning. WTI and Brent were trading at $74.58 and $77.59 respectively at the time of writing, with traders assessing the interplay of seasonal demand, supply constraints, and mixed inventory data as the week draws to a close. Despite the recent rise in prices, traders remain cautious about balancing tightening supply and uncertain demand signals.
Supply Constraints Drive Upward Pressure
Supply-side factors were critical in shaping crude oil’s price movements this week. OPEC production dropped by 50,000 barrels per day (bpd) in December, largely due to maintenance in the UAE and declining Iranian output. These reductions align with OPEC+’s broader commitment to cut production, ensuring supply remains constrained. Saudi Arabia and Iraq maintained steady production levels, adhering to the cartel’s strategy to limit global availability.
Adding to the supply squeeze, Western sanctions on Russian crude shipments continued to bite. Efforts by the Biden administration to restrict Russian exports, coupled with expectations of a 300,000 bpd decline in Iranian production, amplified concerns over global supply. These geopolitical factors have reinforced support for prices, even as demand uncertainties loom.
Winter Weather Fuels Seasonal Demand
Colder-than-expected weather across the U.S. and Europe has sharply increased demand for heating…
GBP/USD continues losing ground for the fifth straight day and drops to over a one-year low.
Stagflation fears and UK fiscal concerns continue to weigh on the GBP amid a bullish US Dollar.
A slightly oversold RSI on the daily chart warrants some caution for aggressive bearish traders.
The GBP/USD pair remains under heavy selling pressure for the fifth straight day and dives to its lowest level since November 2023, around the 1.2125 region during the Asian session on Monday. Moreover, the fundamental backdrop seems tilted in favor of bearish traders, though slightly oversold conditions on the daily chart warrant some caution before positioning for further losses.
Investors remain concerned about the risk of stagflation in the UK. This, along with the anxiety about the UK’s fiscal health, turn out to be key factors contributing to the British Pound’s (GBP) relative underperformance. Apart from this, the underlying strong bullish sentiment surrounding the US Dollar (USD), bolstered by firming expectations that the Federal Reserve (Fed) will pause its rate-cutting cycle, validates the negative outlook for the GBP/USD pair.
From a technical perspective, the Relative Strength Index (RSI) on the daily chart has dropped below the 30 mark, making it prudent to wait for some near-term consolidation or a modest rebound before the next leg down. Any attempted recovery, however, might confront resistance and remain capped near the 1.2200 mark. That said, some follow-through buying beyond the Asian session top, around the 1.2210 area, could trigger a short-covering move.
The GBP/USD pair might then accelerate the positive move towards the 1.2245-1.2250 intermediate hurdle before aiming to reclaim the 1.2300 round figure. The latter should act as a key pivotal point, which if cleared decisively could negate the negative bias and shift the near-term bias in favor of bullish traders.
Meanwhile, the downward trajectory seems strong enough to drag the GBP/USD pair further towards testing sub-1.2100 levels, or the November 2023 low. Acceptance below the said handle could make spot prices vulnerable to decline further towards October 2023 through, around the 1.2035 region, en route to the 1.2000 psychological mark.
The table below shows the percentage change of US Dollar (USD) against listed major currencies today. US Dollar was the strongest against the British Pound.
| USD | EUR | GBP | JPY | CAD | AUD | NZD | CHF | |
|---|---|---|---|---|---|---|---|---|
| USD | 0.29% | 0.56% | -0.24% | 0.12% | 0.20% | 0.18% | 0.06% | |
| EUR | -0.29% | 0.25% | -0.47% | -0.11% | 0.06% | -0.05% | -0.14% | |
| GBP | -0.56% | -0.25% | -0.73% | -0.35% | -0.21% | -0.30% | -0.39% | |
| JPY | 0.24% | 0.47% | 0.73% | 0.35% | 0.36% | 0.28% | 0.31% | |
| CAD | -0.12% | 0.11% | 0.35% | -0.35% | 0.04% | 0.06% | 0.03% | |
| AUD | -0.20% | -0.06% | 0.21% | -0.36% | -0.04% | -0.13% | -0.18% | |
| NZD | -0.18% | 0.05% | 0.30% | -0.28% | -0.06% | 0.13% | -0.09% | |
| CHF | -0.06% | 0.14% | 0.39% | -0.31% | -0.03% | 0.18% | 0.09% |
The heat map shows percentage changes of major currencies against each other. The base currency is picked from the left column, while the quote currency is picked from the top row. For example, if you pick the US Dollar from the left column and move along the horizontal line to the Japanese Yen, the percentage change displayed in the box will represent USD (base)/JPY (quote).
Gold price (XAU/USD) trades with mild losses near $2,690 on the stronger US Dollar (USD) broadly during the early Asian session on Monday. However, the safe-haven demand due to uncertainty surrounding the President-elect Donald Trump administration’s policies might help limit the Gold’s losses.
The stronger-than-expected US employment data on Friday reinforced expectations that the US Federal Reserve (Fed) might not cut interest rates as aggressively this year. This, in turn, weighs on the non-yielding asset. Traders expect the Fed to cut interest rates by just 30 basis points (bps) over the course of this year, compared with cuts worth about 45 bps before the NFP report.
On the other hand, Trump’s policy risks boosting the Gold price, a traditional safe-haven asset. “Gold is still acting resilient in the face of a much stronger-than-expected jobs report … One of the factors that’s been supporting gold is this uncertainty that we’ve seen going into the (U.S. presidential) inauguration,” said David Meger, director of metals trading at High Ridge Futures.
Additionally, the escalating geopolitical tensions in the Middle East and the ongoing Russia-Ukraine conflict might contribute to the precious metal downside. Israeli strikes continued throughout Gaza, including attacks near Gaza City, Nuseirat, and Bureij. Two attacks were also reported in the Houmin Valley in southern Lebanon, according to Lebanon’s National News Agency.
Gold has played a key role in human’s history as it has been widely used as a store of value and medium of exchange. Currently, apart from its shine and usage for jewelry, the precious metal is widely seen as a safe-haven asset, meaning that it is considered a good investment during turbulent times. Gold is also widely seen as a hedge against inflation and against depreciating currencies as it doesn’t rely on any specific issuer or government.
Central banks are the biggest Gold holders. In their aim to support their currencies in turbulent times, central banks tend to diversify their reserves and buy Gold to improve the perceived strength of the economy and the currency. High Gold reserves can be a source of trust for a country’s solvency. Central banks added 1,136 tonnes of Gold worth around $70 billion to their reserves in 2022, according to data from the World Gold Council. This is the highest yearly purchase since records began. Central banks from emerging economies such as China, India and Turkey are quickly increasing their Gold reserves.
Gold has an inverse correlation with the US Dollar and US Treasuries, which are both major reserve and safe-haven assets. When the Dollar depreciates, Gold tends to rise, enabling investors and central banks to diversify their assets in turbulent times. Gold is also inversely correlated with risk assets. A rally in the stock market tends to weaken Gold price, while sell-offs in riskier markets tend to favor the precious metal.
The price can move due to a wide range of factors. Geopolitical instability or fears of a deep recession can quickly make Gold price escalate due to its safe-haven status. As a yield-less asset, Gold tends to rise with lower interest rates, while higher cost of money usually weighs down on the yellow metal. Still, most moves depend on how the US Dollar (USD) behaves as the asset is priced in dollars (XAU/USD). A strong Dollar tends to keep the price of Gold controlled, whereas a weaker Dollar is likely to push Gold prices up.
Oil and Natural Gas Corporation Limited is an India-based crude oil and natural gas company. The Company is engaged in exploration, development and production of crude oil, natural gas and value-added products in India and acquisition of oil and gas acreages outside India for exploration, development and production, downstream (Refining and marketing of petroleum products), Petrochemicals, Power Generation, liquefied natural gas (LNG) supply, Pipeline Transportation, special economic zone (SEZ) development, Helicopter services, Manufacturing of Ethanol and Sugar, Green and Renewable energy business. Its segment includes Exploration and Production, and Refining and Marketing. Its geographical segments consist of India, which includes offshore and onshore, and Outside India. Its subsidiaries include Mangalore Refinery and Petrochemicals Limited, Hindustan Petroleum Corporation Limited, ONGC Videsh Limited, Petronet MHB Limited, ONGC Green Limited, and HPCL Biofuels Limited, among others.
January 12, 2025 – Written by Tim Boyer
STORY LINK Pound to Dollar Forecast for Week Ahead: Sell to 1.1750?
MUFG recommends selling the Pound to Dollar (GBP/USD) exchange rate with a target of 1.1750.
There was a slide in UK bonds during the week with a jump in yields as the 10-year yield hit a 16-year high while the 30-year yield hit the highest level since 1998.
Upward pressure on US yields contributed to the selling of US bonds.
There were fears that the government’s economic strategy would unravel with pressure for fiscal tightening. There were fears over a negative impact on UK growth.
This combination undermined confidence in the pound, resulting in losses across all major currencies.
GBP/USD posted sharp losses with 14-month lows just below 1.2200.
MUFG expects that ongoing pressure on the UK bond market will work in tandem with further Pound selling; “If Gilt yields continue to push higher, adding to the UK government’s funding costs, doubts will continue to build over fiscal plans triggering a further loss of confidence in the GBP.”

It added, “We are not expecting the BoE or government to step up and support the Gilt market in the near-term, leaving it vulnerable to further near-term weakness.”
MUFG also noted the negative implications of higher energy prices.
US developments have added to pressure on global bond markets and contributed to upward pressure on UK bond yields, a twin negative for GBP/USD.
US non-farm payrolls increased 256,000 for December compared with consensus forecasts of around 165,000, while the November increase was revised slightly lower to 212,000 from the flash reading of 227,000.
The unemployment rate declined to 4.1% from 4.2% and compared with expectations of no change.
The University of Michigan consumer confidence data also recorded an increase in 5-year inflation expectations to a 16-year high.
Following the data, markets ruled out the potential for a Fed rate cut in January and considered that the chances of a March cut had dipped to around 25%.
Markets also considered that the Fed may only cut rates once during the year.
Bank of America, for example, now expects that there will not be any further rate cuts this year.
The US 10-year bond yield increased to above 4.75%, the highest level since October 2023, maintaining pressure on the UK bond market.
Seema Shah, chief global strategist at Principal Asset Management, noted the adverse global implications; “The important payroll beat will be good news for the U.S. economy and the US dollar, unwelcome news for equities as they seek interest rate relief, and punishing news for global bond markets, particularly UK gilts.”
She added, “For global bonds, the strength of the U.S. jobs report just adds to their challenges. The peak for yields has not yet been reached, suggesting additional stresses that several markets, especially the UK, can ill afford.”
Rabobank expressed concerns over the UK fundamentals; “the UK is a price taker in sovereign debt markets, particularly exposed to the whims of foreign/nonbank investors because of its fiscal deficit and its current account deficit.”
The bank’s economists expect that the government will have to announce further fiscal tightening in the March budget.
It added, “If so, that would work out disinflationary instead of inflationary, and that would give the BoE enough policy space to at least stick to their theme of gradualism.”
It expects quarterly interest rate cuts by the BoE.
SocGen added, “GBP/USD is likely to remain under pressure due to US economic strength and a widening US-Europe/Asia rate differential.”
Capital Economics chief UK economist Paul Dales put the developments in context; “This week’s leap in gilt yields creates more problems for the Chancellor and is an extra headwind for the economy. But it is not a crisis and the cause mostly originates overseas rather than being home-grown.”
Bank of America also noted the risk of dollar logs being cut; “A USD reversal, if it happens, could be amplified by trend follower unwinds.”
It did, however, add, “Lingering fiscal and inflation concerns, coupled with negative sentiment, suggest caution before re-entering GBP longs.”
UBS will still look to buy Pound dips; “While we do not expect significant near-term weakness, we think that investors should use further strength in the dollar to diversify into other preferred currencies, including the British pound and Australian dollar.”
International Money Transfer? Ask our resident FX expert a money transfer question or try John’s new, free, no-obligation personal service! ,where he helps every step of the way,
ensuring you get the best exchange rates on your currency requirements.
I wrote on 5th January that the best trade opportunities for the week were likely to be:
The weekly profit of 0.90% equals 0.45% per asset.
Last week saw several key data releases, although the directional movement was average:
Last week saw continued risk-off sentiment, with particular fears of President-Elect Trump’s recent tariff threats and of slowing growth data in many G20 nations. This was accompanied by an ongoing bullish focus on the US Dollar, with US treasury yields rising and the anticipated tariffs boosting the greenback and hitting other currencies, notably commodity currencies.
The British Pound and the Australian and New Zealand Dollars are notably weak in the Forex market, while the US Dollar and the Japanese Yen are strong.
The high-impact data last week showed that the US economy is still hot, which in turn boosts expectations of a slower pace of US interest rate cuts, and keeps the US Dollar advancing to new 2-year high prices.
Another standout issue last week was growing alarm at the state of the UK’s finances, with the new British government rapidly losing credibility in the market, which is sinking the British Pound. The British government is trying to weather the storm by stating its fiscal rules are “non-negotiable”.
The coming week has an even more vital schedule of releases, so we are very likely to see increased market activity and volatility in the Forex market.
The coming week’s important data points are:
Monday is a public holiday in Japan.
For January, I forecasted that the USD/JPY currency pair would rise in value and that the EUR/USD currency pair would fall in value. The performance so far of this forecast is:

Last week, I made no weekly forecast as there were no unusually strong price movements in currency crosses, which is the basis of my trading strategy.
The US Dollar was the strongest major currency last week, while the British Pound was the weakest. Volatility was slightly lower last week, with 26% of the most important Forex currency pairs and crosses changing in value by more than 1%. It is likely to remain at a similar level over the coming week.
You can trade these forecasts in a real or demo Forex brokerage account.

Last week, the US Dollar Index again printed a bullish candlestick that continued the long-term bullish trend, again bullishly breaking out to make its highest close in more than 2 years. The price is above its price from three and six months ago, suggesting a healthy long-term bullish trend in the greenback that should be exploitable. The weekly candlestick has little upper wick and closed above the previous week’s high. These are bullish signs.
I have plenty of fundamental reasons to be bullish on the US Dollar after seeing the US unemployment rate unexpectedly fall to 4.1% after higher-than-expected non-farm payrolls data last week. We also seeing US 10-Year Treasury Yields rising to levels not seen in several months, currently above 4.75%, which is helping boost the greenback.
The Dollar is likely to rise over the coming week. The price has room to rise to at least the next resistance level at 110.00.

The GBP/USD currency pair is in a valid long-term bearish trend. It fell strongly last week, with the weekly candlestick shown in the price chart below closing very near its low with little lower wick, suggesting bearish momentum. The price reached a 1-year low on unusually high volatility, which is another sign of momentum in this currency pair.
This pair was the biggest mover last week and is in focus because both currencies are newsworthy.
The US Dollar is advancing to new 2-year highs in a strong bullish trend, boosted by incoming President Trump’s policies and their likely momentary consequences of higher for longer interest rates. Rising US yields, especially 10-year yields, are pushing the greenback higher.
On the other hand, the British Pound has suddenly become very weak as the new British government becomes unpopular very quickly, with its fiscal projections and monetary policies beginning to be called into serious question by the capital markets. Bets against the British Pound using options have reached historically high levels.
I see this currency pair as an obvious sell.


The EUR/USD currency pair is in a valid long-term bearish trend. After a period of consolidation within this trend, the price has begun to move lower with stronger bearish momentum. The price reached a new 2-year low last week but was ultimately held by the support level at $1.0223.
This currency pair often has very reliable trends, so I am interested in being short, especially as the price is now trading in “blue sky”.
The Euro is not especially weak, with the bearish momentum being driven mostly by a strong US Dollar which is advancing almost everywhere.
I see this currency pair as a sell, in fact, it is probably the most reliable trade right now in the entire Forex market, with the possible exception of the GBP/USD currency pair, which is probably dragging the price here lower.

The USD/JPY currency pair was not impressive last week, as it was notable that the Japanese Yen was not willing to fall significantly against the very strong USD. This led to this currency pair being one of the few ones where the US Dollar made only a very small gain, ending the week quite a way off its highest daily close at ¥155.34.
I think this pair’s failure to seriously rise shows that the days of a weak Japanese Yen might really be coming to an end, even though this pair is technically in a long-term bullish trend. However, the weekly candlestick was not far from being a doji, showing indecision in the price action.
Another factor lowering my confidence in the bullish trend is that the Bank of Japan will eventually start implementing a more hawkish monetary policy. When that finally really starts to happen with the Bank of Japan’s next rate hike, the price will be very likely to start moving down, so the trend is vulnerable to policy.
The Yen is also benefitting from the flow out of stock markets looking for a safe haven.
Technically, a daily close above ¥155.34 could be a good long trade entry signal, but I doubt it.

Last week, the AUD/USD currency pair printed a very strongly bearish and large outside candlestick, closing right on its low, which was a new 4-year low. A look at the weekly chart below shows that the bearish momentum has been strong here since October, and the trend here has been stronger and clearer than any other trend in the Forex market, except maybe the one in the USD/CAD currency pair. It is difficult to image being more technically bearish. The linear regression analysis applied within the price chart below shows the strength and reliability of the trend over the past few months.
The story is really about US economic success and a more hawkish Fed boosting the greenback, while Australia is dealing with a weakening economy which will make more rate cuts a matter of necessity, and this will probably have to go increasingly deeper. Adding to the pressure on the Aussie is the fact that stock markets and other risky assets have been selling off, and the Aussie tends to perform poorly during periods of risk-off sentiment such as we have seen in recent days. On the other hand, the Aussie has been selling off even as several stock indices made record highs over recent months, so maybe this is not such a big factor.
This currency pair does not trend very reliably, so I don’t take long-term trades in it, but it certainly looks very weak. All the commodity currencies except maybe the Canadian Dollar are looking weak right now, so it might be an idea to use the AUD and the NZD together as the short component of any Forex trades you are making this week, or at least part of the short component by creating a basket. For example, if you were short two lots EUR/USD, you might also be one lot of AUD/USD long.

Last week, Natural Gas futures printed a strong and quite large bullish candlestick, which closed right on its high at a new 4-year high closing price, after it made a new 4-year high price the previous week before giving up some of its earlier gains.
Natural gas has been driven higher by strong demand due to cold weather in the USA and Europe. However, there are obviously deeper factors at work which are pushing the price to new highs and triggering a real bullish breakout last week.
Taking long trades when major commodities break out to new 6-month highs has historically been a very profitable trading strategy, which is the main reason that I want to get long here when the market opens on Monday. This bullish price pattern shown in the chart below is just starting to show an expansion of volatility, and we could see a very strong rise as the price has plenty of room to advance, especially once it clears the big round number at $4.
Micro futures in natural gas are available at the CME, so this commodity can be quite affordable to trade. There are also ETFs which hold natural gas such as UNG but note that the price of UNG is looking much less bullish than natural gas futures are, so it might not be a good idea to use that right now.

Last Friday, Corn futures printed a strong and large bullish candlestick, which closed at a new 6-month high closing price. However, it is notable that the price has not cleared the inflection point at 475. I think once this is cleared, the price will look much more bullish, so more cautious traders might want to wait for the price to make a bullish breakout beyond 475.
Taking long trades when major commodities break out to new 6-month highs has historically been a very profitable trading strategy, which is the main reason that I want to get long here. However, I do not have as much faith in this trade as I do in the natural gas trade I outlined above.
Unfortunately, Corn futures are quite expensive and just too large for retail traders, but there is an ETF called CORN which can be used to participate in increases in the price of corn. Here, this ETF is outperforming the relevant futures, which puts a bit of a question mark above corn.
I think it will be wise to wait for a daily close above 475 in corn futures before going long.

I see the best trading opportunities this week as:
Ready to trade our weekly Forex forecast? Check out our list of the top 10 Forex brokers in the world.
Egypt Japan price of cà phey to
Coffee prices today December 12, 1 on the world market, at 2025:4 a.m. updated on the Vietnam Commodity Exchange MXV (world coffee prices are continuously updated by MXV, matching world exchanges, the only channel in Vietnam that continuously updates and links to world exchanges).
| People check coffee quality in Gia Lai. Photo: Hien Mai |
Coffee prices on the three main coffee futures exchanges ICE Futures Europe, ICE Futures US and B3 Brazil are continuously updated by Y5Cafe during the trading hours of the exchanges. However, on the night of January 11 and the early morning of January 1, 12, all of the above exchanges temporarily suspended trading for the weekend and were updated as follows:
 |
| Robusta Coffee Price London 12/1/2025 |
On the London floor, at 4:30 a.m. on January 12, 1, the price of Robusta coffee was recorded as follows: The delivery price for March 2025 was 3 USD/ton, the delivery price for May 2025 was 4966 USD/ton, the delivery price for July 5 was 2025 USD/ton and September 4879 was 7 USD/ton.
 |
| Arabica Coffee Price New York December 12, 1 |
Similarly, the price of Arabica coffee on the New York floor, the delivery period in March 3 is 2025 cents/lb, the delivery period in May 323.85 is 5 cents/lb, the delivery period in July 2025 is 319.80 cents/lb and the delivery period in September 7 is 2025 cents/lb.
 |
| Brazilian Arabica Coffee Price on December 12, 1 |
The price of Brazilian Arabica coffee also remained unchanged, recorded at USD 3/ton for March 2025 delivery, USD 404.05/ton for May 5 delivery, USD 2025/ton for July 400.00 and USD 7/ton for September 2025.
Robusta coffee traded on the ICE Futures Europe (London exchange) opens at 16:00 and closes at 00:30 (next day) Vietnam time. Arabica coffee traded on the ICE Futures US (New York exchange) opens at 16:15 and closes at 01:30 (next day) Vietnam time. For Arabica coffee traded on the B3 Brazil exchange, it will open from 19:00 – 02:35 (next day) Vietnam time.
 |
| Gia Lai people harvest coffee at the end of the 2024-2025 crop year. Photo: Hien Mai |
Gthere cà pinternal stable
According to information from Giacaphe.com, at 4:30 a.m. today, January 12, 1, domestic coffee prices stabilized at an average of 2025 VND/kg.
The highest coffee purchase price in the key regions of the Central Highlands was recorded at 119.000 VND/kg. Specifically, today’s coffee price in Dak Lak is 119.000 VND/kg, in Lam Dong is 118.300 VND/kg, in Gia Lai is 118.800 VND/kg and in Dak Nong today is 119.000 VND/kg.
The domestic coffee prices that Giacaphe.com lists every day are calculated based on the prices of two world coffee exchanges combined with continuous surveys from businesses and purchasing agents in key coffee growing areas across the country.
 |
| Domestic coffee price list updated at 4:30 a.m. on December 12, 1 |
The Vietnamese coffee market continues to experience remarkable fluctuations, with an increase in export value but at the same time facing challenges in output and strict requirements from the international market.
Although Vietnam’s coffee output is expected to decline due to the impact of climate change and crop conversion, export value is set to hit a record. In the 2023/2024 crop year, Vietnam will export about 1,46 million tons of coffee, down 12,1% in volume compared to the previous crop year, but the value will reach $5,43 billion, up 33,1%. The average export price will increase sharply to $3.673/ton, nearly 50% higher than in the 2022/2023 crop year.
Climate change, especially drought, has negatively affected coffee production. In addition, farmers’ conversion to higher-value crops such as durian and avocado has also contributed to the reduction in coffee growing areas. In addition, new regulations from the European Union (EU) on anti-deforestation for coffee products have placed higher requirements on environmental protection and traceability, putting more pressure on the Vietnamese coffee industry.
The Vietnamese coffee market is forecast to continue to grow strongly, with an expected size of 763,5 million USD by 2029, corresponding to a compound annual growth rate (CAGR) of more than 8% in the period 2024-2029. This increase is driven by a deep coffee consumption culture, the popularity of large coffee chains, and the trend of favoring specialty and organic coffee.
To maintain and develop the market, the Vietnamese coffee industry needs to focus on solutions such as: Stabilizing area and increasing productivity, encouraging farmers to maintain coffee growing area, applying advanced farming techniques and selecting high-quality varieties to increase productivity.
Transform production towards sustainability, apply organic and environmentally friendly coffee production models to meet the green standards of the international market. Invest in technology and product quality, improve coffee quality, especially high-value varieties such as Arabica and invest in processing technology to increase product value.
With appropriate strategies, the Vietnamese coffee industry can continue to affirm its position in the world market, while ensuring sustainable development in the future.