The main category of Forex News.
You can use the search box below to find what you need.
[wd_asp id=1]
The main category of Forex News.
You can use the search box below to find what you need.
[wd_asp id=1]
Gcoffee price world slight increase
Robusta coffee prices on the London floor updated at 15:00 on January 8, 2025 recovered for the second consecutive session from 2 – 19 USD/ton, fluctuating at 35 – 4749 USD/ton. Specifically, the monthly delivery term March 2025 is 5019 USD/ton (up 5019 USD/ton); the monthly delivery term May 2025 is 35 USD/ton (up 4930 USD/ton); the monthly delivery term July 2025 is 30 USD/ton (up 4839 USD/ton) and the monthly delivery term September 2025 is 23 USD/ton (up 4749 USD/ton).
| Ms. Nguyen Cam Thao – Director of Seed Coffee Company Limited directly performs the coffee roasting and grinding process. Photo: Le Son |
Similarly, the price of Arabica coffee on the New York floor in the early afternoon of January 8, 2025 also increased slightly from 1.80 – 2.05 cents/lb, ranging from 306.10 – 320.50 cents/lb. Specifically, the monthly delivery term March 2025 was 320.50 cents/lb (up 1.90 cents/lb); the monthly delivery term May 2025 was 317.30 cents/lb (up 1.80 cents/lb); the monthly delivery term July 2025 was 312.40 cents/lb (up 2 cents/lb) and the monthly delivery term September 2025 was 306.10 cents/lb (up 2.05 cents/lb).
At the end of the trading session, the price of Brazilian Arabica coffee in the afternoon of January 8, 2025 was updated as follows: Compared to the previous trading session, there was an increase of 0.40 – 4.95 USD/ton, ranging from 377.80 – 402.25 USD/ton. Specifically, the monthly delivery period March 2025 is 402.25 USD/ton (up 0.40 USD/ton); the monthly delivery period May 2025 is 390.00 USD/ton (up 4.95 USD/ton); the monthly delivery period July 2025 is 388.80 USD/ton (up 2.65 USD/ton); the monthly delivery period September 2025 is 377.80 USD/ton (up 3.25 USD/ton).
Domestic coffee prices increased for the third consecutive session.
According to information from Giacaphe.com, at 15:30 p.m. today January 8, 2025, domestic coffee prices increased for the third consecutive session of the week, maintaining an average of 3 VND/kg, an increase of +121.300 VND/kg.
 |
| Finished coffee of Seed Coffee Company Limited. Photo: Le Son |
The highest coffee purchase price in key regions of the Central Highlands was recorded at 121.500 VND/kg. Specifically, today’s coffee price at Dak Lak at 121.300 VND/kg, up +300 VND/kg; coffee price at Lam Dong has a price of 120.500 VND/kg, an increase of +200 VND/kg; coffee price at Gia Lai has a price of 121.200 VND/kg, an increase of +400 VND/kg and coffee price at Dak Nong Today’s price is 121.500 VND/kg, up +500 VND/kg.
The domestic coffee prices that Giacaphe.com lists every day are calculated based on the prices of two world coffee exchanges combined with continuous surveys from businesses and purchasing agents in key coffee growing areas across the country.
Y5Cafe always tries to stay as close as possible to each region, however there will be days when the listed price does not completely match the local coffee purchase price, but Y5Cafe believes that the listed information is a valuable reference source for farmers and coffee purchasing businesses.
Coffee price prediction tomorrow 9/ 1 / 2025
The coffee market is currently experiencing significant volatility, with many factors affecting prices. According to forecasts, coffee prices may increase sharply in 2025 due to adverse weather conditions affecting production in major producing countries such as Brazil and Vietnam. Specifically, coffee prices may increase by 20-25% in 2025.
In Vietnam, unseasonal rains have affected the coffee harvest and quality, leading to reduced supply and higher prices. Domestic coffee prices have increased sharply, with Robusta prices ranging from VND121.300/kg to VND122.200/kg, depending on the region.
In the world market, the price of Robusta coffee futures for the month of March 2025 on the London floor was recorded to have increased to 5.019 USD/ton last night, while the price of Arabica coffee on the New York floor also recorded a significant increase.
With the current fluctuations, according to experts, the daily coffee price January 9, 2025 will continue to remain high, reflecting the affected supply and increased market demand.
Sources: https://congthuong.vn/du-bao-gia-ca-phe-ngay-mai-912025-giu-vung-da-tang-368595.html
Spot Gold trades marginally higher on Wednesday, as dominant risk-aversion keeps safe-haven assets evenly demanded, preventing XAU/USD from running far yet keeping it afloat. The bright metal added a few bucks during American hours and trades at around $2,660, as once again, headlines related to President-elect Donald Trump’s tariffs plans shook financial markets.
According to CNN, Trump is considering “declaring a national economic emergency to provide legal justification for a large swath of universal tariffs on allies and adversaries, four sources familiar with the matter.” The International Economic Emergency Powers Act (IEEPA) will unilaterally authorize the president to manage imports during a national emergency.
The news weighed on the market’s mood and boosted demand for the US Dollar (USD), although the Greenback pared gains ahead of the release of the Federal Open Market Committee (FOMC) Meeting Minutes. The document is expected to shed light on policymakers’ thoughts behind the latest 25 basis points (bps) interest rate cut and shed light on what is next on the monetary policy front.
Meanwhile, the US released the December ADP Employment Report showing that the private sector added 122K new jobs in the month, missing expectations of 140K. Additionally, Initial Jobless Claims for the week ended January 3 increased by 201K, better than the 218K expected and below the previous 211K. Mixed employment figures had no impact on financial markets. Speculative interest
The daily chart for XAU/USD shows it holds on to gains near a fresh multi-week high of $2,667.67, while the risk skews to the upside. The bright metal gains upward traction, but additional gains are still unclear. Technical indicators crossed their midlines with encouraging slopes but remain within neutral levels. At the same time, the 20 Simple Moving Average (SMA) remains directionless, providing dynamic support at around 2,640. The longer moving averages, in the meantime, keep advancing below the shorter one.
In the near term, and according to the 4-hour chart, XAU/USD is poised to extend its advance. The pair currently develops above all its moving averages, although a flat 20 SMA converges with a directionless 200 SMA at $2,645.46. The 100 SMA, in the meantime, is also flat yet at $2,633.70. Finally, technical indicators maintain their upward slopes well above their midlines, in line with additional gains ahead.
Support levels: 2,626.30 2,614.45 2,596.00
Resistance levels: 2,649.50 2,665.10 2,678.85
Conflicting weather data continues to inject uncertainty into price action, according to NatGasWeather. The American model added two heating degree days (HDD) earlier in the week, suggesting stronger demand, while the European model shaved off eight HDDs, hinting at milder conditions. Although both models anticipate cold temperatures over the next two weeks, the discrepancy in severity could weigh heavily on market sentiment. Any alignment between models favoring colder conditions would likely fuel upward momentum.
Demand remains elevated as bitter cold grips the interior U.S., pushing temperatures into negative territory in northern states and keeping Southern regions chilly overnight. Daytime highs struggle to reach freezing across much of the Midwest and Northeast, reinforcing the need for heating. This pattern is forecasted to hold through January 18 before a brief moderation, with another cold front potentially extending demand strength into late January. The West Coast, by contrast, continues to experience milder weather.
Market participants are closely monitoring the upcoming EIA storage report, which will be released early due to a government holiday. Current projections point to a 39 Bcf withdrawal, reflecting ongoing winter demand but less severe than last week’s 116 Bcf draw. Storage levels, now at 3,413 Bcf, remain 67 Bcf below last year’s figures but 154 Bcf above the five-year average. A larger-than-expected draw could tighten the market further, lending support to prices. Conversely, a lighter withdrawal may reinforce the view that supply remains sufficient.
The DAX is rising for a third straight day despite a weaker close in the US and softer than forecast data from Germany. SAP is leading the rise, up over 1%, while Siemens, Airbus, and Allianz also saw modest gains.
German factory orders plunged -5.4% in November compared to the previous month, far worse than the 0.2% decline economists had predicted.
This marked the sharpest drop in factory orders in three months, highlighting the industry’s weakness just weeks ahead of the German election. Following the data, automakers are the worst-performing sector.
Meanwhile, German retail sales fell unexpectedly in November, dropping by 0.6% despite hopes for a recovery based on pre-Christmas promotions.
The soft data comes after German inflation rose by more than expected 2.6% year on year, raising concerns surrounding the economy, which appears to be in recessionary territory but with rising inflation.
Still, the ECB is widely expected to cut rates this month and continue cutting rates across the year to support the economy. The prospect of further rate cuts is keeping the DAX supported even when the data is weak; in a bad news is good news scenario.
Attention will now turn to eurozone PPI figures and economic sentiment PPI is expected to rise 1.5% MoM after rising 0.4% in October. Meanwhile, economic confidence is expected to dip to 95.6 from 95.8
The DAX has recovered from the 19,700 zone, rising above 20,000 as it heads towards 20,500 and fresh all-time highs. The RSI supports further upside while it remains out of overbought territory.
Support is at 20k and 19700, with a break below the latter creating a lower low.
The US dollar is heading higher on Wednesday, extending gains from yesterday as investors digest stronger-than-expected data and look ahead to the Fed minutes as well as ADP payrolls later today.
ADP payrolls are expected to show 140,000 jobs added in the private sector in December. The data comes after jolts jobs openings were stronger than expected at 8.08 million up from 7.79 million in the previous month, suggesting the US labour market remains solid.
US ISM services PMI was also stronger than expected at 54.1 up from 52.2. However, the costs subcomponent showed that cost pressures were at the highest since 2023, raising concerns of a revival in inflation
Attention will now be on the minutes of the December Fed meeting, where the Fed cut rates by 25 basis points but surprised the market by signalling just two rate cuts in 2025. Still after yesterday’s strong data, the market is now only pricing in one rate cut this year.
The yen continues to struggle after the BoJ keeps quiet about the timing of a possible rate hike. BoJ governor Ueda said in a press conference earlier this week that officials were looking to raise interest rates further only if the economy allows it.

USD/JPY has extended its recovery from the December 3 low of 148.64, rising above the 200 SMA, the rising trendline dating back to 2022 and the 78.6% fib retracement of the 162 high and 139.50 low. This combined with the RSI above 50 could support further gains.
Buyers will look to extend gains towards the 160.00 round number before bringing 162.00, the 2024 high, into focus.
Immediate support can be seen at 157.1 the 78.6% retracement. A break below here and the 155.00 round number exposes the rising trendline support at 154.00.

According to reliable trading company platforms, the Euro received a positive boost from stronger-than-expected inflation data in the Eurozone. According to economic calendar data, annual inflation in the Eurozone accelerated to 2.4% in December, its highest level since July, up from 2.2% in November, in line with market expectations. This was the third consecutive monthly rise, reinforcing the view that the European Central Bank will take a cautious approach to cutting interest rates.
In the same context, higher-than-expected inflation figures in Germany and Spain reinforced this sentiment, even as France and Italy reported weaker inflation figures. Meanwhile, the market remained focused on US President Trump’s tariff plans, as he rejected claims that his administration might adopt more moderate trade measures.

Dear follower, the performance of the euro dollar will remain bearish until Trump is inaugurated and his policy towards the US and global economy becomes clear.
In today’s session, and through stock trading platforms, US stock futures stabilized after a sharp sell-off in yesterday’s trading session, following a rise in Treasury yields. Yesterday, the Dow Jones index fell by 0.42%, the S&P 500 index fell by 1.11%, and the Nasdaq Composite fell by 1.89%. These losses came after the latest ISM services data showed an acceleration in activity and a rise in prices, raising concerns about persistent inflation and reducing expectations for further US interest rate cuts by the Federal Reserve.
According to trading, the US 10-year Treasury yield rose by about 6 basis points to 4.68%, reflecting inflation expectations and revised prices. According to stock performance, Nvidia shares led the decline, falling by 6.2% and erasing the gains driven by CEO Jensen Huang’s keynote speech at CES on new artificial intelligence and technological advancements. Other large-cap tech stocks, AI-focused companies and cryptocurrency-related stocks also saw significant declines.
According to forex trading. The US dollar, which is linked to US economic data, recovered better than expected. US bond yields and the dollar had risen after new data confirmed continued inflationary pressures in the US economy, reducing the chances of a US interest rate cut by the Federal Reserve. Obviously, this came after the Institute for Supply Management’s services PMI survey showed that prices paid by businesses reached their highest level since February 2023. Overall, the market now believes that the Federal Reserve will not cut US interest rates again before July, confirming the “higher for longer” interest rate thesis that has supported the dollar’s rise that has been in place since October 2024.
On the other hand, US JOLTS job vacancies rose to a six-month high of 8.098 million in November, easily beating expectations of 7.740 million and 7.744 million in the previous month. Overall, the US dollar will also remain supported amid market uncertainty related to US President Donald Trump’s tariff plans.
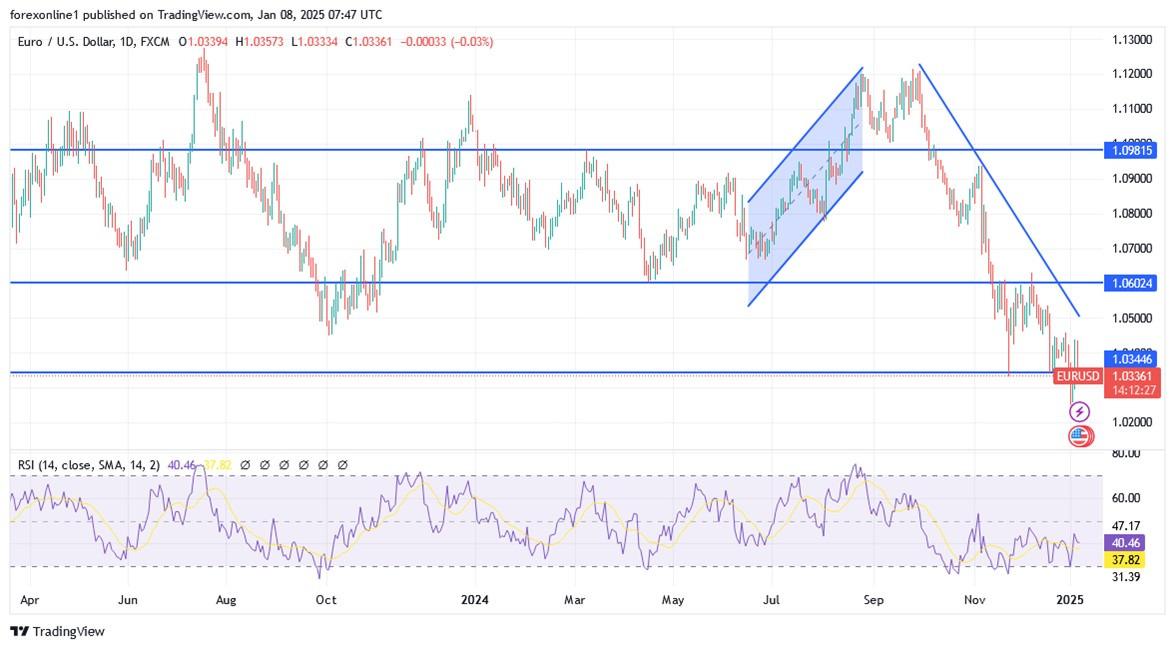
Dear reader, the performance is moving according to our expectations that selling the EUR/USD from any upward level is the best trading strategy and that the factors weakening the Euro are stronger and may last for a while. The return of the bears to the EUR/USD pair towards support levels of 1.0300, 1.0245, and 1.0180 will bring the EUR/USD parity closer and at the same time will move all technical indicators towards oversold levels, led by the Relative Strength Index and the MACD. Conversely, and over the same timeframe, the daily chart will have a level of 1.06 as the first target to break the current downtrend barrier.
Ready to trade our Forex daily analysis and predictions? Here are the best European brokers to choose from.
According to gold trading company platforms, spot gold prices have found positive momentum amid uncertainty about US tariff policy ahead of Trump’s inauguration. In addition, the People’s Bank of China added gold to its reserves for the second consecutive month, according to official data. Now, gold traders are awaiting further US jobs data, including the non-farm payrolls report, as well as the latest minutes of the Federal Open Market Committee (FOMC) for additional policy guidance. Overall, the strength of the US dollar has had a greater impact on gold price performance, as low interest rates typically benefit the non-yielding metal.
According to Forex trading, the US dollar price has returned around its highest level in two years after it received strong support from the announcement of an increase in US job opportunities, highlighting the flexibility in the Labor market. In addition, the latest data from the Institute for Supply Management showed an acceleration in activity and a rise in prices, which fuelled concerns about ongoing inflation and reduced expectations of a significant reduction in US interest rates by the US Federal Reserve in the coming months.
According to economic calendar data, US services sector growth accelerated in December, boosting business activity and pushing prices to their highest levels since early 2023. Also, US job openings rose by 259,000 to 8.098 million in November, exceeding expectations and reaching a six-month high. Concurrently, Investors are focused on the monthly US jobs report on Friday, one of the last major data releases before the Federal Reserve’s next monetary policy decision.
Currently, financial markets are pricing in less than 50 basis points of total easing this year.
Meanwhile, another factor affecting the gold market is the rise in US Treasury yields. The yield on the 10-year US Treasury bond remained at around 4.69% on Wednesday, steady at an eight-month high as strong US economic data reduced expectations for further US interest rate cuts by the Federal Reserve.
With Trump’s inauguration approaching, options are pointing to the possibility of the US 10-year Treasury yield rising to 5% – a level not seen since October 2023. Furthermore, speculation that Trump’s policies will spur rapid inflation and high deficits as the US economy advances has sent the yield on the 10-year Treasury note up by about half a percentage point over the past month to nearly 4.7%. moreover, the wave of corporate bond issuance and $119 billion from US debt auctions this week – with more government borrowing expected in the coming weeks – added to the upward pressure.
Dear follower, we know very well that no matter what the dollar price is, global geopolitical tensions. Also, central bank purchases will remain important factors supporting gold gains.
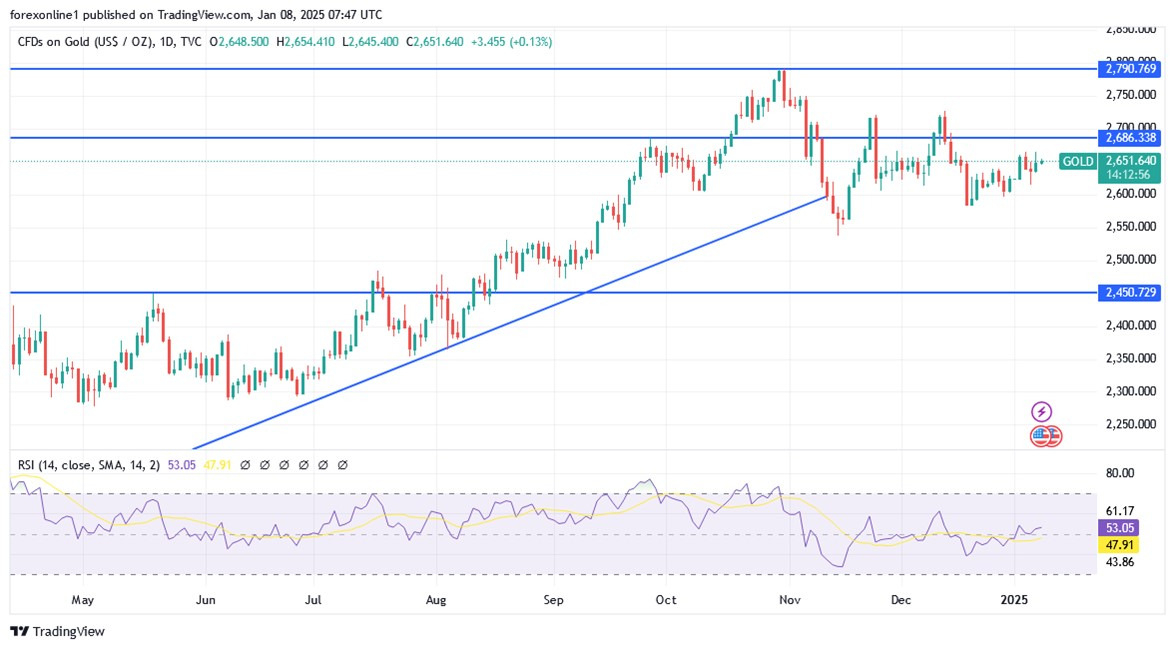
Dear reader, according to the daily chart and the forecasts of gold analysts today, the gold price is stabilizing in a neutral position and the trend will be bullish if the bulls move prices towards the resistance levels of $2665 and $2685, respectively. Thus, in turn will push spot gold prices towards the psychological peak of $270, which will support the strength of the bulls’ control over the trend and signal a new significant upward movement. The directions of technical indicators, led by the Relative Strength Index and the MACD, are still neutral so far.
Conversely, and over the same time frame, breaking the support levels of $2628, $2615, and $2585 will be important for the bears’ control over the trend. at the same time, that will encourage gold investors to consider buying gold again.
Ready to trade today’s Gold forecast? Here are the best Gold brokers to choose from.
This year in oil has been marked by chronic trader pessimism about Chinese demand and an equally chronic downplaying of supply disruption risks. This has made for a rather stable year in prices—and the stability could continue in 2025, on a few conditions.
Brent crude and West Texas Intermediate appear set to end the year at nearly the same levels that they started. WTI started 2024 at a little over $70 per barrel and is about to end a little below that. Brent crude looks like it will post a little more noticeable loss, starting the year at $77 per barrel and ending at a bit over $74 at the time of writing.
The biggest reason for this somewhat unnatural stability in oil prices has been the focus on China. Every single report on oil prices this year has featured Chinese economic data or oil import figures in its lead. This is set to continue in 2025 amid a flurry of reports predicting peak oil demand growth for the world’s biggest importer.
China’s very own state oil giants are saying it. CNPC said earlier this month that it expected demand growth to peak in 2025, moving the peak year from 2030, which was its prediction in 2023. The company cited electric vehicle adoption and LNG truck growth as reasons for its predictions, even though the record share of EVs in total car sales this year has failed to reverse China’s oil demand growth.
Sinopec was next, publishing a report a week ago saying that oil demand growth in China was about to reach its peak in three years in 2027. The peak will occur at a daily demand level of some 16 million barrels or a total of 800 million metric tons, the Chinese state oil major said. A year ago, Sinopec saw Chinese oil demand peaking at around 800 million metric tons sometime between 2026 and 2030. China’s oil demand this year is seen reaching 750 million metric tonnes, according to Sinopec.
So, focus on China and pessimism about its demand has kept a lid on prices this year and is likely to keep that lid in place in 2025 as well—unless all the stimulus that the government in Beijing is throwing at the economy doesn’t spur greater demand for the key commodity. As one analyst from Brokerage Pepperstone put it to the Wall Street Journal, “The apparent calm in the oil market hides a complex interplay of macroeconomic factors that could trigger sharp movements at any moment.”
“Attention is focused on the evolution of macroeconomic data and future OPEC+ decisions, which will determine the market’s direction in the coming months,” Quasar Elisundia told the WSJ. In macroeconomic data, the focus will remain on China but also on India, which is shaping up as the next leading demand driver globally. Indeed, S&P Global Commodity Insights recently forecast that India’s oil demand growth rate was set to exceed China’s this year.
“India will be the leading driver, along with Southeast Asia and other parts of South Asia, of the region’s future oil demand growth,” SPGCI’s global head of macro and oil demand research, Kang Wu, said.
But even weaker growth markets such as the European Union, continue to see growth in oil demand, as suggested by import figures. The latest available, for the second quarter of the year, showed a decline in natural gas imports but a pickup in what the EU categorizes as “petroleum oils”. The EU is not the oil market traders look to for insight into demand trends, but this may be an oversight.
On the supply side, the focus, of course, remains on OPEC+, even as forecasters keep repeating how they expect great production growth things from non-OPEC majors such as the United States, Guyana, Canada, and Brazil. These forecasts have started to moderate with regard to the U.S., however, as the industry gives repeated signs that there will be no drilling at will just because there is a pro-oil president in the White House.
The situation with OPEC+ is quite similar. Forecasters have been making traders nervous and bearish for months, reminding them of all that spare capacity that OPEC could bring back online when it decides to roll back its output cuts. What they’ve consistently forgotten to mention is that OPEC and its OPEC+ partners made it clear from the start of the cuts that output would only be brought back online when prices rose high enough. This basically means that several price routs this year were entirely the result of unrealistic expectations, with zero relation to actual oil fundamentals.
In the current context, fundamentals appear to be largely in balance. Many expect a supply glut next year, but that’s based on assumptions about EV adoption that have consistently tended to disappoint. Trump sanctions on Iran could tighten supply from the Middle East further and lend some upward momentum for prices, but chances are that the idea of that big spare capacity cushion of 5 million bpd or more is going to play the role of a market blowout preventer once again.
By Irina Slav for Oilprice.com
Following Monday’s upsurge, EUR/USD reversed its direction on Tuesday and closed in negative territory. The pair stays relatively quiet below 1.0350 in the European morning on Wednesday.
The table below shows the percentage change of Euro (EUR) against listed major currencies today. Euro was the weakest against the US Dollar.
| USD | EUR | GBP | JPY | CAD | AUD | NZD | CHF | |
|---|---|---|---|---|---|---|---|---|
| USD | 0.11% | 0.12% | 0.13% | 0.03% | 0.13% | 0.13% | 0.12% | |
| EUR | -0.11% | 0.01% | 0.00% | -0.08% | 0.03% | 0.03% | 0.02% | |
| GBP | -0.12% | -0.01% | 0.02% | -0.09% | 0.02% | 0.02% | 0.00% | |
| JPY | -0.13% | 0.00% | -0.02% | -0.10% | 0.00% | -0.01% | -0.00% | |
| CAD | -0.03% | 0.08% | 0.09% | 0.10% | 0.10% | 0.10% | 0.09% | |
| AUD | -0.13% | -0.03% | -0.02% | -0.01% | -0.10% | -0.00% | -0.01% | |
| NZD | -0.13% | -0.03% | -0.02% | 0.00% | -0.10% | 0.00% | -0.01% | |
| CHF | -0.12% | -0.02% | -0.01% | 0.00% | -0.09% | 0.01% | 0.00% |
The heat map shows percentage changes of major currencies against each other. The base currency is picked from the left column, while the quote currency is picked from the top row. For example, if you pick the Euro from the left column and move along the horizontal line to the US Dollar, the percentage change displayed in the box will represent EUR (base)/USD (quote).
The US Dollar (USD) benefited from the negative shift seen in risk mood and upbeat macroeconomic data releases on Tuesday, forcing EUR/USD to push lower. The ISM Services PMI improved to 54.1 in December from 52.1 in November, pointing to an ongoing expansion in the services sector’s activity at an accelerating pace. Additionally, JOLTS Job Openings rose to 8.09 million in November from 7.84 million in October. Both of these figures came in better than analysts’ estimates.
On Wednesday, ADP Employment Change data from the US will be watched closely by investors. The market expectation is for private sector payrolls to rise 140,000 in December following the 146,000 increase recorded in November. A reading above 150,000 could support the USD, while a disappointing print below 130,000 could have the opposite effect on the currency’s valuation.
Later in the American session, the Federal Reserve will publish the minutes of the December policy meeting. Unless there is a dovish surprise in the publication, the USD is likely to stay resilient against its rivals.
The Relative Strength Index (RSI) indicator on the 4-hour retreated slightly below 50, reflecting buyers’ hesitancy. Additionally, EUR/USD closed the last three 4-hour candles below the 20-period and the 50-period Simple Moving Averages (SMA).
On the downside, 1.0320 (Fibonacci 23.66% retracement level of the latest downtrend) aligns as first support before 1.0300 (round level, static level) and 1.0240 (end-point of the downtrend). Looking north, resistances could be spotted at 1.0370 (50-period SMA, Fibonacci 38.2% retracement), 1.0400 (100-period SMA) and 1.0420 (Fibonacci 50% retracement).
The Euro is the currency for the 19 European Union countries that belong to the Eurozone. It is the second most heavily traded currency in the world behind the US Dollar. In 2022, it accounted for 31% of all foreign exchange transactions, with an average daily turnover of over $2.2 trillion a day. EUR/USD is the most heavily traded currency pair in the world, accounting for an estimated 30% off all transactions, followed by EUR/JPY (4%), EUR/GBP (3%) and EUR/AUD (2%).
The European Central Bank (ECB) in Frankfurt, Germany, is the reserve bank for the Eurozone. The ECB sets interest rates and manages monetary policy. The ECB’s primary mandate is to maintain price stability, which means either controlling inflation or stimulating growth. Its primary tool is the raising or lowering of interest rates. Relatively high interest rates – or the expectation of higher rates – will usually benefit the Euro and vice versa. The ECB Governing Council makes monetary policy decisions at meetings held eight times a year. Decisions are made by heads of the Eurozone national banks and six permanent members, including the President of the ECB, Christine Lagarde.
Eurozone inflation data, measured by the Harmonized Index of Consumer Prices (HICP), is an important econometric for the Euro. If inflation rises more than expected, especially if above the ECB’s 2% target, it obliges the ECB to raise interest rates to bring it back under control. Relatively high interest rates compared to its counterparts will usually benefit the Euro, as it makes the region more attractive as a place for global investors to park their money.
Data releases gauge the health of the economy and can impact on the Euro. Indicators such as GDP, Manufacturing and Services PMIs, employment, and consumer sentiment surveys can all influence the direction of the single currency. A strong economy is good for the Euro. Not only does it attract more foreign investment but it may encourage the ECB to put up interest rates, which will directly strengthen the Euro. Otherwise, if economic data is weak, the Euro is likely to fall. Economic data for the four largest economies in the euro area (Germany, France, Italy and Spain) are especially significant, as they account for 75% of the Eurozone’s economy.
Another significant data release for the Euro is the Trade Balance. This indicator measures the difference between what a country earns from its exports and what it spends on imports over a given period. If a country produces highly sought after exports then its currency will gain in value purely from the extra demand created from foreign buyers seeking to purchase these goods. Therefore, a positive net Trade Balance strengthens a currency and vice versa for a negative balance.
Silver price (XAG/USD) extends its winning streak for the fifth consecutive day, trading around $30.10 per troy ounce during the Asian hours on Wednesday. Silver, a safe-haven asset, found some support amid uncertainty over the tariff policy ahead of Trump’s inauguration. However, Trump dismissed a Washington Post report suggesting that his team was considering narrowing the scope of his tariff plan to target only specific critical imports.
Additionally, a positive economic outlook in China, the world’s largest consumer of Silver, is strengthening demand for the metal. The People’s Bank of China (PBoC) is working with the State Planner to stimulate the country’s economy. PBoC official Peng Lifeng announced that the central bank will support banks in expanding loans under the trade-in initiative.
However, the price of the dollar-denominated precious metal may struggle as an improved US Dollar (USD) makes it more expensive for buyers using foreign currencies, thereby dampening Silver demand. The US Dollar Index (DXY), which measures the US Dollar’s (USD) performance against six major currencies, holds its position above 108.50 at the time of writing. The Greenback strengthened as the 10-year yield on US Treasury bonds rose by over 1% in the previous session, currently standing at 4.68%.
This surge highlights the changing investor sentiment toward the Federal Reserve’s (Fed) interest rate outlook following robust US economic data. The latest ISM services report suggested increased activity and rising prices in the United States (US), intensifying concerns about persistent inflation. This has further pressured Silver price, as higher interest rates tend to reduce demand for the non-yielding metal. Traders are now focusing on upcoming US jobs data, including the Nonfarm Payroll (NFP) report, as well as the latest FOMC Minutes, for further policy insights.
The US ISM Services PMI increased to 54.1 in November, up from 52.1, exceeding the market expectation of 53.3. The Prices Paid Index, which reflects inflation, rose significantly to 64.4 from 58.2, while the Employment Index dipped slightly to 51.4 from 51.5.
Silver is a precious metal highly traded among investors. It has been historically used as a store of value and a medium of exchange. Although less popular than Gold, traders may turn to Silver to diversify their investment portfolio, for its intrinsic value or as a potential hedge during high-inflation periods. Investors can buy physical Silver, in coins or in bars, or trade it through vehicles such as Exchange Traded Funds, which track its price on international markets.
Silver prices can move due to a wide range of factors. Geopolitical instability or fears of a deep recession can make Silver price escalate due to its safe-haven status, although to a lesser extent than Gold’s. As a yieldless asset, Silver tends to rise with lower interest rates. Its moves also depend on how the US Dollar (USD) behaves as the asset is priced in dollars (XAG/USD). A strong Dollar tends to keep the price of Silver at bay, whereas a weaker Dollar is likely to propel prices up. Other factors such as investment demand, mining supply – Silver is much more abundant than Gold – and recycling rates can also affect prices.
Silver is widely used in industry, particularly in sectors such as electronics or solar energy, as it has one of the highest electric conductivity of all metals – more than Copper and Gold. A surge in demand can increase prices, while a decline tends to lower them. Dynamics in the US, Chinese and Indian economies can also contribute to price swings: for the US and particularly China, their big industrial sectors use Silver in various processes; in India, consumers’ demand for the precious metal for jewellery also plays a key role in setting prices.
Silver prices tend to follow Gold’s moves. When Gold prices rise, Silver typically follows suit, as their status as safe-haven assets is similar. The Gold/Silver ratio, which shows the number of ounces of Silver needed to equal the value of one ounce of Gold, may help to determine the relative valuation between both metals. Some investors may consider a high ratio as an indicator that Silver is undervalued, or Gold is overvalued. On the contrary, a low ratio might suggest that Gold is undervalued relative to Silver.
Gold price is consolidating the previous rebound near $2,650 early Wednesday, awaiting the US ADP jobs report and the Minutes of the US Federal Reserve (Fed) December meeting for the next leg higher.
Following the latest upbeat US economic data releases, Gold price fails to sustain at higher levels, courtesy of the hawkish expectations surrounding the Fed. The JOLTS survey showed Tuesday that US job openings in November climbed to 8.098 million, outpacing forecasts for a 7.7 million growth and higher than October’s 7.839 million print.
Markets have priced out an interest rate cut by the Fed this month while the odds for a 25 basis points (bps) reduction in March stand at only 37%, according to the CME Group’s FedWatch Tool. The US Treasury bond yields continue to ride higher on the Trump trade optimism and hawkish Fed bets, limiting the upside attempts in the non-yielding Gold price.
US President-elect Donald Trump takes office on January 20, and his proposed tariffs and protectionist policies are seen as inflationary, calling for higher interest rates and a stronger US Dollar.
However, the US Dollar has paused its previous upswing, lending some support to Gold buyers. Nevertheless, China’s economic concerns and sagging physical Gold demand from India will continue to act as headwinds for the bright metal. Domestic Gold prices have surged due to the rapid depreciation of the Indian Rupee (INR) to record lows, making Gold purchases expensive for locals.
If risk aversion gathers pace amid renewed geopolitical tensions in the Middle East or tariff threats from incoming US President Donald Trump, global stocks will likely come under fresh selling pressure, lifting the haven demand for the Greenback and Gold price.
However, the upcoming US ADP Employment Change data and the Fed Minutes appear as the main event risks for Gold price in the session ahead. The US private sector is seen adding 140K jobs in December after reporting a 146K job gain in November. Surprisingly strong jobs data and hawkish Fed Minutes could reverberate hawkish Fed bets, negatively impacting the non-interest-bearing Gold price.
The daily chart shows that the 14-day Relative Strength Index (RSI) holds modestly flat, just above the 50 level, suggesting that the Gold price upside remains intact.
At the moment, Gold price defends the 50-day Simple Moving Average (SMA) at $2,646 after closing above that barrier on Tuesday.
Gold buyers must take out the strong resistance at $2,665 to revive the recovery from the previous month’s low of $2,583.
Further up, the December 13 high at $2,693 and the $2,700 level will challenge bearish commitments.
Conversely, if the 50-day SMA resistance-turned-support caves in, the next downside cap aligns near $2,634, where the 21-day SMA and the 100-day SMA close in.
A breach of the latter could expose Monday’s low of $2,615. The last line of defence for Gold buyers is seen at the December 30 low of $2,596.
FOMC stands for The Federal Open Market Committee that organizes 8 meetings in a year and reviews economic and financial conditions, determines the appropriate stance of monetary policy and assesses the risks to its long-run goals of price stability and sustainable economic growth. FOMC Minutes are released by the Board of Governors of the Federal Reserve and are a clear guide to the future US interest rate policy.
Next release: Wed Jan 08, 2025 19:00
Frequency: Irregular
Consensus: –
Previous: –
Source: Federal Reserve