The main category of Forex News.
You can use the search box below to find what you need.
[wd_asp id=1]
The main category of Forex News.
You can use the search box below to find what you need.
[wd_asp id=1]
After losing nearly 1% on Wednesday, GBP/USD extended its slide and touched its lowest level since November 2023 below 1.2250 in the early European session on Thursday. The pair remains deep in negative territory below 1.2300 despite recovering slightly in the last hour.
The table below shows the percentage change of British Pound (GBP) against listed major currencies this week. British Pound was the weakest against the Canadian Dollar.
| USD | EUR | GBP | JPY | CAD | AUD | NZD | CHF | |
|---|---|---|---|---|---|---|---|---|
| USD | 0.08% | 1.11% | 0.63% | -0.45% | 0.42% | 0.51% | 0.24% | |
| EUR | -0.08% | 1.02% | 0.52% | -0.46% | 0.38% | 0.47% | 0.19% | |
| GBP | -1.11% | -1.02% | -0.51% | -1.46% | -0.63% | -0.54% | -0.81% | |
| JPY | -0.63% | -0.52% | 0.51% | -1.06% | -0.17% | -0.08% | -0.16% | |
| CAD | 0.45% | 0.46% | 1.46% | 1.06% | 0.80% | 0.91% | 0.66% | |
| AUD | -0.42% | -0.38% | 0.63% | 0.17% | -0.80% | 0.09% | -0.19% | |
| NZD | -0.51% | -0.47% | 0.54% | 0.08% | -0.91% | -0.09% | -0.27% | |
| CHF | -0.24% | -0.19% | 0.81% | 0.16% | -0.66% | 0.19% | 0.27% |
The heat map shows percentage changes of major currencies against each other. The base currency is picked from the left column, while the quote currency is picked from the top row. For example, if you pick the British Pound from the left column and move along the horizontal line to the US Dollar, the percentage change displayed in the box will represent GBP (base)/USD (quote).
The broad-based US Dollar (USD) strength and a bout of selloff in British government bonds triggered a sharp decline in GBP/USD. The yield on the 10-year UK gilt climbed to its highest level in over 16 years and the yield on the 30-year reached its strongest level since 1998 early Thursday.
Assessing the latest developments in the UK gilt market, “this is a global move but it’s being led by the UK,” said RBC Capital Markets’ fixed income strategist Megum Muhic.
“Potentially, a reason why is the technical break is more significant versus other jurisdictions. The UK is at highs of this cycle whereas in Europe and the US this isn’t the case. We’re in new uncharted territory,” Muhic added, per Reuters.
On the other hand, the US Dollar (USD) benefited from the risk-averse market atmosphere and put additional weight on GBP/USD’s shoulders. Citing four sources familiar with the matter, CNN reported on Wednesday that Trump is considering declaring a national economic emergency to allow for a new tariff program, reviving concerns over an aggressive tariff policy stoking inflation.
Stock markets in the US will remain closed and bond markets will close early on Thursday, in observance of a national day of mourning to honor the death of former President Jimmy Carter.
Later in the day, several Federal Reserve (Fed) officials are scheduled to deliver speeches. In case policymakers underline the need for a slowdown in the pace of rate cuts amid the uncertainty surrounding the inflation outlook, the USD is likely to preserve its strength. On Friday, the US Bureau of Labor Statistics will release the December jobs report, which will include Nonfarm Payrolls and Unemployment Rate figures.
GBP/USD recovered after dipping below the lower limit of the descending regression channel coming from December 9. Meanwhile, the Relative Strength Index (RSI) indicator on the 4-hour chart rose slightly above 30, suggesting that the pair’s bearish bias remains intact after staging a technical correction from oversold levels.
On the downside, static support seems to have formed at 1.2250 ahead of 1.2200 (static level, round level) and 1.2140 (static level from November 2023). Looking north, first resistance could be spotted at 1.2350 (former support, static level) before 1.2400 (round level, mid-point of the descending channel).
UK Gilt Yields measure the annual return an investor can expect from holding UK government bonds, or Gilts. Like other bonds, Gilts pay interest to holders at regular intervals, the ‘coupon’, followed by the full value of the bond at maturity. The coupon is fixed but the Yield varies as it takes into account changes in the bond’s price. For example, a Gilt worth 100 Pounds Sterling might have a coupon of 5.0%. If the Gilt’s price were to fall to 98 Pounds, the coupon would still be 5.0%, but the Gilt Yield would rise to 5.102% to reflect the decline in price.
Many factors influence Gilt yields, but the main ones are interest rates, the strength of the British economy, the liquidity of the bond market and the value of the Pound Sterling. Rising inflation will generally weaken Gilt prices and lead to higher Gilt yields because Gilts are long-term investments susceptible to inflation, which erodes their value. Higher interest rates impact existing Gilt yields because newly-issued Gilts will carry a higher, more attractive coupon. Liquidity can be a risk when there is a lack of buyers or sellers due to panic or preference for riskier assets.
Probably the most important factor influencing the level of Gilt yields is interest rates. These are set by the Bank of England (BoE) to ensure price stability. Higher interest rates will raise yields and lower the price of Gilts because new Gilts issued will bear a higher, more attractive coupon, reducing demand for older Gilts, which will see a corresponding decline in price.
Inflation is a key factor affecting Gilt yields as it impacts the value of the principal received by the holder at the end of the term, as well as the relative value of the repayments. Higher inflation deteriorates the value of Gilts over time, reflected in a higher yield (lower price). The opposite is true of lower inflation. In rare cases of deflation, a Gilt may rise in price – represented by a negative yield.
Foreign holders of Gilts are exposed to exchange-rate risk since Gilts are denominated in Pound Sterling. If the currency strengthens investors will realize a higher return and vice versa if it weakens. In addition, Gilt yields are highly correlated to the Pound Sterling. This is because yields are a reflection of interest rates and interest rate expectations, a key driver of Pound Sterling. Higher interest rates, raise the coupon on newly-issued Gilts, attracting more global investors. Since they are priced in Pounds, this increases demand for Pound Sterling.
EUR/USD stays on the back foot and trades slightly below 1.0300 in the European morning on Thursday after closing the second consecutive day in negative territory on Wednesday. The risk-averse market atmosphere makes it difficult for the pair to stage a rebound, while the technical outlook suggests that the bearish bias remains intact.
The table below shows the percentage change of Euro (EUR) against listed major currencies this week. Euro was the weakest against the Canadian Dollar.
| USD | EUR | GBP | JPY | CAD | AUD | NZD | CHF | |
|---|---|---|---|---|---|---|---|---|
| USD | 0.17% | 1.30% | 0.68% | -0.36% | 0.60% | 0.71% | 0.32% | |
| EUR | -0.17% | 1.11% | 0.49% | -0.47% | 0.46% | 0.57% | 0.19% | |
| GBP | -1.30% | -1.11% | -0.64% | -1.56% | -0.64% | -0.54% | -0.91% | |
| JPY | -0.68% | -0.49% | 0.64% | -1.04% | -0.07% | 0.06% | -0.14% | |
| CAD | 0.36% | 0.47% | 1.56% | 1.04% | 0.89% | 1.02% | 0.66% | |
| AUD | -0.60% | -0.46% | 0.64% | 0.07% | -0.89% | 0.12% | -0.27% | |
| NZD | -0.71% | -0.57% | 0.54% | -0.06% | -1.02% | -0.12% | -0.38% | |
| CHF | -0.32% | -0.19% | 0.91% | 0.14% | -0.66% | 0.27% | 0.38% |
The heat map shows percentage changes of major currencies against each other. The base currency is picked from the left column, while the quote currency is picked from the top row. For example, if you pick the Euro from the left column and move along the horizontal line to the US Dollar, the percentage change displayed in the box will represent EUR (base)/USD (quote).
The US Dollar (USD) capitalized on safe-haven flows amid growing concerns over US President-elect Donald Trump introducing an aggressive tariff policy. Citing four sources familiar with the matter, CNN reported on Wednesday that Trump is considering declaring a national economic emergency to allow for a new tariff program.
Stock markets in the US will remain closed and bond markets will close early on Thursday, in observance of a national day of mourning to honor the death of former President Jimmy Carter.
In the second half of the day, several Federal Reserve (Fed) policymakers will be delivering speeches. In case officials reiterate the need for a slowdown in policy easing amid the uncertainty surrounding the impact of tariffs on the inflation outlook, the USD is likely to preserve its strength. On Friday, the US Bureau of Labor Statistics will release the December jobs report, which will include Nonfarm Payrolls and Unemployment Rate figures.
In the meantime, Pound Sterling (GBP) remains under heavy selling pressure as the UK gilt selloff continues. EUR/GBP cross is up more than 0.5% on the day after rising 0.7% on Wednesday, suggesting that the Euro is able to capture some of the capital outflows out of the GBP. In case EUR/GBP continues to push higher, EUR/USD’s downside could remain limited.
The Relative Strength Index (RSI) indicator on the 4-hour chart declined below 40, reflecting a buildup in bearish momentum. In the downside, 1.0240 (end-point of the latest downtrend) aligns as next support before 1.0200 (round level, static level).
In case EUR/USD manages to stabilize above 1.0320 (Fibonacci 23.6% retracement of the latest downtrend), 1.0350 (20-period Simple Moving Average (SMA), 50-period SMA) and 1.0375 (Fibonacci 38.2% retracement) could be seen as next resistance levels.
The Euro is the currency for the 19 European Union countries that belong to the Eurozone. It is the second most heavily traded currency in the world behind the US Dollar. In 2022, it accounted for 31% of all foreign exchange transactions, with an average daily turnover of over $2.2 trillion a day. EUR/USD is the most heavily traded currency pair in the world, accounting for an estimated 30% off all transactions, followed by EUR/JPY (4%), EUR/GBP (3%) and EUR/AUD (2%).
The European Central Bank (ECB) in Frankfurt, Germany, is the reserve bank for the Eurozone. The ECB sets interest rates and manages monetary policy. The ECB’s primary mandate is to maintain price stability, which means either controlling inflation or stimulating growth. Its primary tool is the raising or lowering of interest rates. Relatively high interest rates – or the expectation of higher rates – will usually benefit the Euro and vice versa. The ECB Governing Council makes monetary policy decisions at meetings held eight times a year. Decisions are made by heads of the Eurozone national banks and six permanent members, including the President of the ECB, Christine Lagarde.
Eurozone inflation data, measured by the Harmonized Index of Consumer Prices (HICP), is an important econometric for the Euro. If inflation rises more than expected, especially if above the ECB’s 2% target, it obliges the ECB to raise interest rates to bring it back under control. Relatively high interest rates compared to its counterparts will usually benefit the Euro, as it makes the region more attractive as a place for global investors to park their money.
Data releases gauge the health of the economy and can impact on the Euro. Indicators such as GDP, Manufacturing and Services PMIs, employment, and consumer sentiment surveys can all influence the direction of the single currency. A strong economy is good for the Euro. Not only does it attract more foreign investment but it may encourage the ECB to put up interest rates, which will directly strengthen the Euro. Otherwise, if economic data is weak, the Euro is likely to fall. Economic data for the four largest economies in the euro area (Germany, France, Italy and Spain) are especially significant, as they account for 75% of the Eurozone’s economy.
Another significant data release for the Euro is the Trade Balance. This indicator measures the difference between what a country earns from its exports and what it spends on imports over a given period. If a country produces highly sought after exports then its currency will gain in value purely from the extra demand created from foreign buyers seeking to purchase these goods. Therefore, a positive net Trade Balance strengthens a currency and vice versa for a negative balance.
Silver price (XAG/USD) continues its upward momentum, rising for the sixth consecutive day to trade near $30.10 per troy ounce, close to three-week highs during Thursday’s Asian session. The precious metal, often considered a safe-haven asset, gains support amid uncertainty surrounding inflation and potential tariffs under President-elect Trump’s administration, as highlighted by the US Federal Reserve (Fed).
In addition, robust growth in 2024 has boosted industrial demand for Silver, which is on track to surpass 700 million ounces (Moz) for the first time. This surge is driven by its critical role in solar technology, electric vehicles (EVs), 5G networks, and consumer electronics, positioning Silver as a vital material for advancing innovation and supporting the transition to clean energy solutions.
Moreover, heightened geopolitical tensions have added to market volatility, prompting investors to turn to precious metals like Silver for stability. According to Reuters, a Russian-guided bomb attack on Wednesday claimed the lives of at least 13 people and injured 63 others in Ukraine’s southeastern city of Zaporizhzhia, further fueling safe-haven demand.
The upside of the non-yielding metal could be limited as long-term US bond yields continue climbing on heavy supply. The 10-year rose to 4.73%, while the 30-year approached 4.96% on Wednesday following the Federal Open Market Committee (FOMC) Minutes from the December meeting.
FOMC Minutes showed that Fed policymakers expressed concern about inflation and the impact that President-elect Donald Trump’s policies could have. Fed officials indicated they would be moving more slowly on rate reductions because of the uncertainty. Fed officials penciled the expected cuts in 2025 to two from four in the previous estimate at September’s meeting.
Silver is a precious metal highly traded among investors. It has been historically used as a store of value and a medium of exchange. Although less popular than Gold, traders may turn to Silver to diversify their investment portfolio, for its intrinsic value or as a potential hedge during high-inflation periods. Investors can buy physical Silver, in coins or in bars, or trade it through vehicles such as Exchange Traded Funds, which track its price on international markets.
Silver prices can move due to a wide range of factors. Geopolitical instability or fears of a deep recession can make Silver price escalate due to its safe-haven status, although to a lesser extent than Gold’s. As a yieldless asset, Silver tends to rise with lower interest rates. Its moves also depend on how the US Dollar (USD) behaves as the asset is priced in dollars (XAG/USD). A strong Dollar tends to keep the price of Silver at bay, whereas a weaker Dollar is likely to propel prices up. Other factors such as investment demand, mining supply – Silver is much more abundant than Gold – and recycling rates can also affect prices.
Silver is widely used in industry, particularly in sectors such as electronics or solar energy, as it has one of the highest electric conductivity of all metals – more than Copper and Gold. A surge in demand can increase prices, while a decline tends to lower them. Dynamics in the US, Chinese and Indian economies can also contribute to price swings: for the US and particularly China, their big industrial sectors use Silver in various processes; in India, consumers’ demand for the precious metal for jewellery also plays a key role in setting prices.
Silver prices tend to follow Gold’s moves. When Gold prices rise, Silver typically follows suit, as their status as safe-haven assets is similar. The Gold/Silver ratio, which shows the number of ounces of Silver needed to equal the value of one ounce of Gold, may help to determine the relative valuation between both metals. Some investors may consider a high ratio as an indicator that Silver is undervalued, or Gold is overvalued. On the contrary, a low ratio might suggest that Gold is undervalued relative to Silver.
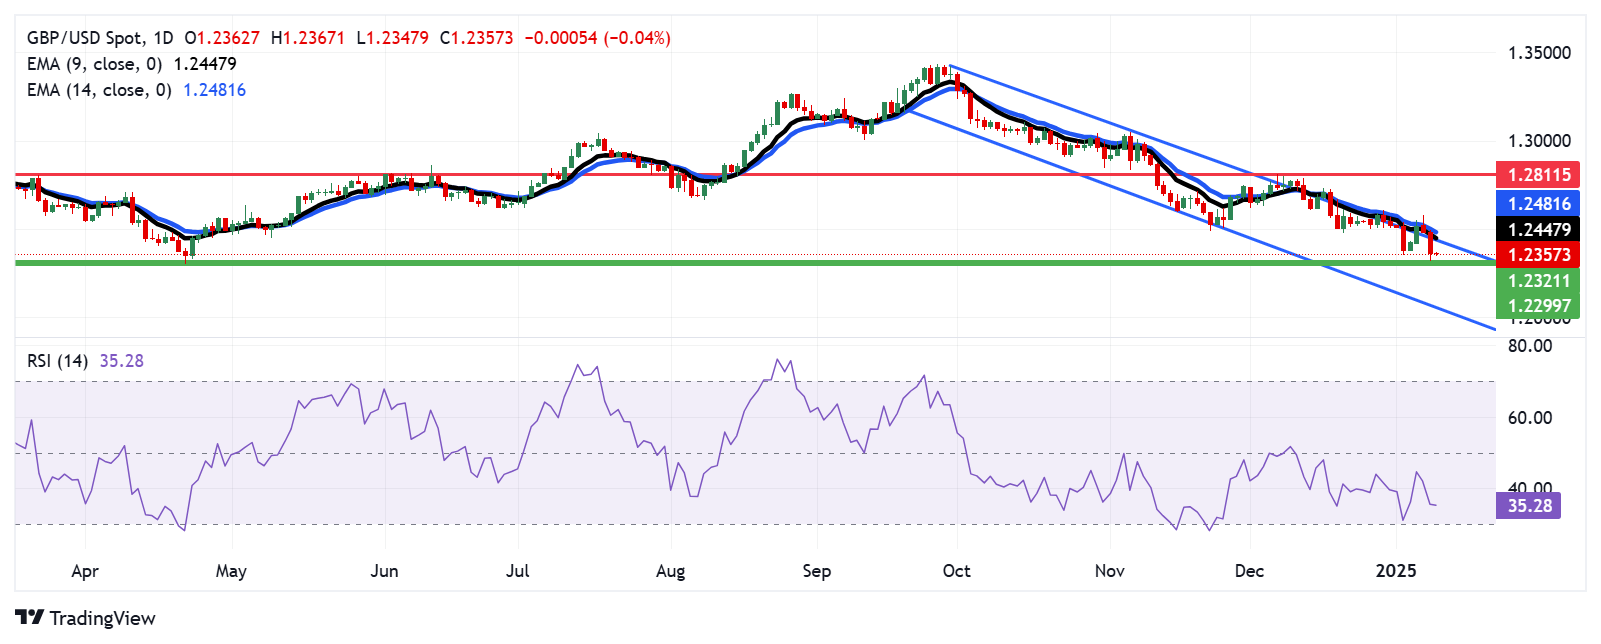
GBP/USD has retreated into the descending channel pattern, signaling a dominant bearish bias.
The pair could test the nine-month low at 1.2321, recorded on Wednesday.
The immediate resistance appears at the descending channel’s upper boundary, near the nine-day EMA at 1.2447.
The GBP/USD pair remains under pressure for the third consecutive session, hovering near 1.2360 during Thursday’s Asian trading hours. Technical analysis of the daily chart highlights a prevailing bearish bias, with the pair falling back to the descending channel pattern.
The 14-day Relative Strength Index (RSI) approaches the 30 mark, signaling intensified bearish momentum. Additionally, the GBP/USD pair trades below the nine- and 14-day Exponential Moving Averages (EMAs), reflecting weak short-term price dynamics.
On the downside, the GBP/USD pair could test the nine-month low of 1.2321, recorded on January 8, followed by the next support level at 1.2299, the lowest since November 2023, last observed on April 22. A break below this level could strengthen bearish sentiment, potentially driving the pair toward the lower boundary of the descending channel near 1.2050.
On the upside, the GBP/USD pair may encounter immediate resistance at the descending channel’s upper boundary, near the nine-day EMA at 1.2447, followed by the 14-day EMA at 1.2481. A decisive breakout above this critical resistance zone could enhance short-term price momentum, paving the way for a potential move toward the two-month high of 1.2811, reached on December 6.
The table below shows the percentage change of British Pound (GBP) against listed major currencies today. British Pound was the weakest against the Japanese Yen.
| USD | EUR | GBP | JPY | CAD | AUD | NZD | CHF | |
|---|---|---|---|---|---|---|---|---|
| USD | -0.03% | 0.04% | -0.27% | -0.12% | 0.14% | 0.06% | -0.19% | |
| EUR | 0.03% | 0.07% | -0.23% | -0.09% | 0.18% | 0.09% | -0.16% | |
| GBP | -0.04% | -0.07% | -0.33% | -0.16% | 0.10% | 0.03% | -0.21% | |
| JPY | 0.27% | 0.23% | 0.33% | 0.14% | 0.41% | 0.29% | 0.10% | |
| CAD | 0.12% | 0.09% | 0.16% | -0.14% | 0.27% | 0.18% | -0.05% | |
| AUD | -0.14% | -0.18% | -0.10% | -0.41% | -0.27% | -0.09% | -0.31% | |
| NZD | -0.06% | -0.09% | -0.03% | -0.29% | -0.18% | 0.09% | -0.22% | |
| CHF | 0.19% | 0.16% | 0.21% | -0.10% | 0.05% | 0.31% | 0.22% |
The heat map shows percentage changes of major currencies against each other. The base currency is picked from the left column, while the quote currency is picked from the top row. For example, if you pick the British Pound from the left column and move along the horizontal line to the US Dollar, the percentage change displayed in the box will represent GBP (base)/USD (quote).
Gold price pulls back from a monthly high of $2,670 set on Wednesday as buyers turn cautious after discouraging China’s inflation data and the hawkish Federal Reserve (Fed) Minutes. All eyes now remain on a bunch of Fed speakers due to speak later amid US holiday-thinned market conditions.
China’s Consumer Price Index (CPI) inflation slowed to 0.1% annually in December from 0.2% in November, aligning with the market estimates while the Producer Price Index (PPI) fell 2.3% year-on-year (YoY) in December, slower than the 2.5% fall in November and coming in as expected.
Slowing Chinese inflation suggested a weakening domestic demand in the world’s biggest consumer, accentuating the economic concerns despite several stimulus efforts by the authorities. Growing China’s economic worries add to the pullback in the Gold price as the dragon nation is the world’s top Gold consumer.
Further, Gold price bears the brunt of the recent US Dollar (USD) upswing and elevated US Treasury bond yields amid a slew of strong US data, including the JOLTS Job Openings survey, Jobless Claims and ISM Manufacturing and Services PMI, which continues to back the case for fewer interest rate cuts by the Fed this year.
Additionally, the hawkish Minutes of the Fed’s December meeting offset the weak US ADP Employment Change data on Wednesday, allowing Gold sellers to stage a comeback after two straight days of gains. The Minutes showed that Fed policymakers expressed concern about inflation and the impact of US President-elect Donald Trump’s immigration and trade policies, suggesting that they would be moving more slowly on rate cuts.
Looking ahead, Gold traders will closely scrutinize speeches from Richmond Fed President Tom Barkin, Kansas Fed President Jeffery Schmid and Fed Governor Michelle Bowman for fresh insights on the US central bank’s future rate cuts.
However, speculations surrounding incoming US President Trump’s tariff plans will continue to rock Gold markets, with moves likely to be exaggerated by a partial US holiday on account of a national day of mourning for former President Jimmy Carter.
On Wednesday, citing four sources familiar with the matter, CNN News reported that US President-elect Donald Trump is considering declaring a national economic emergency to allow for a new tariff program by using the International Economic Emergency Powers Act, known as “IEEPA. The headline triggered a sharp US Dollar advance, notwithstanding the weaker-than-expected US ADP private payrolls data, which came in at 122K in December, against a 140K print expected.
The daily chart shows that the 14-day Relative Strength Index (RSI) has turned lower toward the midline, though holding well above it. This suggests that Gold buyers could be facing some exhaustion.
Adding credence to the dwindling recovery momentum, the 21-day Simple Moving Average (SMA) is set to cross the 100-day SMA from above, which, if materialized on a daily closing basis, would validate a Bear Cross.
If the Gold price correction extends, the initial demand area will be seen at the 50-day SMA of $2,644. A sustained move below that level will challenge the confluence of the 21-day SMA and the 100-day SMA at $2,632.
Deeper declines will call for a test of the January 6 low of $2,615, followed by the $2,600 round level.
On the other hand, should Gold buyers jump back on the bids, the $2,665 static resistance must be scaled sustainably.
Further up, the December 13 high at $2,693 and the $2,700 level will be next on buyers’ radars.
Gold has played a key role in human’s history as it has been widely used as a store of value and medium of exchange. Currently, apart from its shine and usage for jewelry, the precious metal is widely seen as a safe-haven asset, meaning that it is considered a good investment during turbulent times. Gold is also widely seen as a hedge against inflation and against depreciating currencies as it doesn’t rely on any specific issuer or government.
Central banks are the biggest Gold holders. In their aim to support their currencies in turbulent times, central banks tend to diversify their reserves and buy Gold to improve the perceived strength of the economy and the currency. High Gold reserves can be a source of trust for a country’s solvency. Central banks added 1,136 tonnes of Gold worth around $70 billion to their reserves in 2022, according to data from the World Gold Council. This is the highest yearly purchase since records began. Central banks from emerging economies such as China, India and Turkey are quickly increasing their Gold reserves.
Gold has an inverse correlation with the US Dollar and US Treasuries, which are both major reserve and safe-haven assets. When the Dollar depreciates, Gold tends to rise, enabling investors and central banks to diversify their assets in turbulent times. Gold is also inversely correlated with risk assets. A rally in the stock market tends to weaken Gold price, while sell-offs in riskier markets tend to favor the precious metal.
The price can move due to a wide range of factors. Geopolitical instability or fears of a deep recession can quickly make Gold price escalate due to its safe-haven status. As a yield-less asset, Gold tends to rise with lower interest rates, while higher cost of money usually weighs down on the yellow metal. Still, most moves depend on how the US Dollar (USD) behaves as the asset is priced in dollars (XAU/USD). A strong Dollar tends to keep the price of Gold controlled, whereas a weaker Dollar is likely to push Gold prices up.
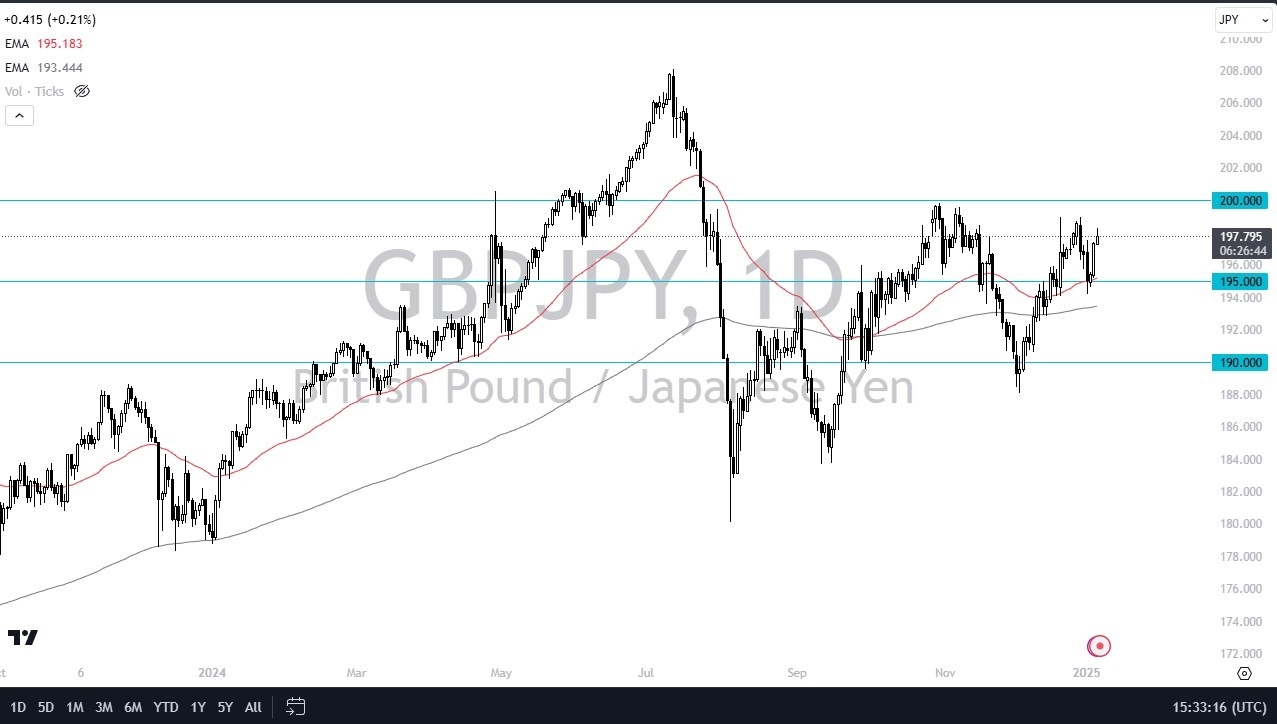
The British pound is essentially second place, so this is a market that should continue to favor the upside, given enough time, but that 200 barrier is extraordinarily resistant. The question is, possibly is somebody interfering here? Bank of Japan, for example.

They have been known to do this, so we’ll have to wait and see, but it does look like we are giving back a little bit of those gains, and now I think it is probably a dip waiting to happen. The 50-day EMA finds itself near the 195 yen level and rising. I think that is a short-term floor in the market. As long as we can stay above there, I think we’re probably still buying on the dip overall.
If we can get above the crucial 200 yen level, then it’s likely that this market goes screaming toward the 207 yen level given enough time. I’m not a huge fan of throwing a ton of money into this until we break above the 200 yen level, but I do recognize you get paid at the end of every day and that generally will drive the yen related pairs as the carry trade comes and goes, but ultimately everybody loves it. If we were to turn around and break down below the 195 yen level, then we have to start thinking about the 200-day EMA as the next support level. Anything underneath there, then we’re probably going to open up the trap door and fall towards the 190 yen level.
Begin trading the daily forecasts and analysis. Here is a list of Forex brokers in Japan to work with.
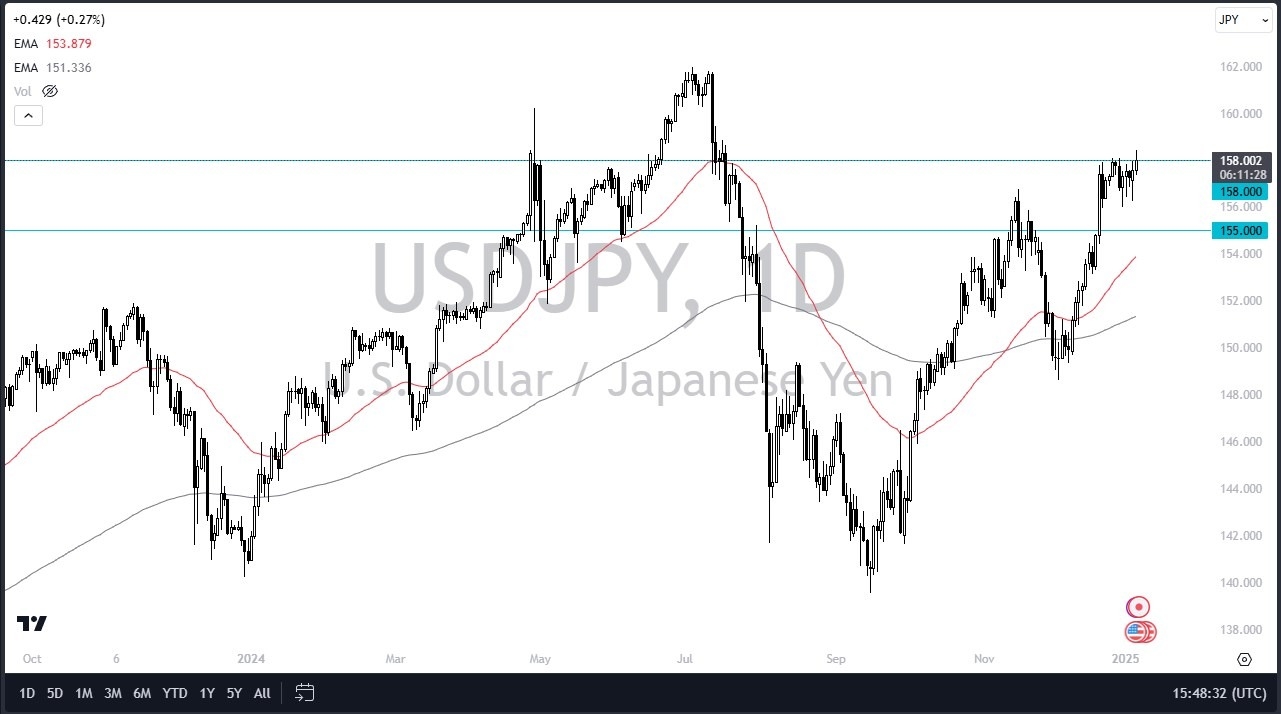
Ultimately, I do think we break above the 158 yen level regardless, but with rising yields and the volatility that we are seeing in the bond market, this makes the dollar even stronger. Add to that the fact that the Bank of Japan, who might begin to normalize is probably looking at less than half a percent, you’re still going to get paid to own this USD/JPY pair, and there’s not a lot the Japanese can do about it. They basically need the Federal Reserve to step in and start cutting rates and then somehow convince the market to go along with it, which so far Jerome Powell hasn’t been able to do. On a break above the 158.50 level, I think you could see the US dollar go racing toward the 162 yen level.
Short-term pullbacks continue to offer buying opportunities, especially near the 157 yen level, and most certainly at the 155 yen level where I see previous action and the 50 day EMA racing toward it. I have no interest in shorting this pair. I do not wish to fight the trend and trying to pick the top is a game for losers. The market continues to see fundamental reasons for the US dollar to strengthen. And while it has had a very strong run against the Japanese yen, that doesn’t mean that it can’t continue. With non-farm payrolls on Friday, that could be the next catalyst, we don’t know. But really, I’m just looking at a market that’s consolidating, building up pressure to try to go to the upside yet again.
Want to trade our USD/JPY forex analysis and predictions? Here’s a list of forex brokers in Japan to check out.
That was the second day since the 20-Day MA was reclaimed on October 29 that there has been a daily close below the 20-Day line. The first was three days ago, which generated a higher swing low (B). In addition, Tuesday’s bearish reversal day generated a lower swing high (C). These are signs of weakening that might lead to something or not.
Support was successfully tested again today around the trendline and the price area showed support. Thereafter, buyers took back control shortly after the opening on Wednesday. Natural gas is on track to close strong, in the upper third of the day’s price range, at the time of this writing. It continues to trade near the high, which was 3.68. The low for the day is 3.43, a match with Tuesday.
Therefore, 3.43 provides a specific price support level to watch, which is needed to confirm price behavior around the trendline. A drop below 3.43 would follow another decline below the 20-Day MA, which is now at 3.54, and the trendline. This leaves 3.43 as a key short-term price level, as a drop below it may lead to a continuation of the bearish trend with a drop below the recent swing low at (B).
On the upside, a lower swing high was generated yesterday following the day’s high of 3.74. Subsequently, sellers took back control, leading to a bearish reversal day and a weak close near the lows of the day and the trendline. Natural gas remains at risk of further downside unless there is a decisive advance above 3.74. That would trigger a bullish trend continuation signal and eliminate the lower swing high.
For a look at all of today’s economic events, check out our economic calendar.
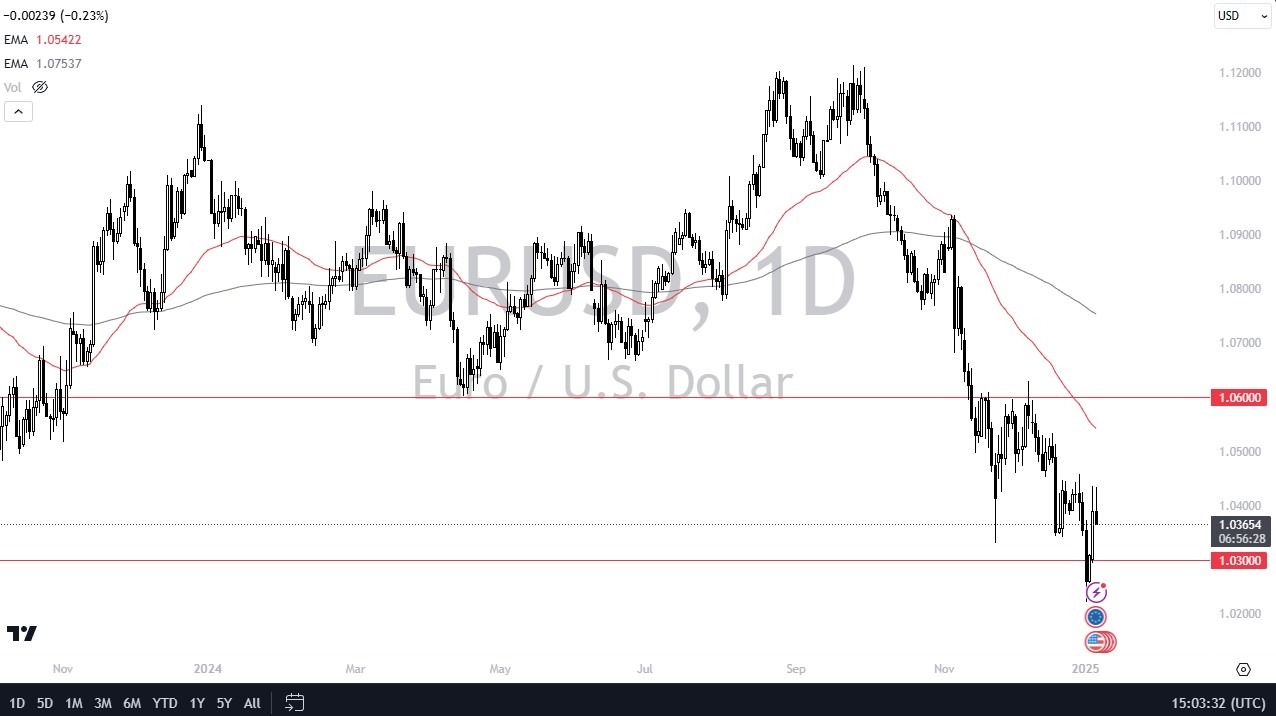
Now there will come a point in time when we turn around, but there’s no fundamental reason for that right now. The European economy is very weak and at the same time we have the US economy which is very strong and inflation in America is stronger than most people would like to think.
So, with that being the case I do think you have a situation where the US dollar continues to beat up on anything it can, and the euro is one of the particularly weakest currencies as far as majors are concerned. I believe this is the “epicenter” of all things Forex at the moment, as it typically is.
I do think eventually we will get to the parity level, but we do have a jobs number on Friday, so there might be a little bit of noise here and there this week, only to see things continue to the downside. If we did rally though, I would be looking at the 1.05 level, the 50-day EMA, and the 1.06 level for signs of exhaustion that I could start shorting again, because quite frankly this is a pair that I want to be aggressively bearish of when I get the opportunity to pick up cheap dollars. That’s the caveat.
Ready to trade our EUR/USD daily forecast? Here’s a list of some of the top forex brokers in Europe to check out.
The New Year appears to be bringing some respite to the bearish GBPUSD.
Cable was swinging upwards in fine form until the tax-raising Budget was announced by the Chancellor in late autumn, which promptly checked its advance. Since then, the rate has been haemorrhaging strength. GBPUSD dipped to a six-month low in early 2025, on low volume, to probe the 52-week lows of 1.230 (see below).
What now? What is the market trying to say about the future of GBPUSD? Trendwise, the current slide remains in motion. The pattern of lower lows and lower highs is intact.
But its recent v-shaped drop-and-recovery suggests some tentative buying at 1.230-1.240. Perhaps the market is seeing some value after a ten-week drop from 1.300. Even the Financial Times remarked last week (££) that “Britain’s economic outlook in fact looks quite robust compared to other advanced economies.”
But to overcome GBPUSD’s bearish posture requires more than just technical buying. Macro catalysts with bullish leanings are needed to revise the market’s downbeat view of the UK exchange rate. For now, these catalysts are critically absent. UK’s economic growth is uninspiring, inflation looks ready to rebound, and interest rates remain at elevated levels.
What’s more, the dollar is holding on to its strength. The financial market is eagerly awaiting for the new Trump administration this month (inauguration on January 20). What Trump 2.0 will do to the economy is a big unknown, although the stock market is already loving Donald (see Nasdaq’s relentless rise since Nov 5).
For now, the rate may bounce around 1.250, until a new market consensus is formed.
Given that Pound Sterling has weakened against the Dollar, should we sell GBP to buy USD before it drops further?
If you need dollars now, watch to sell some Pound Sterling on any bounce to buy dollars.
But if you can wait, perhaps look for a rebound above 1.260 to let go of some Sterling for Dollars. The decline from 1.300 is ‘oversold’ in technical terms and may be due for a further bounce. There is risk in waiting though, as the rate could stay in a sideways-negative trend longer than anticipated.
There are many serious macro factors weighing on the GBP rates these days. However, extrapolating the current GBPUSD downtrend may not necessarily work due to the complexity of the economic trends.
For one, the market is eagerly eyeing new policy guidance from the incoming Trump administration. Tariffs, budgets, and geopolitical decisions are all on the table waiting to be deliberated by the new cabinet. These issues may impact the dollar, however tangentially. For instance, the dollar weakens this week (Jan 6) when rumours of lower tariffs swirled in the FX market.
What is more, the economic outlook of the US is far stronger than anticipated. Listen to the recent speech by Lisa Cook, a serving member of the Federal Reserve Board, on January 6:
I continue to view the risks to achieving the two sides of the Federal Reserve’s dual mandate of price stability and maximum employment as being roughly in balance……the 100 basis points of rate cuts since September have notably reduced the restrictiveness of monetary policy. All along, I envisioned moving more quickly in the early stages of our easing campaign and then easing more gradually as the policy rate came closer to neutral…….since September, the labor market has been somewhat more resilient, while inflation has been stickier than I assumed at that time. Thus, I think we can afford to proceed more cautiously with further cuts.
In other words, all the big rate cuts envisioned by investors a year ago have been thrown out of the window.
In light of the robustness of the American economy, no wonder US interest rates are climbing steeply. Rates are definitely staying ‘higher for longer’.
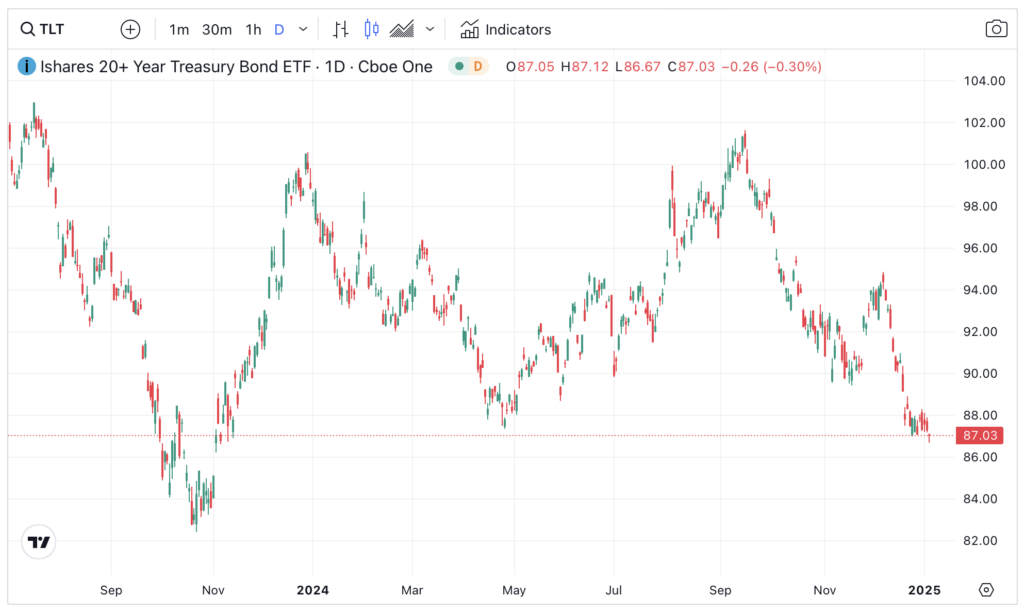
In the past six weeks, the 10-year US Treasury Yield surged to 4.6 percent, a level which is only a short distance from the 2023 peak of 5 percent. If we view this trend via bond prices (bond price and yield move inversely), the breakdown of US Treasury prices is very worrying indeed.
The iShares Treasury Bond ETF (ticker:TLT) tentatively slipped to new 52-week lows this week. The correction from September now exceeds 13 points (see below). Many bondholders could be in the red. If further inflationary economic data appears, another bond rout is quite possible.
In sum, the above discussions points towards a firm Dollar that is backed by a strong American economy and high bond yields. To get GBPUSD back to, say 1.350, requires perhaps a marked reversal of these macro tidings. Not easy, given current set of factors.
However, expectations of GBP are low – and possibly baked in current low prices. This, in turn, means that better-than-expected economic data may set GBPUSD up for a tidy rally since the sentiment is so negative.
In a nutshell, to predict where GBPUSD will be at the end of this quarter is near impossible since there are so many paths it could take. Hence I will just opine that the rate will probable trade at a level not too far from where it is now.
GBPUSD’s weak trend is being extrapolated by the market. Many brokers are expecting a further dip in the weeks ahead. Who dares to fight an entrenched trend? Very few.
If we look three months ahead, the interesting part of the predictions is the bifurcation of the predictions. Some anticipate a further decline (1.200-1.21) while a few expect a bounce (to 1.260-1.270). The range of the forecast tells you how volatile the market is at the moment.
Therefore, we just have to see where the market is willing to take the GBPUSD rate. Watch for a tussle between supply and demand around 1.250.
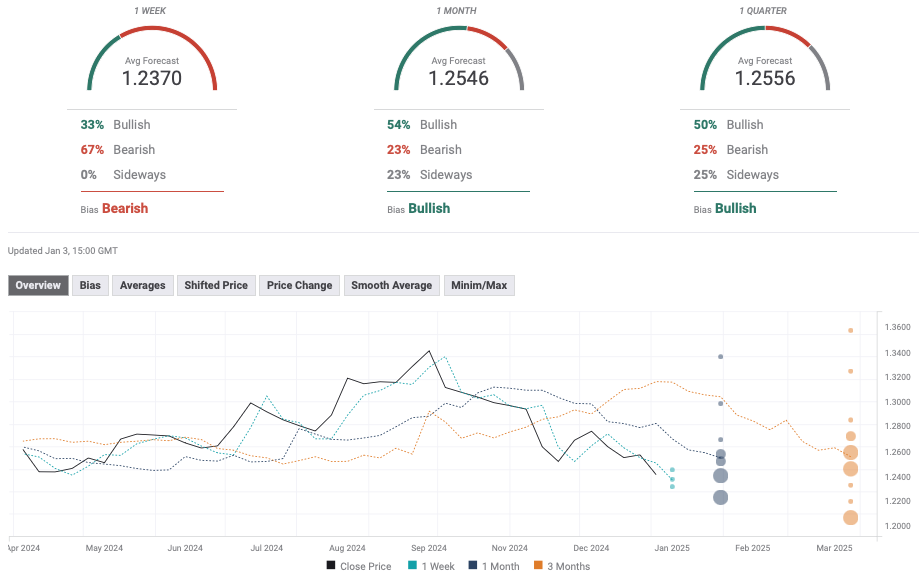
Source: fxstreet.com (Jan 2025)