The main category of Forex News.
You can use the search box below to find what you need.
[wd_asp id=1]
The main category of Forex News.
You can use the search box below to find what you need.
[wd_asp id=1]
Gold price is battling the short-term critical barrier at around $2,635 early Tuesday, consolidating the two-day corrective decline from three-week highs of $2,665. Gold traders refrain from placing fresh directional bets ahead of the top-tier US ISM Services PMI and JOLTS Job Openings data.
Despite Monday’s two-way price movement, Gold price remains confined in a familiar range as traders weigh the latest reports surrounding incoming US President Donald Trump’s tariff plans and the US economic data releases for a clear direction heading into Friday’s US Nonfarm Payrolls data release.
Gold price reversed the Asian bounce and fell as low as $2,615 in the European session on Monday on fading China’s stimulus optimism and sagging physical Gold demand from India. The rising domestic Gold prices due to the depreciation of the Indian Rupee (INR) to record low dampened demand for the bright metal from the world’s no. 2 Gold consumer.
Further, Goldman Sachs pushed back its forecast of Gold reaching $3,000 per ounce, initially expected by the end of 2025. This also exerted downward pressure on Gold price.
However, Gold price found fresh buyers in American trading after the US Dollar (USD) fell steeply across the board following a report from the Washington Post (WaPo) that Trump’s aides were exploring plans that would apply tariffs only on sectors seen as critical to US national or economic security.
Trump quickly denied the report in a post on his Truth Social platform, which allowed the Greenback to recover some ground, prompting Gold price to settle in the red.
Later this Tuesday, speculations around Trump’s tariff plans, the US jobs data and the broader market sentiment will play a pivotal role in the Gold price action. Meanwhile, a speech by Richmond Federal Reserve (Fed) President Thomas Barkin on the economic forecast will be closely scrutnized for gauging the Fed next policy move.
The daily chart shows that the 14-day Relative Strength Index (RSI) trades listlessly at the 50 level, leaving Gold price gyrating in a narrow range.
In doing so, Gold price clings to the 21-day Simple Moving Average (SMA) at $2,636 after failing to sustain above it on a daily closing basis on Monday.
The immediate support is now seen at the 100-day SMA at $2,627, below which the door will open for a retest of the previous week’s low of $2,596.
Ahead of that, the previous day’s low of $2,615 will offer some support to Gold buyers.
If Gold buyers regain control above the 50-day SMA barrier at $2,648, the next relevant topside barrier is seen at the three-week high of $2,665.
Further up, the $2,700 level will challenge bearish committments.
JOLTS Job Openings is a survey done by the US Bureau of Labor Statistics to help measure job vacancies. It collects data from employers including retailers, manufacturers and different offices each month.
The slowing of volatility in gold has been noticeable of late and that’s particularly true if looking at the weekly chart. After a ripping up-trend started in Q1 of last year and ran clearly through the Q4 open, the past two months and a week have been less enthusiastic for bulls. But this doesn’t necessarily mean that buyers are finished as the symmetrical triangle on the below chart, when combined with the bullish trend that pushed into that formation, can be argued as a bull pennant formation. Such formations are common as an illustration of consolidation after a strong bullish move, as a combination of profit taking from prior longs and late-stage bullish press from buyers trying to bid support on pullbacks can lead to a narrowing in price action, such as we’ve seen since both the late-October and mid-November inflection points.
Normally, bull pennants are approached with aim of topside continuation. I look at the formations more neutrally, however, as prolonged consolidation doesn’t always carry the prior bias. But given the build of higher-lows after a move that priced in as much as a 40.6% gain last year, bulls can’t yet be counted out.
 Chart prepared by James Stanley; data derived from Tradingview
The 2721 level was a big spot for gold last year, helping to set swing highs in both late-November and then in December. That second inflection led to a higher-low along with a test below $2600, which then held the lows last week to allow for yet another higher-low, further substantiating the support trendline making up the triangle formation.
The bounce from the $2600 support test led to a short-term higher-high, and the pullback from that appears to be grasping to retain support around prior resistance from the $2633-$2639 zone.
This could be construed as a bullish short-term bias but it’s important to qualify that this is all taking place inside of the longer-term or bigger picture consolidation of the symmetrical triangle.
 Chart prepared by James Stanley; data derived from Tradingview
From the four-hour we can see a busy start to the week for gold prices and the most recently completed four-hour candle printed as a long-legged doji. This provides some scope of shorter-term support and resistance levels, as it was the 2650 level that seemed to deter bulls earlier in the morning, after which prices dipped down to just below 2615.
A breach of either of those prices could be construed as a short-term directional move; and for deeper support, there’s the trendline projection currently plotted around $2604, after which the $2600 level comes into the picture. For topside, a breach of $2650 opens the door for re-test of $2657, after which last week’s high comes into the picture at $2664 and that’s followed by the Fibonacci level at $2674.
 Chart prepared by James Stanley; data derived from Tradingview
— written by James Stanley, Senior Strategist
On Friday, natural gas closed below the 20-Day MA, a bearish sign. Of course, today’s bullish reversal negates that potential bearish clue. It is interesting to note the on each of the past three pullbacks, there was only one day that closed below the 20-Day line, and then it was quickly followed by a reclaim of the 20-Day line and a daily close above it. That is the situation today.
Of concern is the bearish shooting star weekly candlestick pattern (not shown) that completed last week. It includes a long top shadow followed by a close near the lows of the week’s price range. Whether silver resolves to the downside or upside, it adds risk to the rally. A new trend high is not triggered until there is a rally above last week’s high of 4.20. That is a way up.
Before encountering potential resistance around the trend high, the 200-Week MA would need to be reclaimed. It is now at 3.88. It should be noted that the 200-Week line was reclaimed in each of the past two weeks but there has not yet been a weekly close above the 200-Week. Therefore, another daily close above the 200-Week line at 3.88 would show strength. Maybe, enough strength to see a challenge to the recent trend high. Until then the expectation is for choppy trading with last week’s price range of 4.20 to 3.33.
For a look at all of today’s economic events, check out our economic calendar.
With the US non-farm payrolls to come in a busy week for US economic data, the USD/JPY is our featured currency pair this week. Earlier, the USD/JPY was trading sharply lower, along with all the other dollar crosses, with analysts pointing to reports suggesting that Trump’s aides may be contemplating a more lenient approach to tariffs as the reason for the greenback’s drop. In an interview, Trump had said that “I predict China’s Xi and I will get along, have been talking through representatives.” The key question now was whether Trump will issue any denials regarding this reportedly softer stance. Lo and behold, Trump shortly denied that he will pare back his tariff policy, and up went the dollar. Given his tough rhetoric so far, it’s hard to envision him adopting a more conciliatory tone when he takes office later this month. The dollar is now going to be more headline- driven and potentially boost the appeal of safe haven yen. For now, it may be too early to have a bearish USD/JPY forecast, especially ahead of this week’s key data highlights. But we could see the USD/JPY drift back lower in the days ahead anyway, as the focus turns to data and monetary policy.
Here’s a list of key US data to watch this week, which could impact the short-term USD/JPY forecast:

If this week’s data, especially the NFP report, fails to meet or exceed expectations then that could cause a bearish shift in the US dollar.
The trend may often be your friend, but when it comes to the slightly longer-term USD/JPY forecast, I’m leaning against the prevailing momentum. While the currency pair has enjoyed a bullish streak, I believe the conditions are ripe for a reversal. However, timing is critical—a clear bearish confirmation and pattern are needed before taking action.
In 2024, analysts widely anticipated a stronger performance from the Japanese yen, driven by expectations of the Bank of Japan (BoJ) normalizing its ultra-loose monetary policy. Instead, the BoJ maintained its dovish stance, and the yen continued to weaken, pushing USD/JPY higher for a fourth consecutive year. By late 2024, the pair approached intervention-prone levels between 157.00 and 160.00. The pair was showing signs of struggle around this area again today.
Looking ahead, several factors suggest that the yen could stage a sharp rally in 2025, making a short USD/JPY an appealing trade idea. One factor behind this idea is the potential for the Bank of Japan to tighten its belt. In December 2024, the BoJ held its benchmark rate at 0.25%, disappointing those hoping for a hawkish pivot. Despite this, persistent above-target inflation could compel the central bank to tighten policy in 2025. Japan’s annual inflation climbed to 2.9% in November, driven by rising food and import costs. With inflation likely to remain elevated due to yen depreciation, the BoJ may act to align its policy more closely with global peers. Even a modest rate hike could strengthen the yen and weigh heavily on USD/JPY.
Today’s earlier reports that Trump will scale down tariff plans (which he later denied) means there is always the possibility we could see the unwinding of Trump trades in the coming weeks. After all, much of the dollar’s strength in 2024 stemmed from resilient US data and anticipation of pro-growth policies under Donald Trump. Should these policies falter in 2025, and Trump decides against imposing tough trade tariffs on imports from Eurozone and China, we could see the likes of the euro and yuan recover sharply. This resulting unwinding of “Trump trades” could further pressure USD/JPY lower.

Source: TradingView.com
From a technical perspective, the trend is still bullish on the USD/JPY, as evidenced by a rising trend line and key moving averages being below price.
While the pair remains in a bullish trend, a decisive break below the bullish trend line that has been in place since September could signal the start of a deeper correction.
In terms of levels to watch, the 156.75 to 160.00 range serves as a significant resistance zone. Ahead of the abovementioned trend line, there are a few levels to watch, including 156.00 and 155.00, now the most important short-term support levels.
In as far as the longer-term view is concerned, we will need to see a break below December’s low of 148.65 to provide a clearer bearish signal.
Meanwhile, if the USD/JPY refuses to buckle, and instead rises through the 160.00 region then I would imagine it might go on to take out the July high of 161.95 before the bears will have another attempt at driving the pair lower.
— Written by Fawad Razaqzada, Market Analyst
Follow Fawad on Twitter @Trader_F_R
Silver’s price rose over 1% on Monday and faces key resistance at the 200-day Simple Moving Average (SMA) at $29.87. At the time of writing, XAG/USD trades at $29.87 after bouncing off a daily low of $29.41 and reaching a high of $30.34.
Silver is facing strong resistance at $29.87, the 200-day SMA, which is crucial for buyers if they want to push spot prices higher. The uptrend remains intact, yet bulls need to clear the latter, followed by the $30.00 mark.
Up next is the confluence of the 50 and 100-day SMAs at $30.73/77, followed by $31.00 a troy ounce.
Conversely, if XAG/USD falls short of clearing the 200-day SMA, sellers could challenge the December monthly low of $28.74, followed by the September 6 low of $27.69.
Silver is a precious metal highly traded among investors. It has been historically used as a store of value and a medium of exchange. Although less popular than Gold, traders may turn to Silver to diversify their investment portfolio, for its intrinsic value or as a potential hedge during high-inflation periods. Investors can buy physical Silver, in coins or in bars, or trade it through vehicles such as Exchange Traded Funds, which track its price on international markets.
Silver prices can move due to a wide range of factors. Geopolitical instability or fears of a deep recession can make Silver price escalate due to its safe-haven status, although to a lesser extent than Gold’s. As a yieldless asset, Silver tends to rise with lower interest rates. Its moves also depend on how the US Dollar (USD) behaves as the asset is priced in dollars (XAG/USD). A strong Dollar tends to keep the price of Silver at bay, whereas a weaker Dollar is likely to propel prices up. Other factors such as investment demand, mining supply – Silver is much more abundant than Gold – and recycling rates can also affect prices.
Silver is widely used in industry, particularly in sectors such as electronics or solar energy, as it has one of the highest electric conductivity of all metals – more than Copper and Gold. A surge in demand can increase prices, while a decline tends to lower them. Dynamics in the US, Chinese and Indian economies can also contribute to price swings: for the US and particularly China, their big industrial sectors use Silver in various processes; in India, consumers’ demand for the precious metal for jewellery also plays a key role in setting prices.
Silver prices tend to follow Gold’s moves. When Gold prices rise, Silver typically follows suit, as their status as safe-haven assets is similar. The Gold/Silver ratio, which shows the number of ounces of Silver needed to equal the value of one ounce of Gold, may help to determine the relative valuation between both metals. Some investors may consider a high ratio as an indicator that Silver is undervalued, or Gold is overvalued. On the contrary, a low ratio might suggest that Gold is undervalued relative to Silver.
January 6, 2025 – Written by David Woodsmith
STORY LINK Pound to Dollar Rate Week Ahead Forecast: GBP/USD Firm in Turbulent Week
Monday AM Brief: The Pound to Dollar exchange rate edged higher on Monday ahead of a number of US data releases expected this week.
On Monday, the Pound (GBP) experienced a slight rise against most of its major counterparts, even as the UK’s final services PMI for December was released.
The services PMI, a key indicator for the UK economy, registered at 51.1, falling just short of the expected 51.4.
Nonetheless, the GBP maintained its stability after the data was made public, showing resilience despite the minor discrepancy.
On Monday, the US Dollar (USD) failed to capture much investor interest and weakened against most of its major counterparts.
US investors appeared cautious about making significant bets on the ‘Greenback’ ahead of a busy economic calendar this week.
Key economic data releases are scheduled for the coming days: the latest labor data and PMIs will be out on Tuesday, the Federal Reserve’s FOMC meeting minutes will be released on Wednesday, and the crucial non-farm payrolls report along with the latest unemployment rate will be published on Friday.

Anticipation of these important economic indicators left USD exchange rates struggling to attract strong buying interest at the beginning of the week.
Looking ahead, the main driver of movement for the Pound US Dollar exchange rate on Tuesday will likely be the release of several high-impact economic data points from the US.
First up, the US will publish its latest ISM services PMI for December.
If the data shows another rise in this crucial sector, it could provide a lift to the ‘Greenback.’
Later in the day, the US will release its JOLT job openings survey for November.
Should the data remain around the positive levels seen in October, it could further support USD exchange rates.
On the Pound side, the UK will release its latest BRC retail sales monitor for December.
The data is expected to show a recovery, with a forecasted improvement from -3.4% to -0.2%.
If the figures meet these expectations and confirm an uptick in the UK’s retail sales, it could give a boost to GBP exchange rates.
International Money Transfer? Ask our resident FX expert a money transfer question or try John’s new, free, no-obligation personal service! ,where he helps every step of the way,
ensuring you get the best exchange rates on your currency requirements.
The slowing of volatility in gold has been noticeable of late and that’s particularly true if looking at the weekly chart. After a ripping up-trend started in Q1 of last year and ran clearly through the Q4 open, the past two months and a week have been less enthusiastic for bulls. But this doesn’t necessarily mean that buyers are finished as the symmetrical triangle on the below chart, when combined with the bullish trend that pushed into that formation, can be argued as a bull pennant formation. Such formations are common as an illustration of consolidation after a strong bullish move, as a combination of profit taking from prior longs and late-stage bullish press from buyers trying to bid support on pullbacks can lead to a narrowing in price action, such as we’ve seen since both the late-October and mid-November inflection points.
Normally, bull pennants are approached with aim of topside continuation. I look at the formations more neutrally, however, as prolonged consolidation doesn’t always carry the prior bias. But given the build of higher-lows after a move that priced in as much as a 40.6% gain last year, bulls can’t yet be counted out.
 Chart prepared by James Stanley; data derived from Tradingview
The 2721 level was a big spot for gold last year, helping to set swing highs in both late-November and then in December. That second inflection led to a higher-low along with a test below $2600, which then held the lows last week to allow for yet another higher-low, further substantiating the support trendline making up the triangle formation.
The bounce from the $2600 support test led to a short-term higher-high, and the pullback from that appears to be grasping to retain support around prior resistance from the $2633-$2639 zone.
This could be construed as a bullish short-term bias but it’s important to qualify that this is all taking place inside of the longer-term or bigger picture consolidation of the symmetrical triangle.
 Chart prepared by James Stanley; data derived from Tradingview
From the four-hour we can see a busy start to the week for gold prices and the most recently completed four-hour candle printed as a long-legged doji. This provides some scope of shorter-term support and resistance levels, as it was the 2650 level that seemed to deter bulls earlier in the morning, after which prices dipped down to just below 2615.
A breach of either of those prices could be construed as a short-term directional move; and for deeper support, there’s the trendline projection currently plotted around $2604, after which the $2600 level comes into the picture. For topside, a breach of $2650 opens the door for re-test of $2657, after which last week’s high comes into the picture at $2664 and that’s followed by the Fibonacci level at $2674.
 Chart prepared by James Stanley; data derived from Tradingview
— written by James Stanley, Senior Strategist
With the US non-farm payrolls to come in a busy week for US economic data, the USD/JPY is our featured currency pair this week. Earlier, the USD/JPY was trading sharply lower, along with all the other dollar crosses, with analysts pointing to reports suggesting that Trump’s aides may be contemplating a more lenient approach to tariffs as the reason for the greenback’s drop. In an interview, Trump had said that “I predict China’s Xi and I will get along, have been talking through representatives.” The key question now was whether Trump will issue any denials regarding this reportedly softer stance. Lo and behold, Trump shortly denied that he will pare back his tariff policy, and up went the dollar. Given his tough rhetoric so far, it’s hard to envision him adopting a more conciliatory tone when he takes office later this month. The dollar is now going to be more headline- driven and potentially boost the appeal of safe haven yen. For now, it may be too early to have a bearish USD/JPY forecast, especially ahead of this week’s key data highlights. But we could see the USD/JPY drift back lower in the days ahead anyway, as the focus turns to data and monetary policy.
Here’s a list of key US data to watch this week, which could impact the short-term USD/JPY forecast:

If this week’s data, especially the NFP report, fails to meet or exceed expectations then that could cause a bearish shift in the US dollar.
The trend may often be your friend, but when it comes to the slightly longer-term USD/JPY forecast, I’m leaning against the prevailing momentum. While the currency pair has enjoyed a bullish streak, I believe the conditions are ripe for a reversal. However, timing is critical—a clear bearish confirmation and pattern are needed before taking action.
In 2024, analysts widely anticipated a stronger performance from the Japanese yen, driven by expectations of the Bank of Japan (BoJ) normalizing its ultra-loose monetary policy. Instead, the BoJ maintained its dovish stance, and the yen continued to weaken, pushing USD/JPY higher for a fourth consecutive year. By late 2024, the pair approached intervention-prone levels between 157.00 and 160.00. The pair was showing signs of struggle around this area again today.
Looking ahead, several factors suggest that the yen could stage a sharp rally in 2025, making a short USD/JPY an appealing trade idea. One factor behind this idea is the potential for the Bank of Japan to tighten its belt. In December 2024, the BoJ held its benchmark rate at 0.25%, disappointing those hoping for a hawkish pivot. Despite this, persistent above-target inflation could compel the central bank to tighten policy in 2025. Japan’s annual inflation climbed to 2.9% in November, driven by rising food and import costs. With inflation likely to remain elevated due to yen depreciation, the BoJ may act to align its policy more closely with global peers. Even a modest rate hike could strengthen the yen and weigh heavily on USD/JPY.
Today’s earlier reports that Trump will scale down tariff plans (which he later denied) means there is always the possibility we could see the unwinding of Trump trades in the coming weeks. After all, much of the dollar’s strength in 2024 stemmed from resilient US data and anticipation of pro-growth policies under Donald Trump. Should these policies falter in 2025, and Trump decides against imposing tough trade tariffs on imports from Eurozone and China, we could see the likes of the euro and yuan recover sharply. This resulting unwinding of “Trump trades” could further pressure USD/JPY lower.

Source: TradingView.com
From a technical perspective, the trend is still bullish on the USD/JPY, as evidenced by a rising trend line and key moving averages being below price.
While the pair remains in a bullish trend, a decisive break below the bullish trend line that has been in place since September could signal the start of a deeper correction.
In terms of levels to watch, the 156.75 to 160.00 range serves as a significant resistance zone. Ahead of the abovementioned trend line, there are a few levels to watch, including 156.00 and 155.00, now the most important short-term support levels.
In as far as the longer-term view is concerned, we will need to see a break below December’s low of 148.65 to provide a clearer bearish signal.
Meanwhile, if the USD/JPY refuses to buckle, and instead rises through the 160.00 region then I would imagine it might go on to take out the July high of 161.95 before the bears will have another attempt at driving the pair lower.
— Written by Fawad Razaqzada, Market Analyst
Follow Fawad on Twitter @Trader_F_R
Spot Gold fell to $2,614.44 early in the American session but bounced from such a low and stabilized around its daily opening in the $2,630/40 price zone. The US Dollar (USD) started the day with a soft tone, but came under strong selling pressure mid-European session amid political headlines from the United States (US).
The Washington Post reported that Donald Trump’s transition team was working on narrowing tariffs, focusing only on key sectors deemed vital to national security, such as defence, medical supplies, and energy, narrowing the universal tariffs plan that generated concerns. Speculative interest jumped into high-yielding assets, ignoring XAU/USD.
Still, and after Wall Street’s opening, upcoming US President Donald Trump denied the headlines, saying that the story about paring back tariffs was wrong. His words boosted the USD, pushing the bright metal towards the mentioned low and putting stock markets in retreat mode.
As the dust settled, equities recovered, while the USD trimmed part of its intraday losses yet remains in the red against most major rivals. The mood remains upbeat, maintaining market players away from XAU/USD.
This week, the focus will be on US employment figures, as the country will release different figures ahead of the Nonfarm Payrolls (NFP) report, scheduled for next Friday.
The XAU/USD pair has been trading around the current level for six weeks in a row, with spikes on one side or the other being reverted, a sign investors are comfortably waiting for a powerful catalyst to justify higher highs. In the daily chart, the bright metal hovers around a flat 20 Simple Moving Average (SMA) while buyers defended the downside at around a bullish 100 SMA, now providing dynamic support at $2,624.98. Technical indicators, in the meantime, remain within negative levels, albeit with uneven directional strength, reflecting buyers’ pause.
The near-term picture suggests the bullish potential is limited. The 20, 100 and 200 SMAs converge in a tight range in the $2,640 region, rejecting advances. Finally, technical indicators have pared their slides but remain below their midlines. Gold may turn bullish if it manages to retain gains beyond the 2,665 level, where it topped in early January.
Support levels: 2,624.90 2,611.20 2,596.00
Resistance levels: 2,649.50 2,665.10 2,678.85
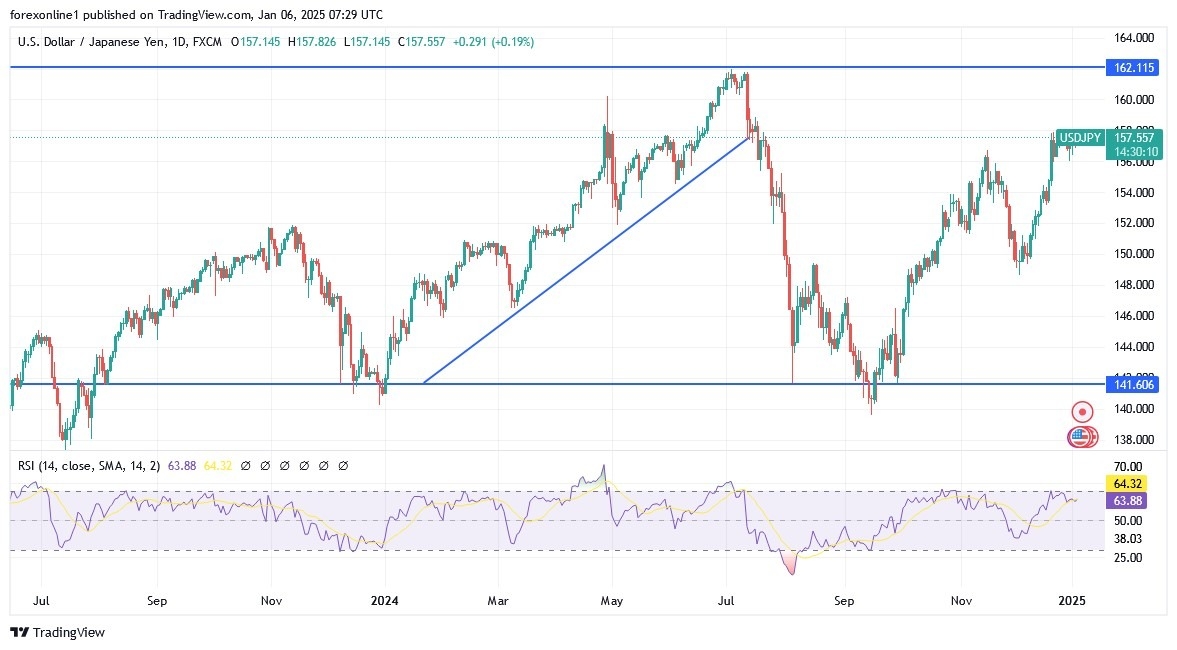
From now on, you may notice an increase in Japanese statements about the possibility of intervening in the exchange markets to prevent further collapse of the Japanese yen, which historically contradicts the policies of the upcoming US administration, as Trump refuses to intervene in the exchange markets. Keep in mind that the movement of the dollar against the Japanese yen price for long periods in narrow ranges portends a strong move in one of the two directions.
We still recommend buying the dollar against the Japanese yen from every downward level, but without risk and placing stop loss profit orders
The US dollar is trading near its two-year high, supported by a shift in US Federal Reserve policies and the continuation of Trump’s trade. The Federal Reserve has cut US interest rates by a full percentage point in three steps since September 2024. Federal Reserve Chairman Jerome Powell described the latest move as “closer to a call,” adding that the federal funds rate is now “much less restrictive.” It currently falls within the range of 4.25% to 4.5%.
Fed officials’ expectations for US interest rates this year indicate a median estimate of only two more cuts this year. Also, four officials preferred not to cut US interest rates at all in December 2024. Moreover, Cleveland Federal Reserve President Beth Hammack opposed the decision in favour of keeping interest rates steady.

The USD/JPY pair recently retreated to trade at the 100-hour moving average line. However, the pair continues to move towards the overbought levels of the 14-hour Relative Strength Index (RSI). In the near term, bulls will look to extend the current rally towards the 157.75 resistance levels and then the 158.90 resistance levels respectively. On the other hand, bears will look to take advantage of the selling to move towards the 156.80 support levels or lower at the 155.95 support.
In the long term, according to the performance on the daily chart, the USD/JPY pair is trading within an ascending channel formation. Also, the 14-day RSI supports a long-term bullish bias as it is about to enter overbought levels. Therefore, bulls will look to move towards stronger highs beyond the usual Japanese intervention levels reaching the 161.20 and 164.00 resistance levels respectively. In contrast, and over the same period of time, bears will look to move with renewed profit-taking selling operations, reaching the support levels of 155.30 and then the support of 152.00, respectively.
Want to trade our USD/JPY forex analysis and predictions? Here’s a list of forex brokers in Japan to check out.