The main category of Forex News.
You can use the search box below to find what you need.
[wd_asp id=1]
The main category of Forex News.
You can use the search box below to find what you need.
[wd_asp id=1]
After ending the holiday-shortened week virtually unchanged, EUR/USD extends its sideways grind slightly above 1.0400 in the European session on Monday. The pair is likely to remain stuck in a tight range, with trading conditions unlikely to normalize until after the New Year holiday.
The table below shows the percentage change of Euro (EUR) against listed major currencies last 7 days. Euro was the weakest against the New Zealand Dollar.
| USD | EUR | GBP | JPY | CAD | AUD | NZD | CHF | |
|---|---|---|---|---|---|---|---|---|
| USD | 0.09% | -0.06% | 0.93% | 0.23% | 0.20% | -0.13% | 1.04% | |
| EUR | -0.09% | -0.17% | 0.77% | 0.12% | 0.18% | -0.23% | 0.94% | |
| GBP | 0.06% | 0.17% | 0.91% | 0.29% | 0.35% | -0.05% | 1.12% | |
| JPY | -0.93% | -0.77% | -0.91% | -0.65% | -0.65% | -1.02% | 0.05% | |
| CAD | -0.23% | -0.12% | -0.29% | 0.65% | 0.02% | -0.36% | 0.81% | |
| AUD | -0.20% | -0.18% | -0.35% | 0.65% | -0.02% | -0.41% | 0.76% | |
| NZD | 0.13% | 0.23% | 0.05% | 1.02% | 0.36% | 0.41% | 1.13% | |
| CHF | -1.04% | -0.94% | -1.12% | -0.05% | -0.81% | -0.76% | -1.13% |
The heat map shows percentage changes of major currencies against each other. The base currency is picked from the left column, while the quote currency is picked from the top row. For example, if you pick the Euro from the left column and move along the horizontal line to the US Dollar, the percentage change displayed in the box will represent EUR (base)/USD (quote).
In an interview with Austrian newspaper Kurier over the weekend, European Central Bank (ECB) Governing Council member Robert Holzmann said that it might take more time until the ECB cuts rates again. “There are signs of an upward trend in some energy prices. But there are also other scenarios as to how inflation could return, like via a stronger devaluation of the euro,” Holzmann elaborated.
These comments seem to be helping the Euro hold its ground. In the second half of the day, Pending Home Sales for November and Chicago Purchasing Managers Index for December will be featured in the US economic calendar. These data, however, are unlikely to influence the US Dollar’s (USD) valuation in a noticeable way.
In the meantime, US stock index futures trade in negative territory, reflecting a cautious market mood. In case Wall Street’s main indexes turn south after the opening bell, EUR/USD could have a hard time keeping its footing.
The Relative Strength Index (RSI) indicator on the 4-hour chart holds slightly above 50 and EUR/USD stays above the 20 and the 50-period Simple Moving Averages (SMA), reflecting a lack of seller interest.
EUR/USD could face first resistance at 1.0440 (static level) before 1.0470 (100-period SMA) and 1.0500 (200-period SMA). On the downside, 1.0400 (round level, static level) could be seen as interim support ahead of 1.0350 (static level) and 1.0300 (static level, round level).
The Euro is the currency for the 19 European Union countries that belong to the Eurozone. It is the second most heavily traded currency in the world behind the US Dollar. In 2022, it accounted for 31% of all foreign exchange transactions, with an average daily turnover of over $2.2 trillion a day. EUR/USD is the most heavily traded currency pair in the world, accounting for an estimated 30% off all transactions, followed by EUR/JPY (4%), EUR/GBP (3%) and EUR/AUD (2%).
The European Central Bank (ECB) in Frankfurt, Germany, is the reserve bank for the Eurozone. The ECB sets interest rates and manages monetary policy. The ECB’s primary mandate is to maintain price stability, which means either controlling inflation or stimulating growth. Its primary tool is the raising or lowering of interest rates. Relatively high interest rates – or the expectation of higher rates – will usually benefit the Euro and vice versa. The ECB Governing Council makes monetary policy decisions at meetings held eight times a year. Decisions are made by heads of the Eurozone national banks and six permanent members, including the President of the ECB, Christine Lagarde.
Eurozone inflation data, measured by the Harmonized Index of Consumer Prices (HICP), is an important econometric for the Euro. If inflation rises more than expected, especially if above the ECB’s 2% target, it obliges the ECB to raise interest rates to bring it back under control. Relatively high interest rates compared to its counterparts will usually benefit the Euro, as it makes the region more attractive as a place for global investors to park their money.
Data releases gauge the health of the economy and can impact on the Euro. Indicators such as GDP, Manufacturing and Services PMIs, employment, and consumer sentiment surveys can all influence the direction of the single currency. A strong economy is good for the Euro. Not only does it attract more foreign investment but it may encourage the ECB to put up interest rates, which will directly strengthen the Euro. Otherwise, if economic data is weak, the Euro is likely to fall. Economic data for the four largest economies in the euro area (Germany, France, Italy and Spain) are especially significant, as they account for 75% of the Eurozone’s economy.
Another significant data release for the Euro is the Trade Balance. This indicator measures the difference between what a country earns from its exports and what it spends on imports over a given period. If a country produces highly sought after exports then its currency will gain in value purely from the extra demand created from foreign buyers seeking to purchase these goods. Therefore, a positive net Trade Balance strengthens a currency and vice versa for a negative balance.
Silver price (XAG/USD) recovers its recent losses from the previous session, trading around $29.50 per troy ounce during the Asian hours on Monday. However, trading volume is lighter than usual ahead of the New Year holiday.
The safe-haven Silver appreciates as traders anticipate signals regarding the United States (US) economy under the President-elect Trump administration and the Federal Reserve’s (Fed) interest rate outlook for 2025.
The potential for Donald Trump’s tariffs and trade policies could trigger trade conflicts, increasing the risk aversion sentiment and supporting the demand for safe-haven assets like Silver. However, the outlook for fewer Fed rate cuts in 2025 might cap the upside for the price of the non-yielding Silver. The Fed cut its benchmark interest rate by a quarter point at the December meeting, and the latest Dot Plots indicated two rate cuts next year.
The US Dollar Index (DXY), which measures the value of the US Dollar (USD) against its six major peers, hovers around 108.00, slightly below its highest level since November 2022. Any further strengthening of the Greenback could limit the upside of the dollar-denominated precious commodities like Silver, as a stronger USD makes these assets more expensive for holders of other currencies.
Additionally, the safe-haven demand for Silver could gain upward support from heightened geopolitical risks stemming from the prolonged Russia-Ukraine conflict and ongoing tensions in the Middle East. On Sunday, Israeli forces carried out attacks on two hospitals in northern Gaza, including a strike on the upper floor of al-Wafaa Hospital in Gaza City, which killed at least seven people and critically wounded others.
Silver is a precious metal highly traded among investors. It has been historically used as a store of value and a medium of exchange. Although less popular than Gold, traders may turn to Silver to diversify their investment portfolio, for its intrinsic value or as a potential hedge during high-inflation periods. Investors can buy physical Silver, in coins or in bars, or trade it through vehicles such as Exchange Traded Funds, which track its price on international markets.
Silver prices can move due to a wide range of factors. Geopolitical instability or fears of a deep recession can make Silver price escalate due to its safe-haven status, although to a lesser extent than Gold’s. As a yieldless asset, Silver tends to rise with lower interest rates. Its moves also depend on how the US Dollar (USD) behaves as the asset is priced in dollars (XAG/USD). A strong Dollar tends to keep the price of Silver at bay, whereas a weaker Dollar is likely to propel prices up. Other factors such as investment demand, mining supply – Silver is much more abundant than Gold – and recycling rates can also affect prices.
Silver is widely used in industry, particularly in sectors such as electronics or solar energy, as it has one of the highest electric conductivity of all metals – more than Copper and Gold. A surge in demand can increase prices, while a decline tends to lower them. Dynamics in the US, Chinese and Indian economies can also contribute to price swings: for the US and particularly China, their big industrial sectors use Silver in various processes; in India, consumers’ demand for the precious metal for jewellery also plays a key role in setting prices.
Silver prices tend to follow Gold’s moves. When Gold prices rise, Silver typically follows suit, as their status as safe-haven assets is similar. The Gold/Silver ratio, which shows the number of ounces of Silver needed to equal the value of one ounce of Gold, may help to determine the relative valuation between both metals. Some investors may consider a high ratio as an indicator that Silver is undervalued, or Gold is overvalued. On the contrary, a low ratio might suggest that Gold is undervalued relative to Silver.
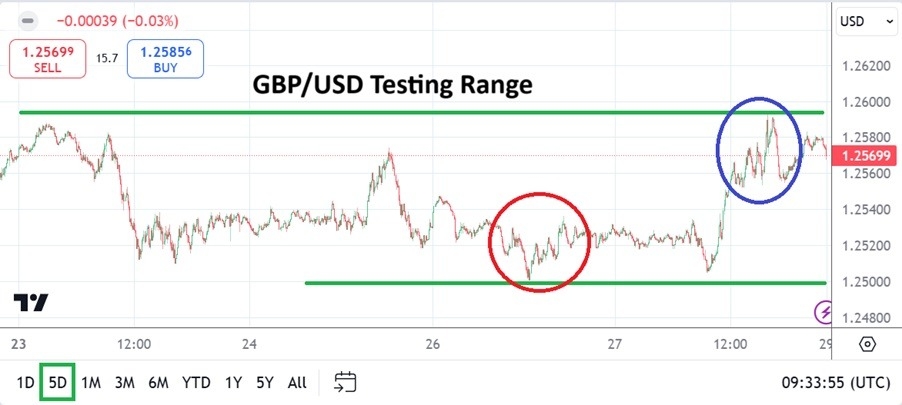
The GBP/USD finished the week near the 1.25700 level, as the lower range of the currency pair continues to see plenty of tests and nervous sentiment appears to be creating headwinds.
Holiday trading in Forex created rather tight ranges for most major currencies last week and the GBP/USD was no exception. The lower elements of the GBP/USD remain the status quo as USD centric strength continue to be exhibited. Financial institutions were open for business before going into the weekend, but volumes were lackluster and trading in Forex this coming week will be relatively quiet too.
The GBP/USD is near important support ratios that are definitely being watched by large financial institutions. The 1.25000 ratio remains an important psychological level which came within sight early and late last week, this until a slight buying surge returned the GBP/USD to a more comfortable looking value and within talking distance of the 1.26000 level. However, the currency pair is certainly facing tests and these will not disappear this coming week.

Traders who believe the GBP/USD is oversold should be careful. The GBP/USD suffered when the Bank of England was overly cautious on the 19th of December and kept their interest rate in place. The BoE is practicing extreme caution even as the U.K economy is lackluster. The economic picture for the U.K is unlikely to see a vast amount of improvement in the mid-term. Yes, the Bank of England is nervous about inflation, but better fiscal policy would help the inflation fight.
The testing of the 1.25000 level as behavioral sentiment in financial institutions is nervous about Bank of England policy and also fragile because of USD centric strength make for a volatile mid-term to come. President-Trump’s takeover of the U.S White House has been digested, and now attention has turned to U.S Fed policy which is becoming more cautious. If U.S interest rates are not lowered over the mid-term, and the BoE must consider an interest rate cut this sets the stage for more potential weakness in the GBP/USD via financial institutional outlook. Light holiday trading this week will not seek to bet against these mid-term notions. A lack of clarity is not helping.
After having attained values in September above the 1.34000 level, the GBP/USD looks oversold. However, conditions have changed regarding outlook for the currency pair and they are not about to alter dramatically. Speculators who have bias towards the GBP/USD should make sure they are not betting on notions that have no foundation.
The GBP/USD may appear to be in oversold territory to some speculators, but the price action of the currency pair matches the dynamics of the broad Forex market. Until sentiment begins to stabilize there will be no sudden shifts of momentum upwards for the GBP/USD that are sustained. The lower realms of the GBP/USD getting tested consistently the past week may see another round of these depths emerge.
Support did seem to be fairly strong around the 1..25100 mark with some outliers lower and perhaps this will continue to be the case in the coming days. Traders who want to participate in the GBP/USD like all of Forex this week should not be overly ambitious and be on the lookout for sudden bursts if large trades are transacted in inactive markets. Retail traders are reminded to use entry price points in Forex this coming week because spreads will widen in quiet conditions.
Gold price (XAU/USD) attracts some buyers to around $2,625 during the early Asian session on Monday. Donald Trump’s tariffs and trade policies could trigger trade conflicts, supporting the yellow metal. However, the outlook for fewer Federal Reserve (Fed) rate cuts in 2025 might cap the upside for Gold price. Trading volume is lighter than usual ahead of the New Year holiday.
Donald Trump’s potential return to the White House might intensify global trade tensions, fueling geopolitical crises and likely lifting the Gold price. “Trade tensions, potential conflicts, and unpredictable policies under his leadership might drive investors toward gold as a safe-haven asset,” said the managing director of RiddiSiddhi Bullions Limited.
Additionally, the escalating geopolitical tensions in the Middle East and the ongoing Russia-Ukraine war could boost the Gold price, a traditional safe-haven asset. On Sunday, Israeli forces carried out attacks on two hospitals in northern Gaza, including a strike on the upper floor of al-Wafaa Hospital in Gaza City, which killed at least seven people and critically wounded others.
On the other hand, the rising expectations for fewer Fed rate cuts could underpin the Greenback and exert some selling pressure on the USD-denominated commodity price. A strengthening USD generally weighs on bullion, reducing its appeal to investors seeking non-yielding assets.
Gold has played a key role in human’s history as it has been widely used as a store of value and medium of exchange. Currently, apart from its shine and usage for jewelry, the precious metal is widely seen as a safe-haven asset, meaning that it is considered a good investment during turbulent times. Gold is also widely seen as a hedge against inflation and against depreciating currencies as it doesn’t rely on any specific issuer or government.
Central banks are the biggest Gold holders. In their aim to support their currencies in turbulent times, central banks tend to diversify their reserves and buy Gold to improve the perceived strength of the economy and the currency. High Gold reserves can be a source of trust for a country’s solvency. Central banks added 1,136 tonnes of Gold worth around $70 billion to their reserves in 2022, according to data from the World Gold Council. This is the highest yearly purchase since records began. Central banks from emerging economies such as China, India and Turkey are quickly increasing their Gold reserves.
Gold has an inverse correlation with the US Dollar and US Treasuries, which are both major reserve and safe-haven assets. When the Dollar depreciates, Gold tends to rise, enabling investors and central banks to diversify their assets in turbulent times. Gold is also inversely correlated with risk assets. A rally in the stock market tends to weaken Gold price, while sell-offs in riskier markets tend to favor the precious metal.
The price can move due to a wide range of factors. Geopolitical instability or fears of a deep recession can quickly make Gold price escalate due to its safe-haven status. As a yield-less asset, Gold tends to rise with lower interest rates, while higher cost of money usually weighs down on the yellow metal. Still, most moves depend on how the US Dollar (USD) behaves as the asset is priced in dollars (XAU/USD). A strong Dollar tends to keep the price of Gold controlled, whereas a weaker Dollar is likely to push Gold prices up.
Dutch Bros Inc. NYSE: BROS is a thriving drive-thru coffee shop operator and franchisor operating 950 shops across 18 states. While primarily focused on coffee drinks, they also offer teas, smoothies, protein and energy drinks. They prioritize speed and efficiency with an app-driven, drive-thru-focused operating model catering to the on-the-go lifestyles of their customers.
(As of 12/27/2024 05:45 PM ET)
▼
$56.10
The company reported 29% YoY revenue growth and 2.7% YoY same-store sales (SSS) growth in its third quarter of 2024. The most impressive statistic is the average unit volume (AUV) of $2 million in sales generated within the confines of 950 square feet, which is the average size per shop.
The retail/wholesale sector company competes with Starbucks Co. NASDAQ: SBUX and Luckin Coffee Inc. OTCMKTS: LKNCY. Starbucks had 40,199 stores (52% company-owned and 48% licensed) at the end of its fiscal Q4 2024, adding 722 net new stores. Dutch Bros plans to add 150 stores in 2024.
Like CAVA Group Inc. NYSE: CAVA, Dutch Bros also has a promote-from-within philosophy as they map out the 6 steps to working your way up to a regional operator from Broista. They have 400 operator candidates with an average tenure of more than seven years. Each person in the pipeline is ready to be activated as a market operator. Dutch Bros received over 400,000 applications annually for 11,000 open field positions.
Dutch Bros reported Q3 2024 EPS of 16 cents, beating consensus estimates by 4 cents. Revenue rose 27.9% YoY to $338.2 million, firmly beating $324.97 million consensus estimates. System same-shop sales (SSS) rose 2.7% YoY, and transactions rose 0.8% YoY. Company-operated SSS rose 4% YoY, and transactions grew 2.4%. Dutch Bros opened 38 news shops, including 33 company-operated across 11 states. Company-operated shop gross profit rose to $68.4 million, up from $57 million last year.
The Dutch Rewards loyalty program saw the largest number of sign-ups since its launch, with over 1 million thanks to the rollout of its mobile ordering, of which 858 shops have enabled. In Q3, over 67% of total transactions were from Dutch Rewards members. Mobile orders make up 7% of total revenue, leaving much room for growth.
| High Forecast | $65.00 |
|---|---|
| Average Forecast | $51.27 |
| Low Forecast | $36.00 |
For the full year 2024, Dutch Bros raised its revenue guidance to $1.255 billion to $1.260 billion, up from previous guidance of $1.215 billion to $1.230 billion, versus $1.23 billion consensus estimates. SSS growth is expected to be around 4.25% YoY, up from low single digits, and SSS growth for Q4 is expected to be between 1% and 2%. The total number of system shop openings in 2024 is expected to be around 150.
Dutch Bros sells a very limited number of food items. By limited, we mean four items to be exact: chocolate chip muffin tops, lemon poppyseed muffin tops, orange cranberry muffin tops and granola bars. Just as Starbucks instituted snacks and hot breakfast items to bolster their food sales, Dutch Bros has been experimenting with expanded bakery and sweet and savory hot food items in six shops in Q3. The initial response has been excellent, and the company is looking to roll out more food items in 2026.
Dutch Bros CEO Christine Barone commented, “Based on the early results, it is likely a more robust food venue will play a role for Dutch Bros in the future, and we will continue our testing in the coming quarters. With food making up less than 2% of our sales right now, we clearly see the opportunity.”
A pennant pattern is a combination of a flagpole representing a parabolic price surge and a symmetrical triangle pattern at the peak comprised of a descending upper trendline and an ascending lower trendline converging at the apex point. A breakout occurs when the stock surges above the upper trendline, and a breakdown occurs if the stock falls below the lower trendline.
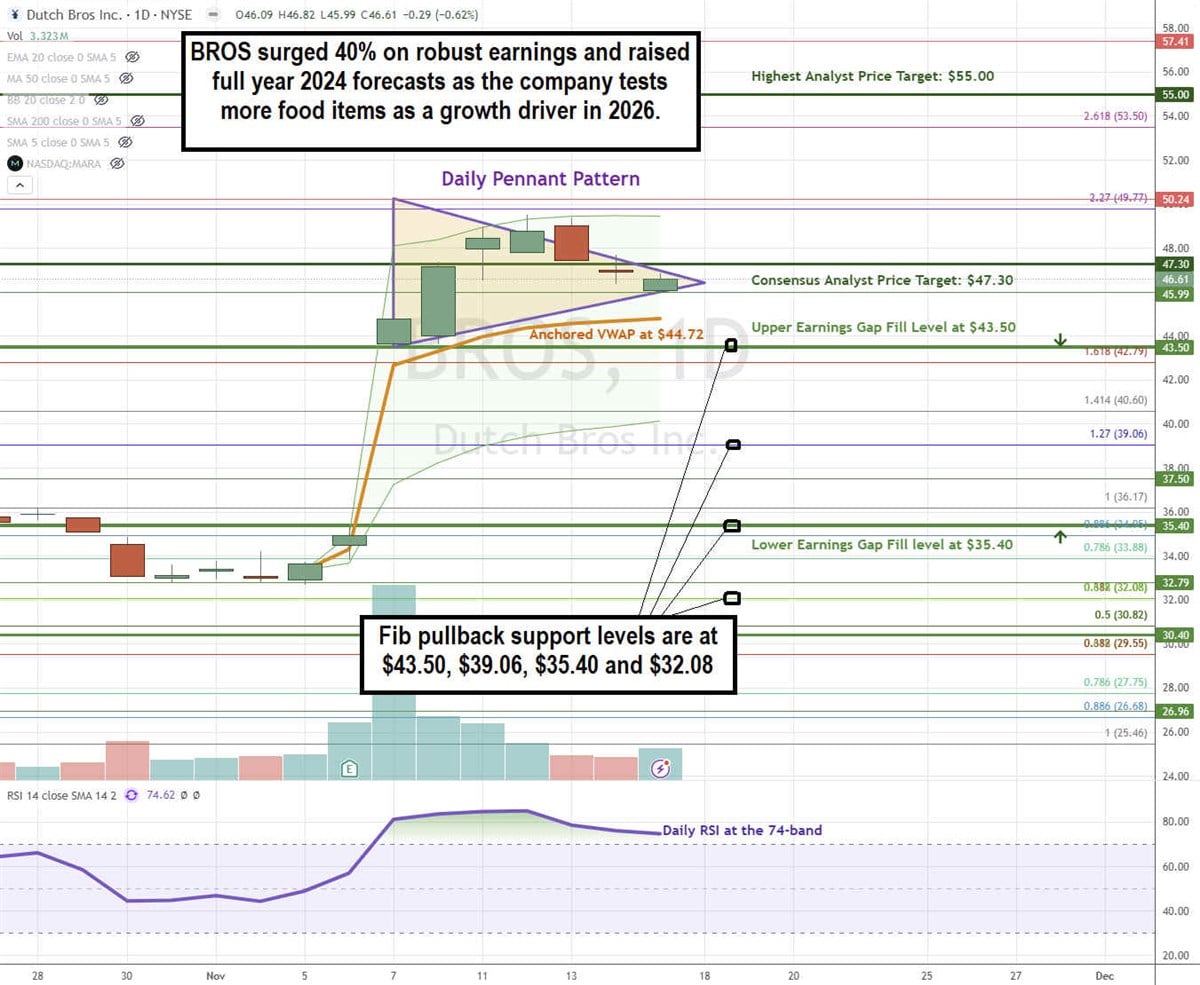
BROS formed the daily pennant after peaking at $50.24 following its Q3 earnings beat. The pennant is comprised of lower highs illustrated by the descending upper trendline and higher lows indicated by the ascending lower trendline. The daily anchored VWAP support is at $44.72. The daily RSI has been holding above the 70-band since the earnings price gap. Earnings price gap fill levels are at $43.50 and $35.40. Fibonacci (Fib) pullback support levels are at $43.50, $39.06, $35.40, and $32.08.
BROS’s average consensus price target is $47.30, implying a 1.4% upside and its highest analyst price target is $55.00. Eight analysts have Buy ratings, and three have Hold ratings on the stock. The stock has a 10.79% short interest.
Actionable Options Strategies: Bullish options investors can buy BROS stock on a deeper pullback using cash-secured puts at the gap fill and Fib pullback support levels.
Before you consider Dutch Bros, you’ll want to hear this.
MarketBeat keeps track of Wall Street’s top-rated and best performing research analysts and the stocks they recommend to their clients on a daily basis. MarketBeat has identified the five stocks that top analysts are quietly whispering to their clients to buy now before the broader market catches on… and Dutch Bros wasn’t on the list.
While Dutch Bros currently has a “Moderate Buy” rating among analysts, top-rated analysts believe these five stocks are better buys.

Just getting into the stock market? These 10 simple stocks can help beginning investors build long-term wealth without knowing options, technicals, or other advanced strategies.
Given that today’s low maintained the integrity of the uptrend relative to the trend line, it could be the completion of a pullback that is followed by strength. But what makes it interesting is that a drop below today’s low would question the integrity of the uptrend price structure as the trendline would be broken. Potential support around the 20-Day MA would already be broken prior to the trendline being reached. So, the bullish thesis would be proven wrong if there was a drop below today’s low.
A decisive decline below today’s low of 3.29 puts the recent interim swing low at 3.09 and the swing low at 2.98 (C, red) in view of being tested as support. Significantly, potential support around the 50-Day MA is also around the prior low, at 3.02. Together, a potentially significant support zone from 3.09 to 2.98 is identified.
Take note that the breakout from a symmetrical triangle pattern triggered above the 3.02 swing high. A test of that price area as support would be the second test following the triangle breakout and would follow the initial pullback to 2.98. Nonetheless, price behavior will lead the way forward by how it behaves around key price levels.
The next sign of strength would be with a rally above today’s high of 3.45. That would put natural gas back above the 20-Day prior support line and in place to track higher. Initial resistance may be seen around the prior highs of 3.55 or the 2023 high of 3.64.
A long-term bullish signal was triggered only recently in natural gas as it broke out above the top of the triangle pattern at 3.02 on November 20. That advance also triggered a continuation of the rising trend that began from the February trend low. The subsequent rise above the 2023 peak provided additional evidence for the bulls as that rise initiated a longer bullish trend reversal signal.
For a look at all of today’s economic events, check out our economic calendar.
Important DisclaimersThe content provided on the website includes general news and publications, our personal analysis and opinions, and contents provided by third parties, which are intended for educational and research purposes only. It does not constitute, and should not be read as, any recommendation or advice to take any action whatsoever, including to make any investment or buy any product. When making any financial decision, you should perform your own due diligence checks, apply your own discretion and consult your competent advisors. The content of the website is not personally directed to you, and we does not take into account your financial situation or needs.The information contained in this website is not necessarily provided in real-time nor is it necessarily accurate. Prices provided herein may be provided by market makers and not by exchanges.Any trading or other financial decision you make shall be at your full responsibility, and you must not rely on any information provided through the website. FX Empire does not provide any warranty regarding any of the information contained in the website, and shall bear no responsibility for any trading losses you might incur as a result of using any information contained in the website.The website may include advertisements and other promotional contents, and FX Empire may receive compensation from third parties in connection with the content. FX Empire does not endorse any third party or recommends using any third party’s services, and does not assume responsibility for your use of any such third party’s website or services.FX Empire and its employees, officers, subsidiaries and associates, are not liable nor shall they be held liable for any loss or damage resulting from your use of the website or reliance on the information provided on this website.Risk DisclaimersThis website includes information about cryptocurrencies, contracts for difference (CFDs) and other financial instruments, and about brokers, exchanges and other entities trading in such instruments. Both cryptocurrencies and CFDs are complex instruments and come with a high risk of losing money. You should carefully consider whether you understand how these instruments work and whether you can afford to take the high risk of losing your money.FX Empire encourages you to perform your own research before making any investment decision, and to avoid investing in any financial instrument which you do not fully understand how it works and what are the risks involved.
EUR/USD registered marginal gains after returning from the Christmas break on Thursday but failed to gather bullish momentum. Early Friday, the pair trades in a narrow channel at around 1.0400.
The table below shows the percentage change of Euro (EUR) against listed major currencies this week. Euro was the weakest against the US Dollar.
| USD | EUR | GBP | JPY | CAD | AUD | NZD | CHF | |
|---|---|---|---|---|---|---|---|---|
| USD | 0.25% | 0.38% | 0.90% | 0.30% | 0.49% | 0.42% | 0.95% | |
| EUR | -0.25% | 0.09% | 0.56% | 0.02% | 0.30% | 0.15% | 0.68% | |
| GBP | -0.38% | -0.09% | 0.45% | -0.07% | 0.21% | 0.06% | 0.60% | |
| JPY | -0.90% | -0.56% | -0.45% | -0.58% | -0.34% | -0.45% | -0.04% | |
| CAD | -0.30% | -0.02% | 0.07% | 0.58% | 0.23% | 0.12% | 0.64% | |
| AUD | -0.49% | -0.30% | -0.21% | 0.34% | -0.23% | -0.15% | 0.37% | |
| NZD | -0.42% | -0.15% | -0.06% | 0.45% | -0.12% | 0.15% | 0.50% | |
| CHF | -0.95% | -0.68% | -0.60% | 0.04% | -0.64% | -0.37% | -0.50% |
The heat map shows percentage changes of major currencies against each other. The base currency is picked from the left column, while the quote currency is picked from the top row. For example, if you pick the Euro from the left column and move along the horizontal line to the US Dollar, the percentage change displayed in the box will represent EUR (base)/USD (quote).
The data published by the US Census Bureau showed on Thursday that Initial Jobless Claims edged lower to 219,000 in the week ending December 21 from 220,000 in the previous week. This reading came in better than the market expectation of 224,000 but failed to influence the US Dollar’s (USD) valuation. In the second half of the day, the mixed action seen in Wall Street’s main indexes limited the pair’s upside.
The economic calendar will not offer any high-tier data releases on Friday. Meanwhile, US stock index futures trade in negative territory, reflecting a cautious market stance in the European session. Unless there is a noticeable improvement in risk mood in the American session, the pair could stay on the back foot.
Nevertheless, trading conditions are likely to remain thin, not allowing EUR/USD to make a decisive move in either direction.
The Relative Strength Index (RSI) indicator on the 4-hour chart stays near 50, highlighting EUR/USD’s indecisiveness.
First resistance for EUR/USD could be spotted at 1.0430-1.0440 (50-period Simple Moving Average (SMA), static level) before 1.0475, (100-period SMA) and 1.0500 (200-period SMA). On the downside, 1.0350 (static level) and 1.0300 (static level, round level) could be seen as next support levels if the pair flips 1.0400 (static level, round level) into resistance.
The Euro is the currency for the 19 European Union countries that belong to the Eurozone. It is the second most heavily traded currency in the world behind the US Dollar. In 2022, it accounted for 31% of all foreign exchange transactions, with an average daily turnover of over $2.2 trillion a day. EUR/USD is the most heavily traded currency pair in the world, accounting for an estimated 30% off all transactions, followed by EUR/JPY (4%), EUR/GBP (3%) and EUR/AUD (2%).
The European Central Bank (ECB) in Frankfurt, Germany, is the reserve bank for the Eurozone. The ECB sets interest rates and manages monetary policy. The ECB’s primary mandate is to maintain price stability, which means either controlling inflation or stimulating growth. Its primary tool is the raising or lowering of interest rates. Relatively high interest rates – or the expectation of higher rates – will usually benefit the Euro and vice versa. The ECB Governing Council makes monetary policy decisions at meetings held eight times a year. Decisions are made by heads of the Eurozone national banks and six permanent members, including the President of the ECB, Christine Lagarde.
Eurozone inflation data, measured by the Harmonized Index of Consumer Prices (HICP), is an important econometric for the Euro. If inflation rises more than expected, especially if above the ECB’s 2% target, it obliges the ECB to raise interest rates to bring it back under control. Relatively high interest rates compared to its counterparts will usually benefit the Euro, as it makes the region more attractive as a place for global investors to park their money.
Data releases gauge the health of the economy and can impact on the Euro. Indicators such as GDP, Manufacturing and Services PMIs, employment, and consumer sentiment surveys can all influence the direction of the single currency. A strong economy is good for the Euro. Not only does it attract more foreign investment but it may encourage the ECB to put up interest rates, which will directly strengthen the Euro. Otherwise, if economic data is weak, the Euro is likely to fall. Economic data for the four largest economies in the euro area (Germany, France, Italy and Spain) are especially significant, as they account for 75% of the Eurozone’s economy.
Another significant data release for the Euro is the Trade Balance. This indicator measures the difference between what a country earns from its exports and what it spends on imports over a given period. If a country produces highly sought after exports then its currency will gain in value purely from the extra demand created from foreign buyers seeking to purchase these goods. Therefore, a positive net Trade Balance strengthens a currency and vice versa for a negative balance.
Silver price (XAG/USD) falls to near $29.60 in a thin trading volume session following holidays on Christmas and Boxing Day on Friday. The white metal is under pressure even though tensions in the Middle East region between Israel and Iran have escalated.
On Thursday, Israel launched missiles at the Iran-backed Houthis military and bombed Yemini airport. After the air assault, Israeli Prime Minister Benjamin Netanyahu said in an interview with an Israeli TV station of the Houthis, “We are just getting started with them”. Israel retaliated to last week’s air assault by Iran.
Historically, heightened geopolitical tensions improve the demand for safe-haven assets, such as Silver.
Meanwhile, the US Dollar Index (DXY), which tracks the Greenback’s value against six major currencies, oscillates in a tight range above the key support of 108.00. 10-year US Treasury yields rise to near 4.61%. Higher yields on interest-bearing assets elevate the opportunity cost of non-yielding assets, making them an expensive bet for investors.
US bond yields remain firm on expectations that the Federal Reserve (Fed) will deliver fewer interest rate cuts in 2025. The Fed is expected to slow down the policy-easing cycle amid confidence in the United States (US) economic outlook.
Silver price stays below the upward-sloping trendline, plotted from the February 29 low of $22.30 on a daily timeframe, after a breakdown near $30.00. The white metal wobbles around the 200-day Exponential Moving Average (EMA), suggesting that the longer-term outlook is uncertain.
The 14-day Relative Strength Index (RSI) rebounds to near 40.00. A fresh bearish momentum would trigger if it fails to break above that level.
Looking down, the September low of $27.75 would act as key support for the Silver price. On the upside, the 50-day EMA around $30.90 would be the barrier.
Silver is a precious metal highly traded among investors. It has been historically used as a store of value and a medium of exchange. Although less popular than Gold, traders may turn to Silver to diversify their investment portfolio, for its intrinsic value or as a potential hedge during high-inflation periods. Investors can buy physical Silver, in coins or in bars, or trade it through vehicles such as Exchange Traded Funds, which track its price on international markets.
Silver prices can move due to a wide range of factors. Geopolitical instability or fears of a deep recession can make Silver price escalate due to its safe-haven status, although to a lesser extent than Gold’s. As a yieldless asset, Silver tends to rise with lower interest rates. Its moves also depend on how the US Dollar (USD) behaves as the asset is priced in dollars (XAG/USD). A strong Dollar tends to keep the price of Silver at bay, whereas a weaker Dollar is likely to propel prices up. Other factors such as investment demand, mining supply – Silver is much more abundant than Gold – and recycling rates can also affect prices.
Silver is widely used in industry, particularly in sectors such as electronics or solar energy, as it has one of the highest electric conductivity of all metals – more than Copper and Gold. A surge in demand can increase prices, while a decline tends to lower them. Dynamics in the US, Chinese and Indian economies can also contribute to price swings: for the US and particularly China, their big industrial sectors use Silver in various processes; in India, consumers’ demand for the precious metal for jewellery also plays a key role in setting prices.
Silver prices tend to follow Gold’s moves. When Gold prices rise, Silver typically follows suit, as their status as safe-haven assets is similar. The Gold/Silver ratio, which shows the number of ounces of Silver needed to equal the value of one ounce of Gold, may help to determine the relative valuation between both metals. Some investors may consider a high ratio as an indicator that Silver is undervalued, or Gold is overvalued. On the contrary, a low ratio might suggest that Gold is undervalued relative to Silver.
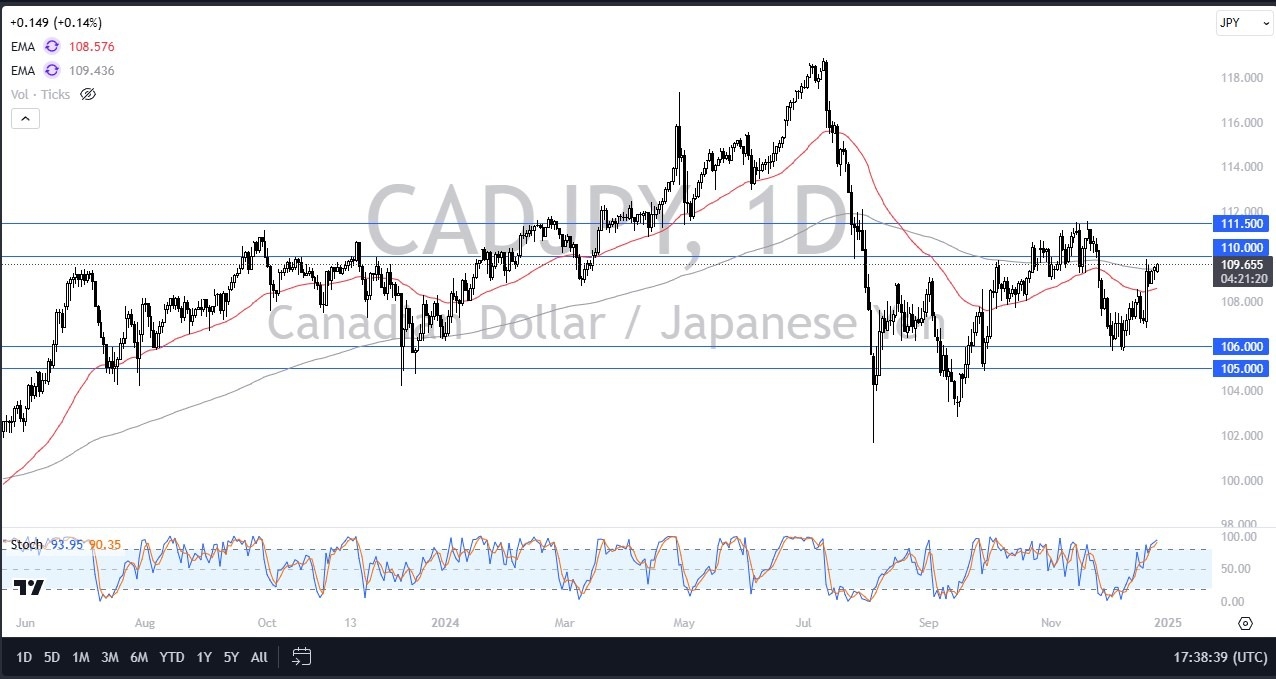
Now, having said all of that, the US dollar is beating up on the Japanese yen, and I think that does have a little bit of a knock-on effect, but it’s also worth noting that we are at the 200-day EMA. The stochastic oscillator is starting to crossover in the overbought condition as well, and as this market has been somewhat sideways over the last several months, that could come into play.
However, the interest rate differential between most currencies and the Japanese yen is still fairly wide, although it’s probably worth pointing out in Canada, not as much as many of the other majors. The biggest thing that this pair has going for it is the fact that it’s denominated in Japanese yen. I do not like the Canadian dollar at all, but in this case, the Canadian dollar just is a touch stronger than the Japanese yen.
You still get paid swap at the end of every day, assuming that you’re with a reputable broker, but you also have to recognize the fact that there is going to be quite a bit more work to do here than there would be in say the US dollar against the yen or maybe even the pound against the yen. Short-term pullback should be thought of as buying opportunities with a 50 day EMA, probably offering quite a bit of support as well. Furthermore, we also have the 106 yen level that drops down to the 105 yen level offering a large region of support. I’m a buyer, not a seller, but not an avid buyer.
Want to trade our daily forex analysis and predictions? Here’s a list of forex brokers in Japan to check out.