The main category of Forex News.
You can use the search box below to find what you need.
[wd_asp id=1]
The main category of Forex News.
You can use the search box below to find what you need.
[wd_asp id=1]
From a fundamental analysis standpoint, there are concerns about whether or not demand will be strong enough to warrant higher pricing, but I do think eventually demand does pick up. Keep in mind that the central banks around the world continue to loosen monetary policy, and eventually that should have some type of influence on business expenditures. If the economy starts moving again, the first place that you see benefit from it typically will be the crude oil markets, as energy of course is necessary for the economy to get going, especially when you’re talking about international trade.

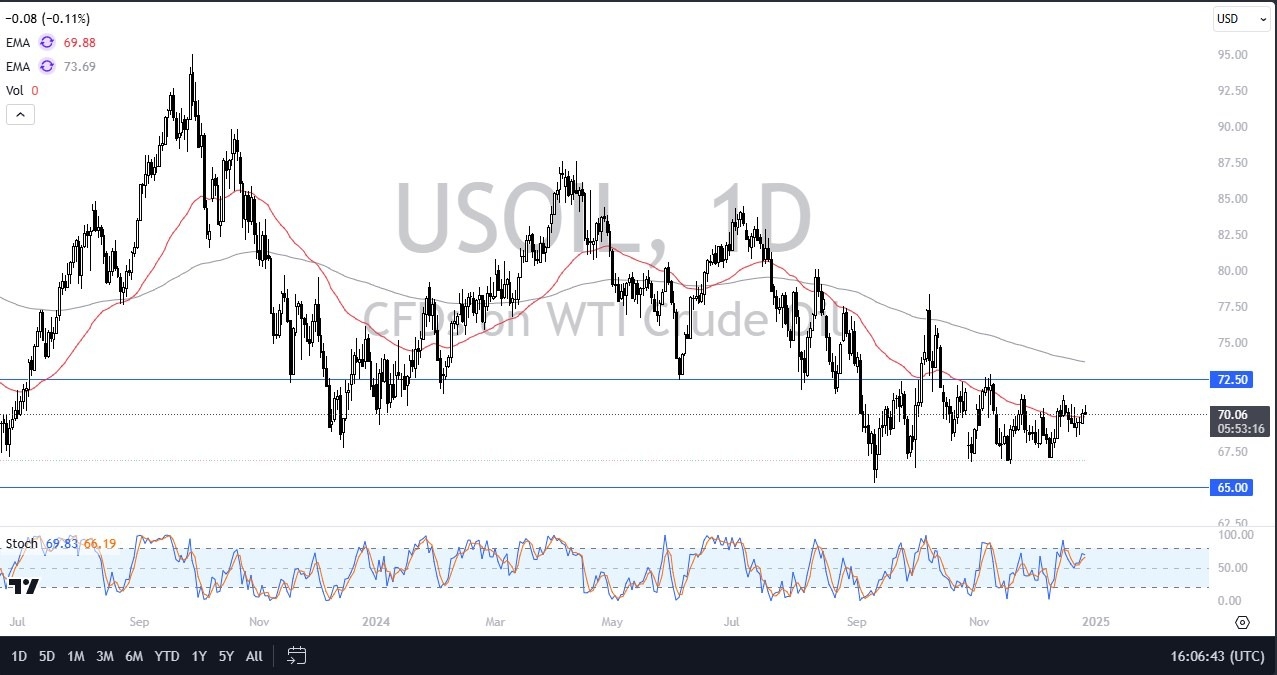
The technical analysis for this crude oil market is fairly neutral at the moment, but it is worth noting that we are hanging around the crucial 50 Day EMA. The $72.50 level above is a significant amount of resistance and breaking above that would obviously be a major victory for the bulls. The 200 Day EMA sits just above there, and I do think that is going to be a bit of an issue. On the other hand, to the downside we have plenty of support near the $67 level, and then again at the $65 level. When you look at the longer-term charts, the $65 level is a major support level going back at least a couple of years. This suggests to me that perhaps we are getting close to bottoming completely, and now we are just waiting for some type of fundamental reason to continue going higher. I think we get that sooner or later, but again, I think this is probably a story for 2025.
In the meantime, I think a lot of traders are just simply buying the dips and taking advantage of “cheap barrels of oil” anytime they get the opportunity. However, I don’t know that many people out there are confident enough to hang onto their long positions, and that might be part of what we are seeing play out on the charts.
Ready to trade the daily crude oil Forex forecast? Here’s a list of some of the best Oil trading platforms to check out.
Gold (XAU/USD) is trading at $2,633.03, down 0.03%, consolidating above its pivot at $2,631.59. The 50-day EMA at $2,624.82 offers near-term support, while the 200-day EMA at $2,639.07 signals broader consolidation.
Immediate resistance is at $2,651.62, with potential to rise toward $2,676.43. Support lies at $2,608.24, with a break below targeting $2,584.66.
Gold’s outlook remains cautiously optimistic above $2,630, but a breach could trigger bearish momentum.
Natural gas rallied to a new trend high of 4.01 on Thursday and generated another sequential higher daily high and higher low, the sixth day in a row. At the time of this writing, it continues to trade near the lows of the day, which was 3.67.
That is short-term support and if it is broken to the downside a drop to test support around the prior trend high of 3.56 is likely or a test of the 20-Day MA, currently at 3.37. The 20-Day line is a key dynamic support indicator for the near-term bull trend as it was tested and held as support on several days since the October swing low (red). That trend is marked by a rising ABCD pattern (red).
If natural gas can retain a position above the 20-Day line, it has a chance to continue higher as the uptrend lower boundary would be retained. It is interesting to notice that there are several rising trendlines that cross above current price levels at approximately 4.39 and 4.45.
Those levels are within a potential resistance zone that begins around 4.33 to 4.42. That price level is the initial target from the red ABCD pattern shown on the chart. The crossovers also show possible resistance around the price zone. Therefore, it makes sense to expand the target zone to 4.33 to 4.45.
Notice that natural gas could continue to advance higher and stay within the top channel line and internal rising trend line. Together, they generate a potential rising wedge pattern. One possibility to consider is that natural gas could proceed and stay within the boundaries of the pattern to eventually reach the 4.33 target without breaking through either boundary line of the wedge.
For a look at all of today’s economic events, check out our economic calendar.
A decisive rally above the top of the flag at 71.41 will trigger a breakout. The prior interim swing high at 71.79 should then easily be exceeded if there is upside momentum. That would put the recent swing high at 73.27 as an initial upside target. However, a breakout of the bull flag would solidify the recent reclaims of the 20-Day and 50-Day MAs and set the stage for improved bullish sentiment. Higher initial targets following a flag breakout include the 61.8% Fibonacci retracement at 74.42 and the 78.6% retracement at 76.47.
Stepping back to consider the larger pattern, the fractal nature of the market is shown by the recent small symmetrical triangle consolidation pattern that formed following a larger symmetrical triangle. On an annual basis, crude oil looks likely to close negative for 2024 and at a lower annual closing price than 2023.
This would be the second year in a row that crude ended the year lower than the year before. It reflects the bearish nature of the breakdown from the large symmetrical triangle in September and subsequent bearish small symmetrical triangle. The small triangle is considered potentially bearish since it is contained within a larger downtrend price structure, and it formed below prior support and now resistance that is represented by the lower boundary line of the triangle.
Price volatility has compressed the past couple of months during the consolidation phase. This could set the stage for a spike in volatility if the breakout from the small triangle starts to see greater interest. A bullish breakout of the flag would go a long way towards attracting buyers.
For a look at all of today’s economic events, check out our economic calendar.
Coffee price world jar is fine
Giá cà phê Robusta trên sàn London cập nhật lúc 15 giờ 00 phút ngày December 26, 2024 dao động từ 4754 – 5041 USD/tấn. Cụ thể, kỳ hạn giao hàng tháng March 2025 là 5041 USD/tấn; kỳ hạn giao hàng tháng May 2025 là 4953 USD/tấn; kỳ hạn giao hàng tháng July 2025 là 4858 USD/tấn; kỳ hạn giao hàng tháng September 2025 tăng 4754 USD/tấn.
| Người dân Gia Lai chuẩn bị công cụ để thu hoạch cà phê. Ảnh: Hiền Mai |
Tương tự, giá cà phê Arabica trên sàn New York chiều ngày December 26, 2024, cũng dao động từ 307.45 – 328.60 cent/lb. Cụ thể, kỳ hạn giao hàng tháng March 2025 là 328.60 cent/lb; kỳ giao hàng tháng May 2025 là 323.35 cent/lb; kỳ giao hàng tháng July 2025 là 315.95 cent/lb và kỳ giao hàng tháng September 2025 là 307.45 cent/lb.
Giá cà phê Arabica Brazil được cập nhật như sau: Kỳ giao hàng tháng March 2025 là 408.60 USD/tấn; kỳ giao hàng tháng May 2025 là 401.45 USD/tấn; kỳ giao hàng tháng July 2025 là 391.10 USD/tấn và kỳ hạn giao hàng tháng September 2025 là 375.35 USD/tấn.
Giá cà phê trong nước bật tăng
Theo thông tin từ Giacaphe.com, cập nhật giá cà phê lúc 15 giờ 30 phút hôm nay ngày December 26, 2024, giá cà phê trong nước vẫn giữ ở mức 121.500 đồng/kg, tăng +800 đồng/kg so với ngày hôm qua.
 |
| Sau khi thu hoạch người dân làm sạch cà phê. Ảnh: Hiền Mai |
Giá cà phê cao nhất thu mua ở các vùng trọng điểm của Tây Nguyên được ghi nhận ở mức 121.700 đồng/kg. Trong đó, 3 tỉnh đều có mức tăng +800 đồng/kg (giá cà phê hôm nay tại Dak Lak at 121.500 VND/kg; coffee price at Lam Dong has a price of 121.000 VND/kg; coffee price at Gia Lai hôm nay có mức giá 121.400 đồng/kg). Riêng, giá cà phê tại Dak Nong là 121.700 đồng/kg, tăng +700 đồng/kg so với ngày hôm qua.
The domestic coffee prices that Giacaphe.com lists every day are calculated based on the prices of two world coffee exchanges combined with continuous surveys from businesses and purchasing agents in key coffee growing areas across the country.
Y5Cafe always tries to stay as close as possible to each region, however there will be days when the listed price does not completely match the local coffee purchase price, but Y5Cafe believes that the listed information is a valuable reference source for farmers and coffee purchasing businesses.
Coffee price prediction tomorrow 27/ 12 / 2024
Theo ghi nhận, giá cà phê ngày December 26, 2024 tại khu vực Tây Nguyên dao động từ 120.600 – 121.400 đồng/kg, tăng 700 – 800 đồng/kg so với ngày trước đó.
Dựa trên diễn biến thị trường hiện tại, giới chuyên gia dự đoán giá cà phê trong nước ngày December 27, 2024 sẽ tăng nhẹ từ 100 – 200 đồng/kg. Tuy nhiên, giá cà phê còn phụ thuộc vào nhiều yếu tố như thời tiết, tình hình thu hoạch và biến động tỷ giá.
Sources: https://congthuong.vn/du-bao-gia-ca-phe-ngay-mai-27122024-gia-ca-phe-trong-nuoc-tang-100-200-dongkg-366377.html
Important DisclaimersThe content provided on the website includes general news and publications, our personal analysis and opinions, and contents provided by third parties, which are intended for educational and research purposes only. It does not constitute, and should not be read as, any recommendation or advice to take any action whatsoever, including to make any investment or buy any product. When making any financial decision, you should perform your own due diligence checks, apply your own discretion and consult your competent advisors. The content of the website is not personally directed to you, and we does not take into account your financial situation or needs.The information contained in this website is not necessarily provided in real-time nor is it necessarily accurate. Prices provided herein may be provided by market makers and not by exchanges.Any trading or other financial decision you make shall be at your full responsibility, and you must not rely on any information provided through the website. FX Empire does not provide any warranty regarding any of the information contained in the website, and shall bear no responsibility for any trading losses you might incur as a result of using any information contained in the website.The website may include advertisements and other promotional contents, and FX Empire may receive compensation from third parties in connection with the content. FX Empire does not endorse any third party or recommends using any third party’s services, and does not assume responsibility for your use of any such third party’s website or services.FX Empire and its employees, officers, subsidiaries and associates, are not liable nor shall they be held liable for any loss or damage resulting from your use of the website or reliance on the information provided on this website.Risk DisclaimersThis website includes information about cryptocurrencies, contracts for difference (CFDs) and other financial instruments, and about brokers, exchanges and other entities trading in such instruments. Both cryptocurrencies and CFDs are complex instruments and come with a high risk of losing money. You should carefully consider whether you understand how these instruments work and whether you can afford to take the high risk of losing your money.FX Empire encourages you to perform your own research before making any investment decision, and to avoid investing in any financial instrument which you do not fully understand how it works and what are the risks involved.
The West Texas Intermediate crude oil market has shown itself to be somewhat positive in the early hours on Tuesday as it looks like we are trying to grind our way toward the $72.50 level again, the $72.50 level is a significant resistance barrier, so I think it does take a little bit of effort to finally get above there, but if and when we do, I think we really start to take off. Over the last several months, we’ve been building a bit of a base in this market, and now the question is, will we get some type of momentum? Short-term pullbacks, for me at least, are going to continue to be buying opportunities.
The Brent market, of course, looks very much the same and is testing the crucial 50-day EMA. The 50-day EMA, of course, is an indicator that a lot of people pay attention to. And with that being the case, I suspect it’s probably only a matter of time before we start to see people chase. If we can break above the $76 level, I think that opens up the next leg higher.
The GBP/USD exchange rate remained relatively unchanged this week, as the forex market experienced low volumes due to the Christmas Holiday. It has stalled at 1.2545, a few pips above this month’s low of 1.2478.
The GBP/USD has also stalled because there was no important economic data from the UK and the United States. The only data that came out were Monday’s US consumer confidence and UK GDP numbers.
While these are crucial numbers, their impact on the pair was muted because they came a few days after the Bank of England (BoE) and the Federal Reserve made their final decisions of the year.
The BoE left interest rates at 4.75% as it expressed concerns about the country’s inflation, which rose again in November. However, with the UK economy contracting, there are odds that the bank will cut interest rates several times in 2025.
The Fed, on the other hand, slashed interest rates by 0.25%, bringing the year-to-date cuts to 1% It, however, expressed a more hawkish tone as it hinted that it will deliver just two cuts in 2025. The Fed is highly concerned that Trump’s policies will be highly inflationary.
Some of his most notable policies are mass deportations, tax cuts, which will increase the budget deficit, and tariffs.
The next data to watch on Thursday will be initial and continuing jobless jobs numbers. While these are important numbers, their impact on the Fed and the GBP/USD pair will be muted.
The daily chart reveals that The GBP/USD exchange rate has been downtrend in the past few days. It has dropped below the important support at 1.2665, its August lows.
The pair has also moved below the 50-day moving average. Also, oscillators like the MACD and the Relative Strength Index (RSI) have all pointed downwards.
On the other hand, it has formed a double-bottom pattern at 1.2478. A double-bottom often leads to more gains. Therefore, the pair will likely have a brief rebound in the next few days. Such a move will see it rise to the next key resistance level at 1.2665.
Ready to trade our free trading signals? We’ve made a list of the best UK forex brokers worth using.
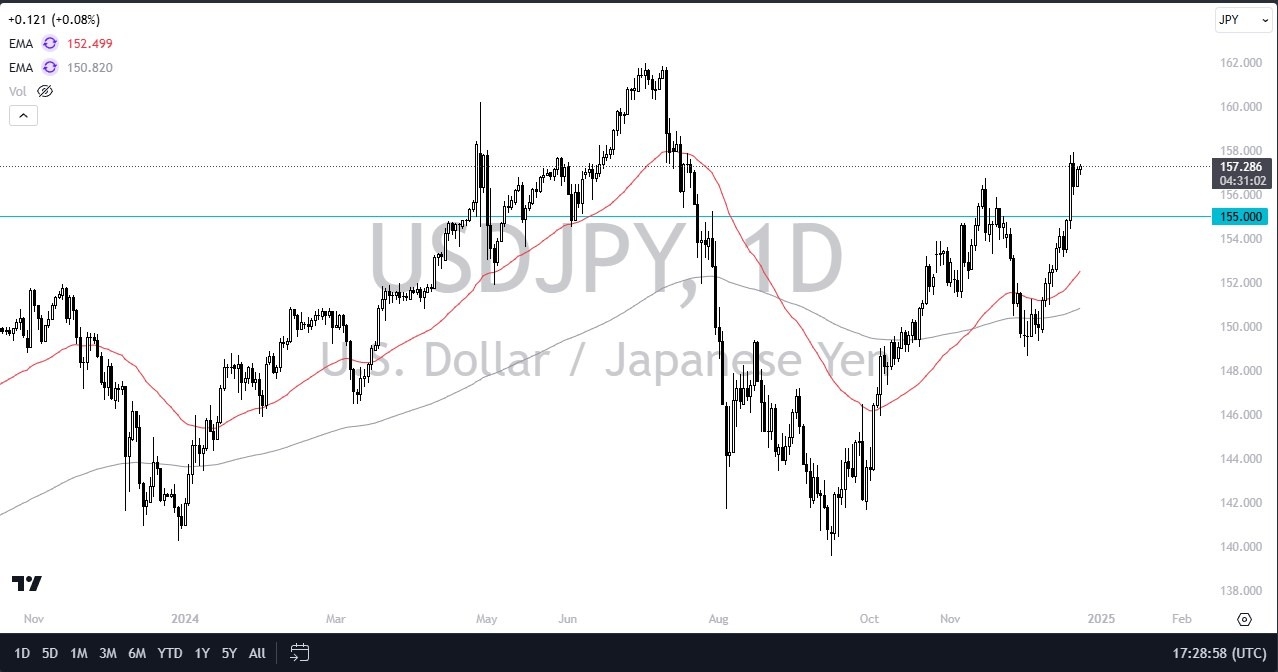
Short-term pullbacks at this point in time will continue to see plenty of support, and I think the ¥155 level continues to offer a short-term floor in the market. Interest rate differential favors the US dollar which is something that you should not forget anytime soon, as the US dollar continues to see interest rates climb. Despite what the Fed’s doing, most traders focus on what the Fed says, but what you really need to do is pay attention to what the bond markets do. Now we have pretty high yields in the US, ten-year especially. So that continues to make the US dollar like a wrecking ball against most other currencies, and especially the Japanese yen, which has a whole litany of problems by itself.
The Bank of Japan recently raised rates a bit. We’ve completely turned around since then, and now it looks like we are going to continue to climb again. A break above the ¥158 level could open up the possibility of a move to the ¥162 level. I have no interest whatsoever in shorting this USD/JPY market, and it’s very possible we may go much higher before it’s all said and done, as the Federal Reserve looks like they will be a little bit more hawkish in 2025 than people had anticipated.
Want to trade our USD/JPY forex analysis and predictions? Here’s a list of forex brokers in Japan to check out.
The fact that the liquidity wouldn’t have been there comes into play as well. That being said, despite the fact that the British pound isn’t necessarily a currency I love, it’s not the worst one out there. And the worst one out there might actually be the Japanese yen, maybe the Swiss franc. It’s kind of a tossup at this point. You could even throw the euro into that group.
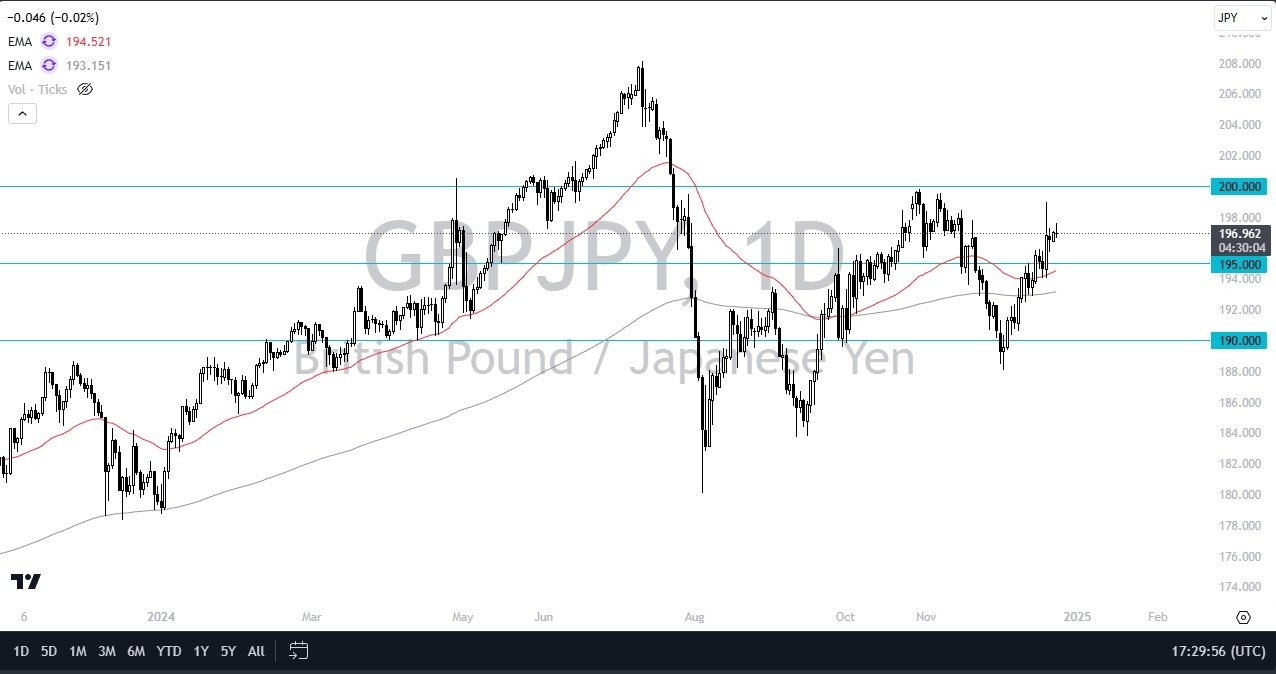
So, I do think then if we get a little bit of a pullback, it’s probably worth paying close attention to the ¥195 level, which is an area that’s a large round, psychologically significant figure, an area that’s seen some market action previously. And an area that the 50 day EMA is rapidly approaching. If it can break above the ¥195 level, then the short term technical flaw will just simply move up with that 50 day EMA.
On the upside, we have the ¥200 level, which has been like a brick wall for the British pound. But if and when we finally break above there, it’s likely that we would see this GBP/JPY pair really start to take off to the upside, perhaps driving the British pound all the way up to the ¥208 level, which of course was the recent swing high. I have no interest in buying the yen, which means I have no interest in shorting this pair.
Want to trade our daily forex analysis and predictions? Here’s a list of forex brokers in Japan to check out.