The main category of Forex News.
You can use the search box below to find what you need.
[wd_asp id=1]
The main category of Forex News.
You can use the search box below to find what you need.
[wd_asp id=1]
According to licensed trading platforms, the EUR/USD pair is facing pressure again, as it failed to extend the recovery it achieved last Friday. European Central Bank President Christine Lagarde told the Financial Times at the beginning of trading this week that she is optimistic that the central bank is on track to achieve its 2.0% inflation target. Lagarde stated that we are “very close” to the point where “we achieve sustainably a 2% inflation rate over the medium term.”
The comments reinforce the view that declining inflation will allow the ECB to “outperform” similar central banks in the coming months, keeping the euro under pressure, especially against the US dollar. Additionally, the ongoing political and economic uncertainty plaguing the largest economies in the Eurozone continues to affect investor sentiment towards the euro.
In this context, and with the latest announcement, the US Federal Reserve indicated that it is likely to cut US interest rates only twice in 2025 amid a recovery in economic activity. However, the US dollar declined slightly on Friday following the release of some US inflation figures in personal consumption expenditures, which came in below expectations, reducing the US dollar’s rise.
According to economic calendar data, the core personal consumption expenditures price index in the United States increased by 0.1% on a monthly basis in November, half the expected rate of 0.2%. The year-over-year comparison remained unchanged at 2.8% in November, while the market expected an increase to 2.9%. Overall, this has provided some relief in the market and intensive selling of the US dollar, which needs a constant supply of “hawkish” data surprises to fuel its rise. Therefore, any accurate or below-expectations data will lead to declines in the US currency.
However, some forex analysts believe that by early 2025, the weakness of the EUR/USD pair may resume with the confirmation of more superior US economic performance. Also, the setup for the markets until 2025 is good for the trends to continue. Moreover, the US elections and the shift to a stronger US dollar have received support from the Federal Open Market Committee (FOMC), which reduced expectations of interest rate cuts in 2025.
According to the forex analysis team at MUFG Bank, “Our outlook for the EUR/USD outlook remains that the euro will decline to near parity in the first quarter of next year before stabilizing and recovering moderately in the second half of the year.” MUFG Bank believes this is due to the divergence in economic performance between the Eurozone and the United States, which continued during the first part of the year before fading.
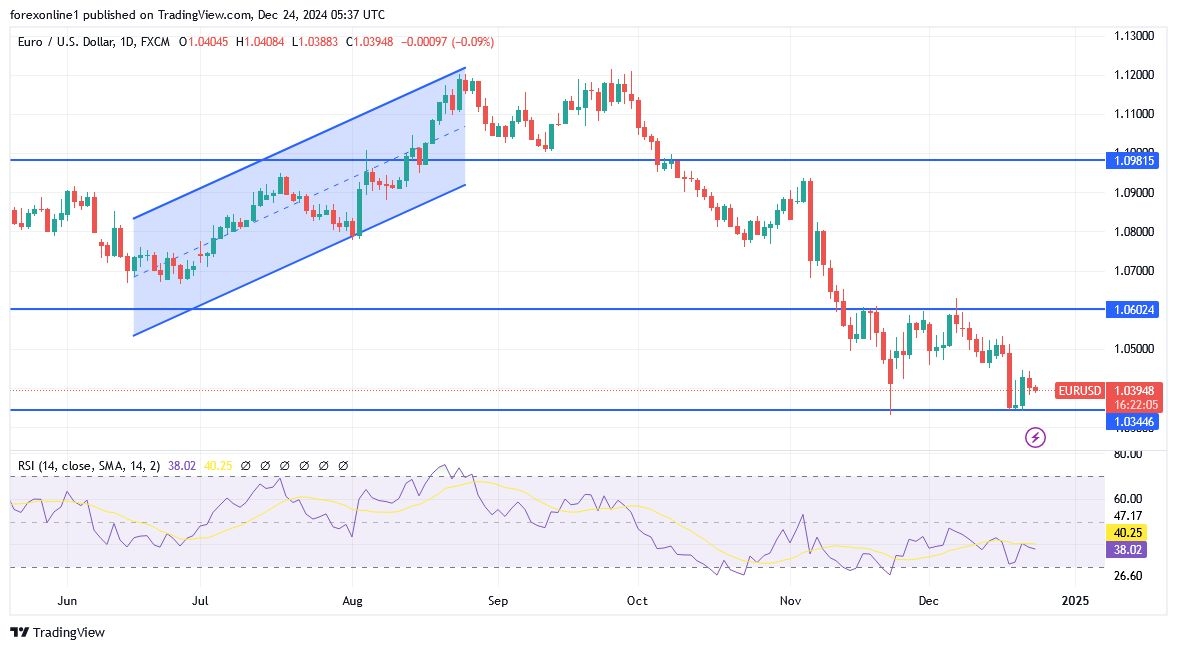
Keep in mind that the EUR/USD trend will remain bearish and stability below the 1.05 support confirms the strength of the bears’ control. The current trading week includes the Christmas holidays, which affects liquidity and investors’ desire to trade.

Dear reader, according to the latest trading performance of the EUR/USD pair, there is now decent support at the horizontal support line 1.0344, which is where the euro’s weakness was bought last week over three consecutive days. Technically, any weakness in the euro-dollar pair this week would likely test this area first and may be bought again, allowing for a more neutral tone. However, caution should be exercised as a break below the 1.0344 support level could lead us to the next important support level of 1.0230 in a relatively short period. From there, it will quickly reach the euro-dollar parity. Overall, market conditions will be tense in the next two weeks, but there are still some economic reports to watch. Low liquidity can often lead to large movements, indicating that we are not necessarily in a state of idleness for trading.
As mentioned before and we confirm now, any attempts by the EUR/USD to recover upwards will be weak and prone to a rapid collapse.
Ready to trade our daily EUR/USD Forex analysis? We’ve made this forex brokers list for you to check out.
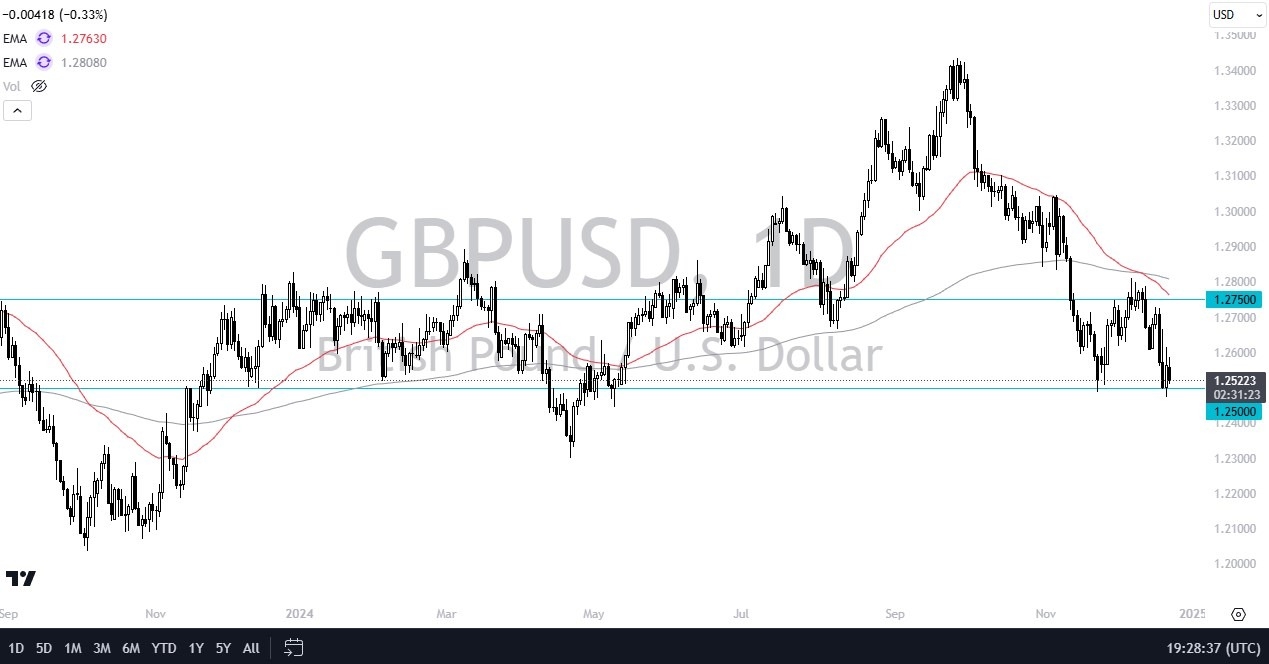
All things being equal, I do think it could very well be that case. We also have to keep in mind that this is a market that is dealing with a serious lack of liquidity at this point. Therefore, we have to pay attention to the idea of the holidays being a time where you probably should be leaving this alone. But even if we do have to trade this or we find that we are trading this, if we were to break down below the 1.25 level, I think the downside is somewhat limited, at least in the short term.
Short term speaking, I think you’ve got a situation where GBP/USD traders will be looking at this through the prism of trying to find value. But if we break down below the 1.25 level, 1.23 is an area where we’ve seen buyers come in previously, and it wouldn’t surprise me to see the British pound defended there. On the upside, the 1.275 zero level has been extraordinarily difficult to get above, and now we have the 50 day EMA there as well. I suspect the next couple of days will be more sideways with a downward slant than anything else.
Ready to trade our daily GBP/USD Forex analysis? Check out the best forex trading company in UK worth using.
EUR/USD closed marginally lower on Monday but the pair remained confined within a tight channel. The pair fluctuates near 1.0400 in the European morning on Tuesday as trading conditions thin out on Christmas Eve.
The table below shows the percentage change of Euro (EUR) against listed major currencies last 7 days. Euro was the weakest against the US Dollar.
| USD | EUR | GBP | JPY | CAD | AUD | NZD | CHF | |
|---|---|---|---|---|---|---|---|---|
| USD | 1.09% | 1.16% | 1.87% | 0.88% | 1.96% | 2.33% | 0.60% | |
| EUR | -1.09% | 0.07% | 0.75% | -0.21% | 0.85% | 1.22% | -0.48% | |
| GBP | -1.16% | -0.07% | 0.71% | -0.27% | 0.78% | 1.15% | -0.54% | |
| JPY | -1.87% | -0.75% | -0.71% | -0.95% | 0.14% | 0.49% | -1.17% | |
| CAD | -0.88% | 0.21% | 0.27% | 0.95% | 1.07% | 1.43% | -0.26% | |
| AUD | -1.96% | -0.85% | -0.78% | -0.14% | -1.07% | 0.36% | -1.33% | |
| NZD | -2.33% | -1.22% | -1.15% | -0.49% | -1.43% | -0.36% | -1.67% | |
| CHF | -0.60% | 0.48% | 0.54% | 1.17% | 0.26% | 1.33% | 1.67% |
The heat map shows percentage changes of major currencies against each other. The base currency is picked from the left column, while the quote currency is picked from the top row. For example, if you pick the Euro from the left column and move along the horizontal line to the US Dollar, the percentage change displayed in the box will represent EUR (base)/USD (quote).
Mixed macroeconomic data releases from the US limited the US Dollar’s (USD) gains on Monday and helped EUR/USD find a foothold.
The US Census Bureau reported that Durable Goods Orders declined by 1.1% on a monthly basis in November, coming in worse than the market expectation for a decrease of 0.4%. Meanwhile, the Conference Board’s Consumer Confidence Index fell to 104.7 in December from 112.8 (revised from 111.7) in November. On a positive note, New Home Sales increased by 5.9% in November following the 14.8% decrease recorded in October.
The economic calendar will not feature any macroeconomic data releases. Bond and stock markets in the US will operate half day on Tuesday and remain closed on Christmas Day on Wednesday.
The Relative Strength Index (RSI) indicator on the 4-hour chart stays slightly below 50 but EUR/USD fluctuates at around the 20-period Simple Moving Average (SMA), highlighting a lack of directional momentum.
First resistance could be spotted at 1.0440 (static level) before 1.0490-1.0500, (100-period Simple Moving Average (SMA), static level). On the downside, 1.0350 (static level) and 1.0300 (static level, round level) could be seen as next support levels if EUR/USD confirms 1.0400 (static level, round level) as resistance.
The Euro is the currency for the 19 European Union countries that belong to the Eurozone. It is the second most heavily traded currency in the world behind the US Dollar. In 2022, it accounted for 31% of all foreign exchange transactions, with an average daily turnover of over $2.2 trillion a day. EUR/USD is the most heavily traded currency pair in the world, accounting for an estimated 30% off all transactions, followed by EUR/JPY (4%), EUR/GBP (3%) and EUR/AUD (2%).
The European Central Bank (ECB) in Frankfurt, Germany, is the reserve bank for the Eurozone. The ECB sets interest rates and manages monetary policy. The ECB’s primary mandate is to maintain price stability, which means either controlling inflation or stimulating growth. Its primary tool is the raising or lowering of interest rates. Relatively high interest rates – or the expectation of higher rates – will usually benefit the Euro and vice versa. The ECB Governing Council makes monetary policy decisions at meetings held eight times a year. Decisions are made by heads of the Eurozone national banks and six permanent members, including the President of the ECB, Christine Lagarde.
Eurozone inflation data, measured by the Harmonized Index of Consumer Prices (HICP), is an important econometric for the Euro. If inflation rises more than expected, especially if above the ECB’s 2% target, it obliges the ECB to raise interest rates to bring it back under control. Relatively high interest rates compared to its counterparts will usually benefit the Euro, as it makes the region more attractive as a place for global investors to park their money.
Data releases gauge the health of the economy and can impact on the Euro. Indicators such as GDP, Manufacturing and Services PMIs, employment, and consumer sentiment surveys can all influence the direction of the single currency. A strong economy is good for the Euro. Not only does it attract more foreign investment but it may encourage the ECB to put up interest rates, which will directly strengthen the Euro. Otherwise, if economic data is weak, the Euro is likely to fall. Economic data for the four largest economies in the euro area (Germany, France, Italy and Spain) are especially significant, as they account for 75% of the Eurozone’s economy.
Another significant data release for the Euro is the Trade Balance. This indicator measures the difference between what a country earns from its exports and what it spends on imports over a given period. If a country produces highly sought after exports then its currency will gain in value purely from the extra demand created from foreign buyers seeking to purchase these goods. Therefore, a positive net Trade Balance strengthens a currency and vice versa for a negative balance.
Gold price is attempting another run higher while defending the $2,600 threshold early Tuesday. In doing so, Gold price replicates the recovery moves seen in Monday’s trading, which eventually fizzled out on a broad US Dollar (USD) comeback in tandem with US Treasury bond yields.
The further upside in Gold price could remain limited as the Greenback stays supported by the US Federal Reserve’s (Fed) hawkish tilt at its December policy meeting. Expectations of higher-for-longer US interest rates continue to underpin the US Treasury bond yields and the USD, rendering negative for the non-interest-bearing Gold price.
The US central bank lowered policy rate by 25 basis points (bps) to 4.25%-4.50% range last week, as widely expected. However, the Fed’s Statement of Economic Projections (SEP), the so-called Dot Plot, predicted two quarter-percentage-point rate reductions by the end of 2025. That is half a percentage point less in policy easing next year than officials anticipated as of September. Rising inflation expectations on the back of US President-elect Donald Trump’s protectionist policies call for higher interest rates.
Additionally, markets prefer to hold the US currency in a Christmas holiday-curtailed week, where trading volumes will likely thin out heading into the New Year festive season. Thin market conditions could exaggerate moves across the financial markets, with investors seeking safety in the Greenback.
Therefore, the Gold price remains a good selling opportunity on recovery attempts going forward, barring the unexpected flaring up of any conflicts in the Middle East or between Russia and Ukraine. Gold traders will remain at the mercy of the market sentiment and the US Dollar dynamics, refraining from placing any fresh directional bets on the bright metal.
Technically, Gold price remains more or less the same from a short-term perspective so long as the 14-day Relative Strength Index (RSI) holds below the 50 level.
Currently, Gold’s price defends the 100-day Simple Moving Average (SMA) of $2,611 while it continues to face sellers at the 21-day SMA of $2,642.
Acceptance above the 21-day SMA is needed to negate the bearish momentum, which will call for a test of the 50-day SMA at $2,668.
Further up, the $2,700 mark will come into play.
If Gold buyers give up, a sustained break below the 100-day SMA resistance-turned-support at $2,611 will put the monthly low of $2,583 to the test.
The next relevant supports are November 15 and 14 lows at $2,555 and $2,537, respectively, could come into play.
Gold has played a key role in human’s history as it has been widely used as a store of value and medium of exchange. Currently, apart from its shine and usage for jewelry, the precious metal is widely seen as a safe-haven asset, meaning that it is considered a good investment during turbulent times. Gold is also widely seen as a hedge against inflation and against depreciating currencies as it doesn’t rely on any specific issuer or government.
Central banks are the biggest Gold holders. In their aim to support their currencies in turbulent times, central banks tend to diversify their reserves and buy Gold to improve the perceived strength of the economy and the currency. High Gold reserves can be a source of trust for a country’s solvency. Central banks added 1,136 tonnes of Gold worth around $70 billion to their reserves in 2022, according to data from the World Gold Council. This is the highest yearly purchase since records began. Central banks from emerging economies such as China, India and Turkey are quickly increasing their Gold reserves.
Gold has an inverse correlation with the US Dollar and US Treasuries, which are both major reserve and safe-haven assets. When the Dollar depreciates, Gold tends to rise, enabling investors and central banks to diversify their assets in turbulent times. Gold is also inversely correlated with risk assets. A rally in the stock market tends to weaken Gold price, while sell-offs in riskier markets tend to favor the precious metal.
The price can move due to a wide range of factors. Geopolitical instability or fears of a deep recession can quickly make Gold price escalate due to its safe-haven status. As a yield-less asset, Gold tends to rise with lower interest rates, while higher cost of money usually weighs down on the yellow metal. Still, most moves depend on how the US Dollar (USD) behaves as the asset is priced in dollars (XAU/USD). A strong Dollar tends to keep the price of Gold controlled, whereas a weaker Dollar is likely to push Gold prices up.
Silver price (XAG/USD) extends its winning streak for the third consecutive session, trading around $29.70 during the Asian hours on Tuesday. Prices of precious metals like Silver are supported probably due to thin trading activity before the Christmas holiday. Additionally, soft US PCE data have tempered inflation concerns, presenting a mixed outlook for the economy, which benefits non-yielding assets like Silver.
However, Silver prices may receive downward pressure as traders continue to assess the Federal Reserve’s (Fed) outlook for 2025, factoring in only two rate cuts in 2025 after Fed policymakers signaled fewer interest rate cuts next year due to a slowdown in the disinflation process.
According to the CME FedWatch tool, markets now anticipate a nearly 93% probability that the Federal Reserve will keep interest rates unchanged in January, maintaining the current range of 4.25%–4.50%.
Potential tariffs from the incoming Trump administration have intensified fears of weak demand for Silver as an industrial input, causing the metal to underperform in the fourth quarter. Additionally, Chicago Fed President Austan Goolsbee stated that uncertainty surrounding Trump’s policies after taking office led him to revise his projection for 2025. While he had previously anticipated a 100-basis-point (bps) interest rate reduction, he now expects fewer cuts.
Additionally, Silver prices are facing pressure from a constrained industrial outlook, driven by overcapacity in China’s solar panel industry. This has led photovoltaic companies to participate in a government-led self-discipline program to regulate supply. Pressure on Silver prices was also noted due to concerns over a potential Yuan devaluation, in line with China’s looser monetary policy stance.
Silver is a precious metal highly traded among investors. It has been historically used as a store of value and a medium of exchange. Although less popular than Gold, traders may turn to Silver to diversify their investment portfolio, for its intrinsic value or as a potential hedge during high-inflation periods. Investors can buy physical Silver, in coins or in bars, or trade it through vehicles such as Exchange Traded Funds, which track its price on international markets.
Silver prices can move due to a wide range of factors. Geopolitical instability or fears of a deep recession can make Silver price escalate due to its safe-haven status, although to a lesser extent than Gold’s. As a yieldless asset, Silver tends to rise with lower interest rates. Its moves also depend on how the US Dollar (USD) behaves as the asset is priced in dollars (XAG/USD). A strong Dollar tends to keep the price of Silver at bay, whereas a weaker Dollar is likely to propel prices up. Other factors such as investment demand, mining supply – Silver is much more abundant than Gold – and recycling rates can also affect prices.
Silver is widely used in industry, particularly in sectors such as electronics or solar energy, as it has one of the highest electric conductivity of all metals – more than Copper and Gold. A surge in demand can increase prices, while a decline tends to lower them. Dynamics in the US, Chinese and Indian economies can also contribute to price swings: for the US and particularly China, their big industrial sectors use Silver in various processes; in India, consumers’ demand for the precious metal for jewellery also plays a key role in setting prices.
Silver prices tend to follow Gold’s moves. When Gold prices rise, Silver typically follows suit, as their status as safe-haven assets is similar. The Gold/Silver ratio, which shows the number of ounces of Silver needed to equal the value of one ounce of Gold, may help to determine the relative valuation between both metals. Some investors may consider a high ratio as an indicator that Silver is undervalued, or Gold is overvalued. On the contrary, a low ratio might suggest that Gold is undervalued relative to Silver.
Coffee price world single maintain stability
Robusta coffee prices on the London floor, updated at 15:30 p.m. on December 22, 2024, remained stable compared to yesterday, fluctuating between 4849 and 5011 USD/ton. Specifically, the monthly delivery term January 2025 is 5011 USD/ton; the monthly delivery term March 2025 is 5002 USD/ton; the monthly delivery term May 2025 is 4934 USD/ton and the monthly delivery term July 2025 is 4849 USD/ton.
| People in Pleiku City, Gia Lai Province harvest organic coffee. Photo: Hien Mai |
Similarly, the price of Arabica coffee on the New York floor also remained stable at 302.75 – 325.00 cents/lb. Specifically, the monthly delivery term March 2025 is 325.00 cents/lb; the monthly delivery term May 2025 is 319.30 cents/lb; the monthly delivery term July 2025 is 311.65 cents/lb and the monthly delivery term September 2025 is 302.75 cents/lb.
Brazilian Arabica coffee prices were updated at 15:30 on December 22, 2024 as follows: Monthly delivery term December 2024 is not traded; monthly delivery term March 2025 is 406.45 USD/ton; monthly delivery term May 2025 is 398.10 USD/ton; monthly delivery term July 2025 is 387.85 USD/ton.
Domestic coffee prices stagnate
According to information from Giacaphe.com, updated coffee prices at 15:30 p.m. today December 22, 2024, the average domestic coffee price is at 121.100 VND/kg.
The highest coffee purchase price in key regions of the Central Highlands is still recorded at 121.300 VND/kg. Specifically, today’s coffee price at Dak Lak at 121.000 VND/kg, coffee price at Lam Dong has a price of 120.500 VND/kg. Meanwhile, the price of coffee at Gia Lai Today the price is 121.000 VND/kg. Coffee price at Dak Nong Today price is 121.300 VND/kg.
 |
| Coffee garden laden with fruit in Lien Hiep commune, Duc Trong district, Lam Dong province. Photo: Le Son |
The domestic coffee prices that Giacaphe.com lists every day are calculated based on the prices of two world coffee exchanges combined with continuous surveys from businesses and purchasing agents in key coffee growing areas across the country.
Y5Cafe always tries to stay as close as possible to each region, however there will be days when the listed price does not completely match the local coffee purchase price, but Y5Cafe believes that the listed information is a valuable reference source for farmers and coffee purchasing businesses.
Coffee price prediction tomorrow December 23, 2024
Domestic coffee prices on December 22, 2024 fluctuated from 120.500 – 121.300 VND/kg, down 3.000 – 4.000 VND/kg compared to last week. In the world market, robusta coffee prices continued to decrease, while arabica tended to increase slightly.
Weather forecasts in major coffee growing regions such as the Central Highlands (Vietnam) and Minas Gerais, São Paulo (Brazil) show heavy rains, which could affect coffee harvest and quality.
In addition, the strong increase in domestic coffee consumption, forecast to reach 270.000 – 300.000 tons, combined with low production output, may affect export supply. However, according to forecasts, coffee prices may increase again in the near future.
Combining the above factors, it is forecasted that coffee prices on December 23, 2024 may increase slightly, but will still be affected by market fluctuations and weather conditions.
Sources: https://congthuong.vn/du-bao-gia-ca-phe-ngay-mai-23122024-gia-ca-phe-phuc-hoi-365606.html
Gold price (XAU/USD) trades flat around $2,610 during the early Asian session on Tuesday. Markets face a relatively quiet trading session ahead of the holiday trading week. The US Richmond Fed Manufacturing Index for December is due later on Tuesday.
The firmer US Dollar (USD) could weigh on the yellow metal as it makes commodities priced in the currency more expensive for most buyers. Meanwhile, the US Dollar Index (DXY), a measure of the USD’s value relative to its most significant trading partners’ currencies, edges higher to the 108.00 handle amid the cautious mood.
“The market continues to digest the results of the Federal Open Market Committee (FOMC) meeting last week. A shallower rate path for 2025 is now getting factored in, probably a pause in January, maybe March as well,” noted Peter Grant, vice president and senior metals strategist at Zaner Metals.
On the other hand, safe-haven demand and buying by the world’s central banks could underpin the precious metal. According to the World Gold Council (WGC), central bank demand increased significantly, highlighting the metal’s continued position as a safe-haven asset. Central banks have been net purchasers of gold for over 15 years.
Gold has played a key role in human’s history as it has been widely used as a store of value and medium of exchange. Currently, apart from its shine and usage for jewelry, the precious metal is widely seen as a safe-haven asset, meaning that it is considered a good investment during turbulent times. Gold is also widely seen as a hedge against inflation and against depreciating currencies as it doesn’t rely on any specific issuer or government.
Central banks are the biggest Gold holders. In their aim to support their currencies in turbulent times, central banks tend to diversify their reserves and buy Gold to improve the perceived strength of the economy and the currency. High Gold reserves can be a source of trust for a country’s solvency. Central banks added 1,136 tonnes of Gold worth around $70 billion to their reserves in 2022, according to data from the World Gold Council. This is the highest yearly purchase since records began. Central banks from emerging economies such as China, India and Turkey are quickly increasing their Gold reserves.
Gold has an inverse correlation with the US Dollar and US Treasuries, which are both major reserve and safe-haven assets. When the Dollar depreciates, Gold tends to rise, enabling investors and central banks to diversify their assets in turbulent times. Gold is also inversely correlated with risk assets. A rally in the stock market tends to weaken Gold price, while sell-offs in riskier markets tend to favor the precious metal.
The price can move due to a wide range of factors. Geopolitical instability or fears of a deep recession can quickly make Gold price escalate due to its safe-haven status. As a yield-less asset, Gold tends to rise with lower interest rates, while higher cost of money usually weighs down on the yellow metal. Still, most moves depend on how the US Dollar (USD) behaves as the asset is priced in dollars (XAU/USD). A strong Dollar tends to keep the price of Gold controlled, whereas a weaker Dollar is likely to push Gold prices up.
Note that for the most part trading today in natural gas has stayed above prior resistance at 3.64. That was the 2023 high and top of a large symmetrical triangle pattern. Therefore, it potentially was an impactful breakout that should eventually see a continuation to the upside. However, in the short term the possibility of a pullback exists and improves on a daily close below 3.64. The target zone that was breached today consisted of the 38.2% Fibonacci retracement at 3.85 and the 127.2% extended target for a rising ABCD pattern (orange) at 3.87.
It is not just the bearish reaction to the target zone, however that is a cause for concern, resistance was also seen around the top channel line of a rising trend channel. Notice that on Friday natural gas touched the line specifically as resistance as the high of the day at 3.83 was at the line. Arguably, the top channel line could be moved a little higher and touch the November swing high rather than the October swing high. In that case, the argument for short-term resistance is amplified.
A correction, if it were to occur, could take the form of relatively sideways consolidation or a deeper pullback. The rise above the top of the channel is an indication that prices may be getting too far from the mean and due for a pullback and realignment. Other price levels to watch besides the 3.64 high include the most recent trend high at 3.56 and the 20-Day MA trend indicator at 3.32. If a rally above today’s high occurs before a correction, then the next upside target is 4.06.
For a look at all of today’s economic events, check out our economic calendar.
After suffering large losses on Wednesday and Thursday, GBP/USD corrected higher on Friday but ended up closing the week in the red. The pair stays in a consolidation phase below 1.2600 early Monday as trading conditions remain thin ahead of the Christmas holiday.
The table below shows the percentage change of British Pound (GBP) against listed major currencies last 7 days. British Pound was the weakest against the US Dollar.
| USD | EUR | GBP | JPY | CAD | AUD | NZD | CHF | |
|---|---|---|---|---|---|---|---|---|
| USD | 0.82% | 0.39% | 1.85% | 1.04% | 1.66% | 1.98% | 0.17% | |
| EUR | -0.82% | -0.37% | 1.16% | 0.29% | 1.01% | 1.23% | -0.59% | |
| GBP | -0.39% | 0.37% | 1.40% | 0.69% | 1.38% | 1.58% | -0.22% | |
| JPY | -1.85% | -1.16% | -1.40% | -0.81% | -0.18% | 0.14% | -1.57% | |
| CAD | -1.04% | -0.29% | -0.69% | 0.81% | 0.67% | 0.91% | -0.87% | |
| AUD | -1.66% | -1.01% | -1.38% | 0.18% | -0.67% | 0.22% | -1.58% | |
| NZD | -1.98% | -1.23% | -1.58% | -0.14% | -0.91% | -0.22% | -1.79% | |
| CHF | -0.17% | 0.59% | 0.22% | 1.57% | 0.87% | 1.58% | 1.79% |
The heat map shows percentage changes of major currencies against each other. The base currency is picked from the left column, while the quote currency is picked from the top row. For example, if you pick the British Pound from the left column and move along the horizontal line to the US Dollar, the percentage change displayed in the box will represent GBP (base)/USD (quote).
The Federal Reserve’s (Fed) hawkish dot plot and the Bank of England relatively dovish language following the last policy meeting of the year triggered a sharp decline in GBP/USD. The positive shift seen in risk mood heading into weekend on US Congress’ avoidance of a government shutdown caused the US Dollar (USD) to weaken against its rivals and helped the pair erase a portion of its weekly losses.
Meanwhile, the softer-than-expected November inflation data put additional weight on the USD’s shoulders. The US Bureau of Economic Analysis reported that the core Personal Consumption Expenditures (PCE) Price Index, the Federal Reserve’s (Fed) preferred gauge of inflation, rose 0.1% on a monthly basis in November. This reading followed the 0.3% increase recorded in October and came in below the market expectation of 0.2%.
In the absence of high-tier data releases, investors could react to changes in risk perception in the second half of the day. At the time of press, US stock index futures were up between 0.1% and 0.5%. A bullish opening in Wall Street could make it difficult for the USD to stay resilient against its rivals and support GBP/USD.
The Relative Strength Index (RSI) indicator on the 4-hour chart stays below 50 and GBP/USD is yet to make a 4-hour close above the 20-period Simple Moving Average (SMA), reflecting buyers’ hesitancy.
On the downside, interim support is located at 1.2550 (static level) before 1.2480 (static level) and 1.2400 (static level, round level). Looking north, resistances could be seen at 1.2600 (static level, round level), 1.2640 (50-period SMA) and 1.2680 (100-period SMA).
The Pound Sterling (GBP) is the oldest currency in the world (886 AD) and the official currency of the United Kingdom. It is the fourth most traded unit for foreign exchange (FX) in the world, accounting for 12% of all transactions, averaging $630 billion a day, according to 2022 data. Its key trading pairs are GBP/USD, also known as ‘Cable’, which accounts for 11% of FX, GBP/JPY, or the ‘Dragon’ as it is known by traders (3%), and EUR/GBP (2%). The Pound Sterling is issued by the Bank of England (BoE).
The single most important factor influencing the value of the Pound Sterling is monetary policy decided by the Bank of England. The BoE bases its decisions on whether it has achieved its primary goal of “price stability” – a steady inflation rate of around 2%. Its primary tool for achieving this is the adjustment of interest rates. When inflation is too high, the BoE will try to rein it in by raising interest rates, making it more expensive for people and businesses to access credit. This is generally positive for GBP, as higher interest rates make the UK a more attractive place for global investors to park their money. When inflation falls too low it is a sign economic growth is slowing. In this scenario, the BoE will consider lowering interest rates to cheapen credit so businesses will borrow more to invest in growth-generating projects.
Data releases gauge the health of the economy and can impact the value of the Pound Sterling. Indicators such as GDP, Manufacturing and Services PMIs, and employment can all influence the direction of the GBP. A strong economy is good for Sterling. Not only does it attract more foreign investment but it may encourage the BoE to put up interest rates, which will directly strengthen GBP. Otherwise, if economic data is weak, the Pound Sterling is likely to fall.
Another significant data release for the Pound Sterling is the Trade Balance. This indicator measures the difference between what a country earns from its exports and what it spends on imports over a given period. If a country produces highly sought-after exports, its currency will benefit purely from the extra demand created from foreign buyers seeking to purchase these goods. Therefore, a positive net Trade Balance strengthens a currency and vice versa for a negative balance.
Diễn biến thị trường cà phê world
Tuần qua, trên thị trường thế giới, giá cà phê Robusta và Arabica có đã trải qua những biến động đáng kể. Giá cà phê Robusta kỳ hạn giao tháng January 2025 trên sàn London giảm 98 USD/tấn, trong khi giá cà phê Arabica kỳ hạn giao tháng March 2025 trên sàn New York tăng 5,5 cent/lb.
| Người dân Gia Lai phơi cà phê nhân trước khi xuất bán. Ảnh: Hiền Mai |
Nguyên nhân chính dẫn đến sự biến động này là do ảnh hưởng của việc Cục Dự trữ Liên bang Mỹ (Fed) hạ lãi suất, tác động đến tỷ giá hối đoái và thị trường hàng hóa. Đồng USD tăng giảm liên tục, cùng với việc đồng Real của Brazil suy yếu, khuyến khích các nhà sản xuất tại Brazil đẩy mạnh xuất khẩu, làm tăng nguồn cung trên thị trường.
Thị trường cà phê trong nước tiếp tục giảm nhẹ
Tại Việt Nam, mưa nhiều tại khu vực Tây Nguyên thời gian qua đã ảnh hưởng đến tiến độ thu hoạch cà phê, gây lo ngại về sản lượng và chất lượng. Hiện tại, vụ thu hoạch cà phê đã hoàn thành được khoảng 40-50%. Dự báo sản lượng cà phê của Việt Nam trong niên vụ này có thể đạt khoảng 1,6 triệu tấn, trong khi tiêu thụ nội địa dự kiến từ 270.000 đến 300.000 tấn.
 |
| Cà phê luôn đảm bảo chất lượng khi người dân thu hoạch 100% cà phê chín. Ảnh: Hiền Mai |
Theo thông tin từ Giacaphe.com, cập nhật giá cà phê lúc 15 giờ 30 phút hôm nay ngày December 23, 2024, giá cà phê trong nước trung bình ở mức 120.600 đồng/kg, giảm -500 đồng/kg so với ngày hôm qua.
The highest coffee purchase price in key regions of the Central Highlands was recorded at 121.000 VND/kg. Specifically, today’s coffee price at Dak Lak is 120.500 VND/kg, down -500 VND/kg compared to yesterday. Coffee price at Lam Dong has a price of 120.000 VND/kg, down -500 VND/kg. Meanwhile, coffee prices at Gia Lai hôm nay có mức giá 120.300 đồng/kg, giảm -700 đồng/kg và giá cà phê tại Dak Nong Today’s price is 121.000 VND/kg, also down -300 VND/kg compared to yesterday.
The domestic coffee prices that Giacaphe.com lists every day are calculated based on the prices of two world coffee exchanges combined with continuous surveys from businesses and purchasing agents in key coffee growing areas across the country.
Y5Cafe always tries to stay as close as possible to each region, however there will be days when the listed price does not completely match the local coffee purchase price, but Y5Cafe believes that the listed information is a valuable reference source for farmers and coffee purchasing businesses.
Nhận định giá cà phê ngày mai 24/ 12 / 2024
Trong tuần qua, giá cà phê trong nước cũng đã trải qua biến động khôngnhỏ, với mức giảm từ 3.000 – 4.000 đồng/kg. Hiện tại, giá cà phê dao động trong khoảng 120.500 – 121.000 đồng/kg.
Theo thống kê từ Hiệp hội cà phê ca cao Việt Nam (VICOFA), trong nửa đầu tháng December 2024, các doanh nghiệp xuất khẩu được 48.371 tấn cà phê, kim ngạch xuất khẩu gần 264 triệu USD, giảm 51,5% về lượng và giảm 6,5% về giá trị so với cùng kỳ năm ngoái. Lũy kế đến December 15, 2024, Việt Nam xuất khẩu trên 1,26 triệu tấn cà phê, kim ngạch xuất khẩu gần 5,2 tỷ USD, giảm 16,5% về lượng nhưng tăng 32,4% về giá trị so với cùng kỳ năm ngoái.
Với những yếu tố trên, giới chuyên gia dự báo giá cà phê trong nước ngày December 24, 2024 sẽ duy trì ổn định trong khoảng 120.500 – 121.500 đồng/kg, chưa có dấu hiệu tăng hoặc giảm đột biến. Tuy nhiên, thị trường cà phê luôn chịu ảnh hưởng từ nhiều yếu tố kinh tế và thời tiết, do đó, người trồng và kinh doanh cà phê nên theo dõi sát sao các diễn biến để có những quyết định kịp thời và phù hợp.
Sources: https://congthuong.vn/du-bao-gia-ca-phe-ngay-mai-24122024-gia-ca-phe-co-xu-huong-on-dinh-sau-dot-giam-365773.html