The main category of Forex News.
You can use the search box below to find what you need.
[wd_asp id=1]
The main category of Forex News.
You can use the search box below to find what you need.
[wd_asp id=1]
According to recent stock market trading and stock trading company platforms, European stocks have recently suffered a severe setback. Also, the sharp decline in shares of Novo Nordisk A/S by $93 billion weakened investor sentiment. In addition to Novo, shares of Nestle SA and LVMH Moët Hennessy Louis Vuitton SE were also affected. Furthermore, losses in the shares of these European companies pushed the Stoxx Europe 600 index towards its worst performance compared to the S&P 500 index in nearly a quarter of a century.
In this regard, a member of the European Central Bank’s policy confirmed that it will continue to reduce borrowing costs in 2025. Croatian central bank chief Boris Vujcic added that “the trend is clear, it is a continuation of the trend from 2024, which is to reduce interest rates further.” For its part, the European Central Bank last week cut its deposit rate by a quarter of a percentage point to 3%, the fourth such move since last June. Officials indicated that more steps would follow, although they differed on how many steps would be necessary. the official added, “I don’t even know at what point” the ECB will cut interest rates”. Also, “That will be determined by the data, especially the inflation rate, whether it slows down, according to our expectations, and we will see the impact of the transmission of monetary policy, our expectations.”
However, HSBC expects the ECB to be more aggressive; “We believe there is an increasing risk that the ECB will cut rates below the perceived neutral rate to stimulate the economy, and possibly even to 1.00%. Among the uncertainties weighing on the outlook is the threat of US tariffs after Trump takes office. In this regard, the official said: “If a trade war erupts, it will be bad for growth in Europe and the rest of the world,” adding that trade wars usually lead to higher prices. “We hope we don’t see a trade war, and it won’t be good for anyone.”

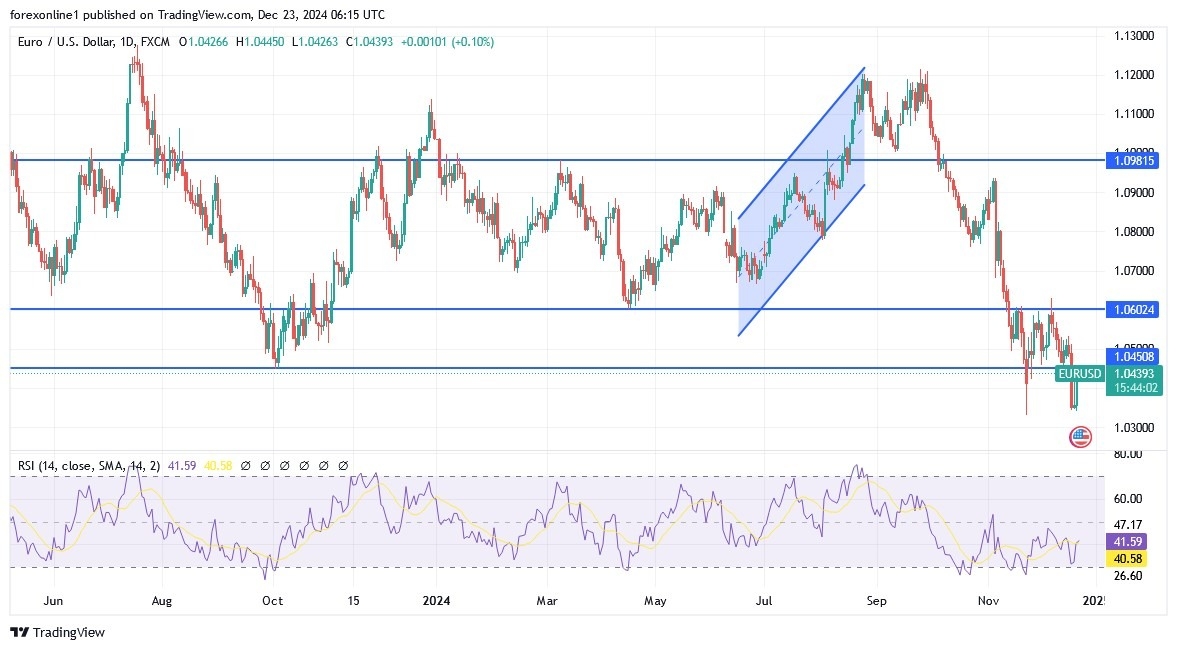
Keep in mind that the Euro Dollar’s path will remain bearish and stability below the 1.05 support confirms the strength of bear control. The current trading week includes Christmas holidays, which affects liquidity and investors’ desire to trade.
According to the performance on the daily chart above, the general trend of the Euro against the US Dollar EUR/USD is still bearish and Forex investors will not care about the technical indicators reaching strong oversold levels as much as they care about monitoring the negative impact factors on the Euro’s performance, led by the economic and political turmoil of the bloc’s largest economies and the future of the European Central Bank’s policies and the future of trade wars on the region’s economy, which is already suffering. The Euro Dollar’s gains will remain vulnerable to a rapid collapse, so caution is required. The relative strength indicators and the MACD indicator are still in oversold areas. The future of the Euro Dollar parity price is close and the closest support levels are currently 1.0380, 1.0300 and 1.0225, respectively.
On the other hand, and in the same time frame, there will be no first break of the Euro-Dollar downtrend without the bulls moving towards the resistance levels of 1.0665 and 1.0800 respectively. I still prefer to sell the Euro-Dollar.
Ready to trade our daily EUR/USD Forex analysis? We’ve made this forex brokers list for you to check out.
Spot Gold trades with a soft tone on Monday, although it’s holding above $2,600 a troy ounce. The bright metal peaked early in Asia at $2,633.14 amid the broad US Dollar’s weakness, later easing on a souring mood backing demand for the American currency. Action, however, remains limited as investors gear up for the winter holidays. Most major markets will be closed in the upcoming days amid the Christmas celebration.
The poor performance of Wall Street is adding to the US Dollar’s strength. Following some solid advances on Friday, the three major United States (US) indexes trade with a soft tone, with only the Nasdaq Composite posting a modest advance. An uptick in government bond yields further supports the Greenback. The 10-year Treasury note currently yields 4.56%, up roughly 4 basis points (bps).
Meanwhile, the US anticipated some macroeconomic releases scheduled for Tuesday as President Joe Biden issued an executive order closing the federal government on December 24. Durable Goods Orders fell 1.1% in November, worse than the 0.4% decline expected. Additionally, CB Consumer Confidence edged sharply lower in December, falling to 104.7 from 112.8 in November and missing the expected 112.9.
From a technical point of view, XAU/USD could extend its slide in the upcoming sessions. The daily chart shows that it is pressuring its low and a bullish 100 Simple Moving Average (SMA), trading around the latter for the first time since last February. The 20 SMA, in the meantime, have lost its directional strength above the current level, suggesting selling pressure remains. Finally, technical indicators head south within negative levels, although without a strong momentum. The pair may extend its slump should the near-term slide extend below $2,600.
The 4-hour chart shows XAU/USD has fallen below the 100 and 200 SMAs while it is currently battling around a bearish 20 SMA. At the same time, technical indicators are piercing their midlines with firmly downward slopes, albeit still near neutral levels.
Support levels: 2,604.20 2,591.70 2,582.90
Resistance levels: 2,617.55 2,632.00 2,645.20
According to recent forex market trading, several pressure factors have formed on the sterling, as the hawkish statement by the US Federal Reserve helped reduce market expectations of the Bank of England cutting interest rates in February 2025 to less than 50%, but this was reflected after the Bank of England’s statement. For its part, the Monetary Policy Committee of the Bank of England kept interest rates at 4.75%, which is in line with analysts’ expectations.
However, there was a surprise in the vote, with the vote split 6-3 compared to the 8-1 expected. Dhingra, Ramsden and Taylor voted for a further 25bps cut. The majority cited significant uncertainty over the outlook for inflation and supply-side issues, particularly following the National Insurance increases. In this context, they wanted more time to assess developments and continued to support a gradual easing of policy. At the same time, there was no change in official guidance, with comments that “a gradual approach to unwinding monetary policy remains appropriate”.
According to BoE Governor Bailey, “With the increasing uncertainty in the economy, we cannot commit to a date or amount of rate cuts in 2025”.
Overall, the minority considered that policy was too restrictive and that a cut was warranted, especially with domestic and international growth risks tilted to the downside. They also considered that current policy would push inflation well below the 2% target. The BoE also noted that growth had been slightly weaker than expected and that there were risks from potential US tariffs.
The division in the voting in the last meeting of the Bank of England strengthened expectations of interest rate cuts in February, especially since one of the six members who voted in favour of fixed interest rates (possibly Bailey) seemed close to supporting the cut this time. Also, Traders moved to price in three interest rate cuts in 2025 from two previously, while bond yields fell. At the same time, the US Federal Reserve cut US interest rates by 25 basis points to 4.50%, which is in line with expectations.
However, there was a shift in interest rate expectations by committee members, with the median expectation being that there would be only two interest rate cuts for 2025 compared to four cuts in the previous update from September. Also, US Federal Reserve Chairman Powell indicated that a slower pace of interest rate cuts is justified given slightly stronger growth and some disappointing inflation data.
Overall, the stronger dollar is likely to continue to hinder the GBP/USD currency pair from making gains.
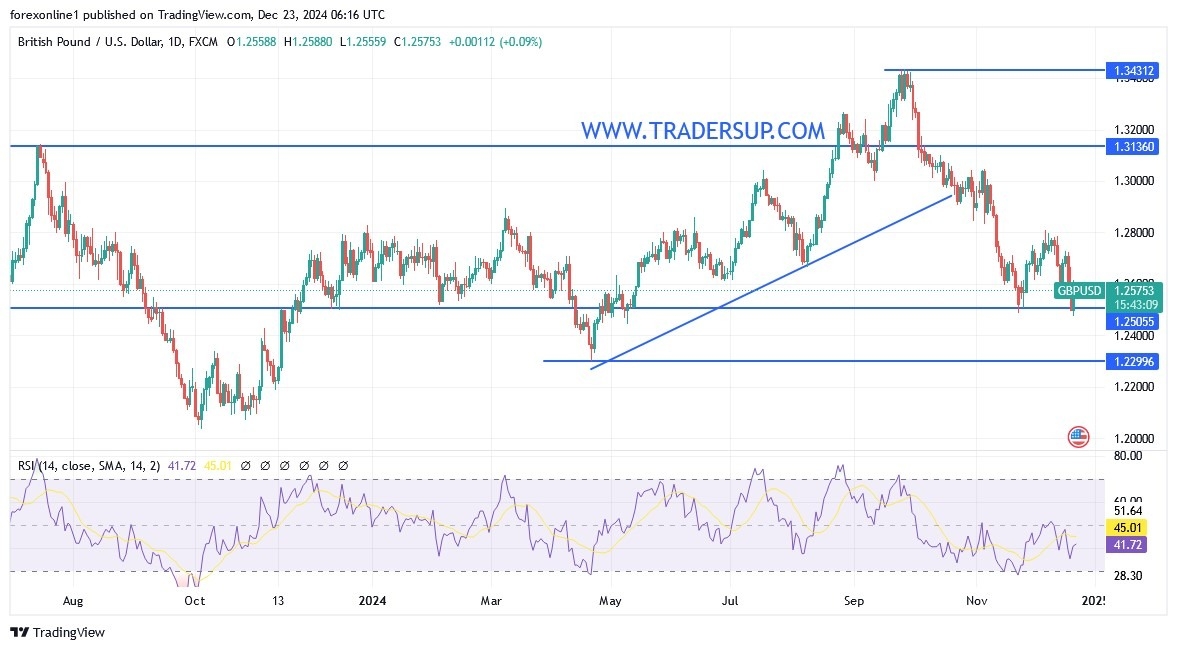
Any attempts to rebound the GBP/USD price break is an important support level. We have often noted that the pressures will intensify after it, which is the 1.25 level. Selling pressures will remain as long as the currency pair is stable below it.
As we previously predicted, the movement of the GBP/USD pair below the support level of 1.2500 will increase the dominance of the bears and confirm the strength of the downward trend. The Relative Strength Index has the opportunity to move down before reaching oversold levels. as well as the MACD, which confirms that the bears are ready for further downward movement, and the next important support levels may be 1.2475, 1.2330, and 1.2300, respectively. Conversely, and on the same time frame, the daily chart will not have a primary break of the downward trend without moving above the resistance of 1.2800 again.
Furthermore, it should be taken into account that this week includes Christmas holidays and liquidity often decreases during these holidays and investor interest in trading decreases, so movements may be calm and unstable.
Ready to trade our daily GBP/USD Forex forecast? Here’s some of the best forex broker UK reviews to check out.
Silver price (XAG/USD) extends Friday’s recovery move to near $29.90 in Monday’s European session. The white metal rebounded strongly on Friday from a more than three-month low of $28.75 after the release of the United States (US) Personal Consumption Expenditure Price Index (PCE) data for November, which showed that price pressures grew at a slower pace than expectations.
Core PCE inflation, the Federal Reserve’s (Fed) preferred inflation gauge, rose steadily by 2.8% but slower than estimates of 2.9%. The month-on-month headline and core PCE inflation grew marginally by 0.1%, raising uncertainty over whether the Fed will follow a shallow rate-cut path in 2025, as projected in the Fed’s dot plot from the December policy meeting.
The recent Fed dot plot showed that officials collectively see Federal Fund rates heading to 3.9% by the end of 2025.
Silver prices advanced on Monday even though US Treasury yields remain higher as Federal Reserve (Fed) policymakers support fewer interest rate cuts next year. 10-year US Treasury yields moved higher to near 4.54%. Generally, higher yields on interest-bearing assets weigh on non-yielding assets, such as Silver, as they result in higher opportunity costs for them. The US Dollar Index (DXY), which tracks the Greenback’s value against six major currencies, ticked higher to near 108.00.
On Friday, a string of Fed officials backed a shallow policy-easing approach amid a slowdown in the disinflation trend, better labor market conditions than previously anticipated, and uncertainty over President-elect Donald Trump’s incoming policies.
Silver price recovers to test the breakdown of the upward-sloping trendline near $30.00, which is plotted from the February 29 low of $22.30 on a daily timeframe. The white metal wobbles around the 200-day Exponential Moving Average (EMA), suggesting that the longer-term outlook is uncertain.
The 14-day Relative Strength Index (RSI) rebounds to near 40.00. A fresh bearish momentum would trigger if it fails to break above that level.
Looking down, the September low of $27.75 would act as key support for the Silver price. On the upside, the 50-day EMA around $30.90 would be the barrier.
Silver is a precious metal highly traded among investors. It has been historically used as a store of value and a medium of exchange. Although less popular than Gold, traders may turn to Silver to diversify their investment portfolio, for its intrinsic value or as a potential hedge during high-inflation periods. Investors can buy physical Silver, in coins or in bars, or trade it through vehicles such as Exchange Traded Funds, which track its price on international markets.
Silver prices can move due to a wide range of factors. Geopolitical instability or fears of a deep recession can make Silver price escalate due to its safe-haven status, although to a lesser extent than Gold’s. As a yieldless asset, Silver tends to rise with lower interest rates. Its moves also depend on how the US Dollar (USD) behaves as the asset is priced in dollars (XAG/USD). A strong Dollar tends to keep the price of Silver at bay, whereas a weaker Dollar is likely to propel prices up. Other factors such as investment demand, mining supply – Silver is much more abundant than Gold – and recycling rates can also affect prices.
Silver is widely used in industry, particularly in sectors such as electronics or solar energy, as it has one of the highest electric conductivity of all metals – more than Copper and Gold. A surge in demand can increase prices, while a decline tends to lower them. Dynamics in the US, Chinese and Indian economies can also contribute to price swings: for the US and particularly China, their big industrial sectors use Silver in various processes; in India, consumers’ demand for the precious metal for jewellery also plays a key role in setting prices.
Silver prices tend to follow Gold’s moves. When Gold prices rise, Silver typically follows suit, as their status as safe-haven assets is similar. The Gold/Silver ratio, which shows the number of ounces of Silver needed to equal the value of one ounce of Gold, may help to determine the relative valuation between both metals. Some investors may consider a high ratio as an indicator that Silver is undervalued, or Gold is overvalued. On the contrary, a low ratio might suggest that Gold is undervalued relative to Silver.
Following the sharp decline seen after the Federal Reserve’s policy announcements midweek, EUR/USD staged a rebound and closed in positive territory on Friday. The pair struggles to preserve its recovery momentum early Monday but manages to hold slightly above 1.0400.
The table below shows the percentage change of Euro (EUR) against listed major currencies last 7 days. Euro was the weakest against the US Dollar.
| USD | EUR | GBP | JPY | CAD | AUD | NZD | CHF | |
|---|---|---|---|---|---|---|---|---|
| USD | 0.84% | 0.47% | 1.99% | 1.06% | 1.71% | 2.00% | 0.17% | |
| EUR | -0.84% | -0.32% | 1.26% | 0.28% | 1.03% | 1.23% | -0.61% | |
| GBP | -0.47% | 0.32% | 1.44% | 0.60% | 1.35% | 1.53% | -0.29% | |
| JPY | -1.99% | -1.26% | -1.44% | -0.93% | -0.27% | 0.04% | -1.70% | |
| CAD | -1.06% | -0.28% | -0.60% | 0.93% | 0.70% | 0.92% | -0.89% | |
| AUD | -1.71% | -1.03% | -1.35% | 0.27% | -0.70% | 0.19% | -1.62% | |
| NZD | -2.00% | -1.23% | -1.53% | -0.04% | -0.92% | -0.19% | -1.81% | |
| CHF | -0.17% | 0.61% | 0.29% | 1.70% | 0.89% | 1.62% | 1.81% |
The heat map shows percentage changes of major currencies against each other. The base currency is picked from the left column, while the quote currency is picked from the top row. For example, if you pick the Euro from the left column and move along the horizontal line to the US Dollar, the percentage change displayed in the box will represent EUR (base)/USD (quote).
The improving risk sentiment and the softer-than-forecast inflation data from the US made it difficult for the US Dollar (USD) to find demand on Friday. Congress’ approval of a stopgap spending bill late Friday triggered a rally in Wall Street’s main indexes and dragged US Treasury bond yields lower.
The core Personal Consumption Expenditures (PCE) Price Index, the Federal Reserve’s (Fed) preferred gauge of inflation, rose 0.1% on a monthly basis in November, the US Bureau of Economic Analysis reported on Friday. This reading followed the 0.3% increase recorded in October and came in below the market expectation of 0.2%.
In an interview with the Financial Times (FT) on Monday, European Central Bank (ECB) President Christine Lagarde repeated that they are getting very close to the stage when they can declare that they have sustainably brought inflation to the medium-term target of 2%.
The Conference Board’s Consumer Confidence Index for December will be featured in the US economic calendar on Monday. Meanwhile, US stock index futures were last seen rising between 0.3% and 0.7% on the day. In case risk flows continue to dominate the action in the second half of the day, the USD could have a hard time gathering strength and allow EUR/USD to hold its ground. Nevertheless, thin trading conditions ahead of the Christmas holiday could limit the pair’s volatility.
The Relative Strength Index (RSI) indicator on the 4-hour chart stays slightly below 50, highlighting a lack of bullish momentum.
On the upside, immediate resistance is located at 1.0440 (static level) before 1.0490-1.0500, (100-period Simple Moving Average (SMA), static level). Looking south, supports could be spotted at 1.0400 (static level, round level), 1.0350 (static level) and 1.0300 (static level, round level).
The Euro is the currency for the 19 European Union countries that belong to the Eurozone. It is the second most heavily traded currency in the world behind the US Dollar. In 2022, it accounted for 31% of all foreign exchange transactions, with an average daily turnover of over $2.2 trillion a day. EUR/USD is the most heavily traded currency pair in the world, accounting for an estimated 30% off all transactions, followed by EUR/JPY (4%), EUR/GBP (3%) and EUR/AUD (2%).
The European Central Bank (ECB) in Frankfurt, Germany, is the reserve bank for the Eurozone. The ECB sets interest rates and manages monetary policy. The ECB’s primary mandate is to maintain price stability, which means either controlling inflation or stimulating growth. Its primary tool is the raising or lowering of interest rates. Relatively high interest rates – or the expectation of higher rates – will usually benefit the Euro and vice versa. The ECB Governing Council makes monetary policy decisions at meetings held eight times a year. Decisions are made by heads of the Eurozone national banks and six permanent members, including the President of the ECB, Christine Lagarde.
Eurozone inflation data, measured by the Harmonized Index of Consumer Prices (HICP), is an important econometric for the Euro. If inflation rises more than expected, especially if above the ECB’s 2% target, it obliges the ECB to raise interest rates to bring it back under control. Relatively high interest rates compared to its counterparts will usually benefit the Euro, as it makes the region more attractive as a place for global investors to park their money.
Data releases gauge the health of the economy and can impact on the Euro. Indicators such as GDP, Manufacturing and Services PMIs, employment, and consumer sentiment surveys can all influence the direction of the single currency. A strong economy is good for the Euro. Not only does it attract more foreign investment but it may encourage the ECB to put up interest rates, which will directly strengthen the Euro. Otherwise, if economic data is weak, the Euro is likely to fall. Economic data for the four largest economies in the euro area (Germany, France, Italy and Spain) are especially significant, as they account for 75% of the Eurozone’s economy.
Another significant data release for the Euro is the Trade Balance. This indicator measures the difference between what a country earns from its exports and what it spends on imports over a given period. If a country produces highly sought after exports then its currency will gain in value purely from the extra demand created from foreign buyers seeking to purchase these goods. Therefore, a positive net Trade Balance strengthens a currency and vice versa for a negative balance.
Gold price (XAU/USD) holds steady near $2,625 during the early Asian session on Monday. The hawkish stance of the Federal Reserve (Fed) might weigh on the yellow metal. However, the softer Greenback after the weaker inflation report could cap its downside.
The Fed lowered interest rates in the December meeting as expected but signaled that it will slow the pace at which borrowing costs fall any further. The Fed’s dot plot, a chart that projects the future path of interest rates, indicated a half-percentage point rate cut in 2025, compared with a full percentage cut projected in September. This, in turn, continues to lift the US Dollar (USD) and undermine the USD-denominated Gold as higher real interest rates increase the opportunity cost of gold.
On the other hand, softer-than-expected US inflation data could help limit the precious metal’s losses. The US inflation, as measured by the Personal Consumption Expenditures (PCE) Price Index, rose to 2.4% YoY in November from 2.3% in October. The reading came in below the market consensus of 2.5%. Meanwhile, the Core PCE jumped 2.8% in November, compared to 2.8% In the previous reading, but below the 2.9% expected.
The upturn in Gold demand in China might contribute to the yellow metal’s upside as China is the world’s largest Gold consumer nation. With less than 6 weeks until Chinese New Year, the world’s heaviest gold-buying festival overtakes Diwali in India. Additionally, the ongoing geopolitical tensions in the Middle East could boost the safe-haven flows, benefiting the Gold price.
Gold has played a key role in human’s history as it has been widely used as a store of value and medium of exchange. Currently, apart from its shine and usage for jewelry, the precious metal is widely seen as a safe-haven asset, meaning that it is considered a good investment during turbulent times. Gold is also widely seen as a hedge against inflation and against depreciating currencies as it doesn’t rely on any specific issuer or government.
Central banks are the biggest Gold holders. In their aim to support their currencies in turbulent times, central banks tend to diversify their reserves and buy Gold to improve the perceived strength of the economy and the currency. High Gold reserves can be a source of trust for a country’s solvency. Central banks added 1,136 tonnes of Gold worth around $70 billion to their reserves in 2022, according to data from the World Gold Council. This is the highest yearly purchase since records began. Central banks from emerging economies such as China, India and Turkey are quickly increasing their Gold reserves.
Gold has an inverse correlation with the US Dollar and US Treasuries, which are both major reserve and safe-haven assets. When the Dollar depreciates, Gold tends to rise, enabling investors and central banks to diversify their assets in turbulent times. Gold is also inversely correlated with risk assets. A rally in the stock market tends to weaken Gold price, while sell-offs in riskier markets tend to favor the precious metal.
The price can move due to a wide range of factors. Geopolitical instability or fears of a deep recession can quickly make Gold price escalate due to its safe-haven status. As a yield-less asset, Gold tends to rise with lower interest rates, while higher cost of money usually weighs down on the yellow metal. Still, most moves depend on how the US Dollar (USD) behaves as the asset is priced in dollars (XAU/USD). A strong Dollar tends to keep the price of Gold controlled, whereas a weaker Dollar is likely to push Gold prices up.
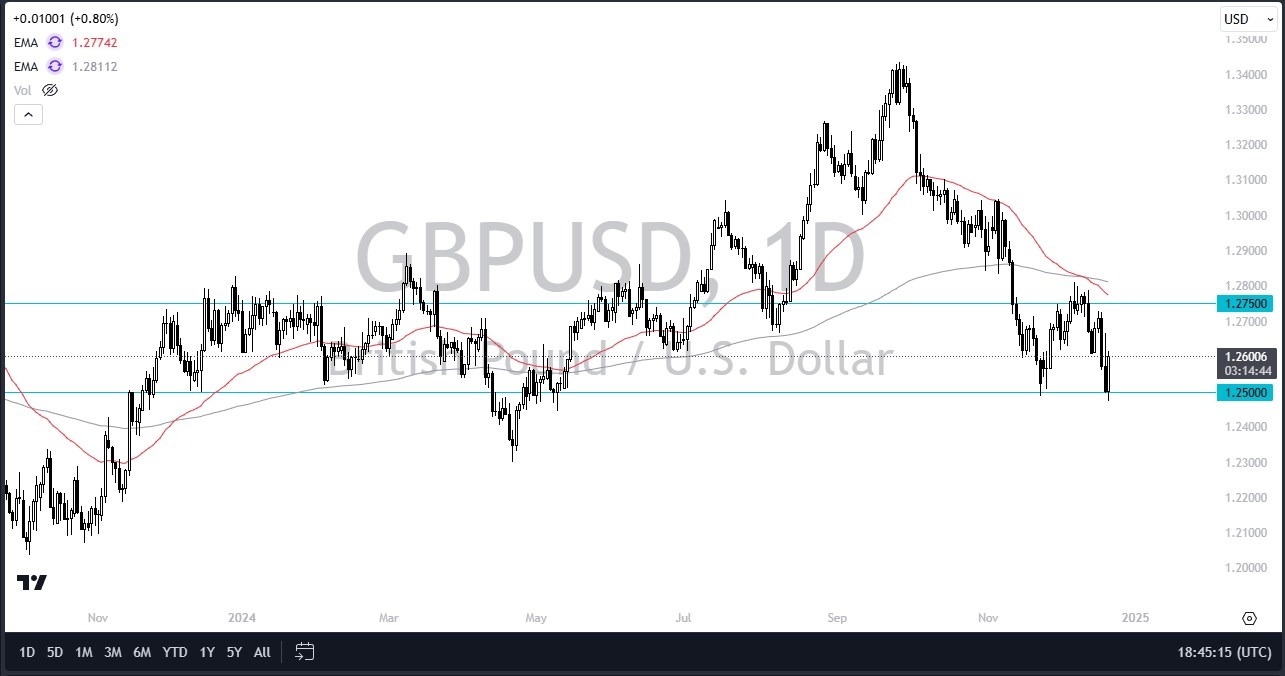
If we can continue to rally, I think the British pound probably goes looking to the 1.2750 level in general. This is a market that I think you have to be somewhat cautious with your optimism, but you also have to realize that market participants will continue to see a lot of concerns with the bond markets, especially with the US yields spiking the way they had recently. This market continues to pay close attention to the bond markets.
If we were to take out the 50 day EMA, then the market goes looking to the 1.30 level. However, there is a lot of work to be done between now and then before that actually happens. And I do think that the interest rates in America will remain a little bit elevated as the 2025 year is likely to see less interest rate cuts than people had anticipated out of the Federal Reserve.
If we do drop from here and break down below the lows of the trading session on Friday, then it’s possible that the British pound drops down to the 1.23 level. I do favor shorting this pair on signs of exhaustion after short-term rallies. We’ve had the rally, but we haven’t had the exhaustion. So with that, you have to keep an open mind, at least until the market tells you that we are in fact going in one direction or the other.
Ready to trade our GBP/USD Forex analysis? Check out the best forex trading company in UK worth using
The Silver price (XAG/USD) extends the recovery to near $29.60 during the early Asian session on Monday, bolstered by the softer-than-expected US November Personal Consumption Expenditures (PCE) Price Index inflation data. However, the upside of the white metal might be limited amid the cautious approach to monetary easing next year from the Federal Reserve (Fed).
According to the daily chart, the bearish outlook of the Silver price remains in play as the price holds below the key 100-day Exponential Moving Average (EMA). Additionally, the downward momentum is reinforced by the 14-day Relative Strength Index (RSI), which stands below the midline around 39.20, suggesting that further downside cannot be ruled out.
The potential support level for XAG/USD emerges in the $29.10-$29.00 zone, representing the lower limit of the Bollinger Band and psychological level. A breach of this level could expose $27.70, the low of September 9. The additional downside filter to watch is $26.45, the low of August 8.
On the upside, the crucial upside barrier for the precious metal is seen at the $30.00 level. Sustained trading above the mentioned level could pave the way to $30.60, the 100-day EMA. Further north, the next hurdle is located at $32.17, the upper boundary of the Bollinger Band.
Silver is a precious metal highly traded among investors. It has been historically used as a store of value and a medium of exchange. Although less popular than Gold, traders may turn to Silver to diversify their investment portfolio, for its intrinsic value or as a potential hedge during high-inflation periods. Investors can buy physical Silver, in coins or in bars, or trade it through vehicles such as Exchange Traded Funds, which track its price on international markets.
Silver prices can move due to a wide range of factors. Geopolitical instability or fears of a deep recession can make Silver price escalate due to its safe-haven status, although to a lesser extent than Gold’s. As a yieldless asset, Silver tends to rise with lower interest rates. Its moves also depend on how the US Dollar (USD) behaves as the asset is priced in dollars (XAG/USD). A strong Dollar tends to keep the price of Silver at bay, whereas a weaker Dollar is likely to propel prices up. Other factors such as investment demand, mining supply – Silver is much more abundant than Gold – and recycling rates can also affect prices.
Silver is widely used in industry, particularly in sectors such as electronics or solar energy, as it has one of the highest electric conductivity of all metals – more than Copper and Gold. A surge in demand can increase prices, while a decline tends to lower them. Dynamics in the US, Chinese and Indian economies can also contribute to price swings: for the US and particularly China, their big industrial sectors use Silver in various processes; in India, consumers’ demand for the precious metal for jewellery also plays a key role in setting prices.
Silver prices tend to follow Gold’s moves. When Gold prices rise, Silver typically follows suit, as their status as safe-haven assets is similar. The Gold/Silver ratio, which shows the number of ounces of Silver needed to equal the value of one ounce of Gold, may help to determine the relative valuation between both metals. Some investors may consider a high ratio as an indicator that Silver is undervalued, or Gold is overvalued. On the contrary, a low ratio might suggest that Gold is undervalued relative to Silver.
Despite a decline in the US dollar price after the announcement of the US Federal Reserve’s preferred US inflation reading, it is still near its two-year high amid declining expectations of US interest rate cuts by the Federal Reserve in 2025. According to forex market trading, the US dollar has risen to new highs following news that Republican lawmakers have dropped a previously agreed-upon spending bill, raising the spectre of a government shutdown over the weekend.
The US dollar’s gains also came in the wake of the Federal Reserve’s decision in the middle of last week, when interest rates were cut, but policymakers said they expect only two interest rate cuts in 2025.
The dollar price against the US dollar will remain on its upward path until Japan intervenes in the exchange markets to stop the yen’s collapse
According to stock trading platforms, US stock indices rose on the last day of 2024. According to trading, the S&P 500 index rose by 1%, the Nasdaq index rose by 0.8%. Meanwhile, the Dow Jones index gained 497 points. The gains of the US stock indices came on the heels of the preferred US inflation reading for the US Federal Reserve. Obviously, after that the Personal Consumption Expenditures index in November showed an increase of 2.4% on an annual basis, which is slightly below expectations. This helped ease market concerns raised by the Federal Reserve’s expectations of cutting US interest rates in 2025.
Investor sentiment was also affected by the threat of a US government shutdown and the pressures facing global financial markets due to threats of tariffs. According to last week’s trading, all three major US stock indices fell by 2.3%, with the Dow Jones recording its worst week since 2023.
Stock investors’ sentiment was also affected by the threat of a US government shutdown and the pressure on global financial markets due to tariff threats. According to last week’s trading, all three major US stock indices fell by 2.3%, with the Dow Jones recording its worst week since 2023.
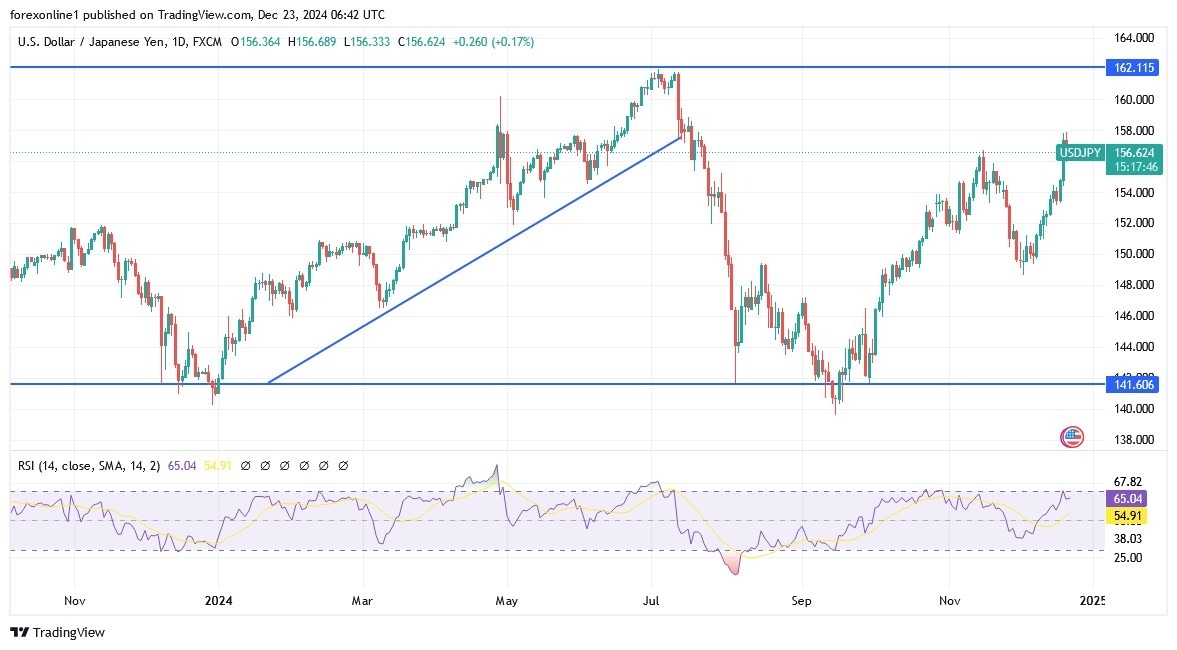
According to the performance on the daily chart, the general trend of the US dollar against the Japanese yen USD/JPY is still bullish, exceeding the resistance of 158.00, moving the relative strength index towards strong overbought levels. Moreover, the MACD indicator has the opportunity to achieve stronger gains before reaching the overbought peak. Furthermore, the strength factors of the currency pair are present and will remain until a technical downward correction occurs. We do not rule out a move towards the psychological peak of 160.00. In contrast, and in the same period of time, the bearish shift of the USD/JPY pair will begin by returning to the support level of 151.50 again. Ultimately, we still prefer to buy USD/JPY from every downward level without risk and activate profit limit and stop loss orders to ensure the safety of the trading account from any sudden price reversals.
Want to trade our USD/JPY Forex analysis and predictions? Here’s a list of forex brokers in Japan to check out.
Gold price is looking to extend its recovery from monthly lows into a third day on Monday as buyers hold their grip above the $2,600 mark. However, the further upside appears elusive amid a broad US Dollar (USD) bounce and a pause in the decline of US Treasury bond yields.
Markets cashed in on their USD long positions on Friday, taking the excuse of a slight cooldown in the monthly US headline Personal Consumption Expenditures (PCE) Price Index data for November. The Fed’s preferred inflation gauge showed an increase of just 0.1% from October, missing the forecast for a 0.2% growth while the headline PCE Price Index rose 0.1% over the month in November versus the 0.2% increase expected.
This is because the odds for a January interest rate pause by the US Federal Reserve (Fed) remained at around 90% following Wednesday’s hawkish Fed rate cut decision, the CME Group’s FedWatch Tool show.
The US central bank lowered policy rate by 25 basis points (bps) to 4.25%-4.50% range last week, as widely expected. However, the Fed’s Statement of Economic Projections (SEP), the so-called Dot Plot, predicted two quarter-percentage-point rate reductions by the end of 2025. That is half a percentage point less in policy easing next year than officials anticipated as of September.
The US Dollar corrected in sync with the US Treasury bond yields, allowing the non-yielding Gold price extend its upswing from monthly lows of $2,583.
In Monday’s trading so far, Gold price clings to recent gains as USD buyers jump back on the bids, with traders preferring to hold the buck heading into the Christmas holiday break.
The ongoing geopolitical conflict between Israel and Gaza and anticipation of potential protectionism by US President-elect Donald Trump underpin the haven demand for the US Dollar, making the USD-denominated Gold price more expensive for foreign buyers.
Gold traders will likely take cues from the broader market sentiment before placing fresh bets on the bright metal.
The short-term technical outlook for Gold price remains more or less the same as the downside bias remains intact, with the 14-day Relative Strength Index (RSI) holding below the 50 level.
Recapturing the 21-day Simple Moving Average (SMA) of $2,645 on a daily closing basis is critical to reversing the downtrend. Acceptance above that level will call for a test of the 50-day SMA at $2,669.
Further up, the $2,700 mark will challenge the bearish commitments.
If the recovery fades, Gold sellers retest the 100-day SMA resistance-turned-support at $2,610, below which the monthly low of $2,583 will be threatened.
On a sustained downside, the November 15 and 14 lows at $2,555 and $2,537, respectively, could come into play.
Gold has played a key role in human’s history as it has been widely used as a store of value and medium of exchange. Currently, apart from its shine and usage for jewelry, the precious metal is widely seen as a safe-haven asset, meaning that it is considered a good investment during turbulent times. Gold is also widely seen as a hedge against inflation and against depreciating currencies as it doesn’t rely on any specific issuer or government.
Central banks are the biggest Gold holders. In their aim to support their currencies in turbulent times, central banks tend to diversify their reserves and buy Gold to improve the perceived strength of the economy and the currency. High Gold reserves can be a source of trust for a country’s solvency. Central banks added 1,136 tonnes of Gold worth around $70 billion to their reserves in 2022, according to data from the World Gold Council. This is the highest yearly purchase since records began. Central banks from emerging economies such as China, India and Turkey are quickly increasing their Gold reserves.
Gold has an inverse correlation with the US Dollar and US Treasuries, which are both major reserve and safe-haven assets. When the Dollar depreciates, Gold tends to rise, enabling investors and central banks to diversify their assets in turbulent times. Gold is also inversely correlated with risk assets. A rally in the stock market tends to weaken Gold price, while sell-offs in riskier markets tend to favor the precious metal.
The price can move due to a wide range of factors. Geopolitical instability or fears of a deep recession can quickly make Gold price escalate due to its safe-haven status. As a yield-less asset, Gold tends to rise with lower interest rates, while higher cost of money usually weighs down on the yellow metal. Still, most moves depend on how the US Dollar (USD) behaves as the asset is priced in dollars (XAU/USD). A strong Dollar tends to keep the price of Gold controlled, whereas a weaker Dollar is likely to push Gold prices up.