The main category of Forex News.
You can use the search box below to find what you need.
[wd_asp id=1]
The main category of Forex News.
You can use the search box below to find what you need.
[wd_asp id=1]
Notice that today’s pullback to the 20-Day line was the first test of a previous resistance area since last week’s bullish breakout. The 20-Day line was reclaimed on the same day the consolidation breakout triggered. Since a new lower swing high has been generated as of today, that high at 69.98 can be watched as a potential pivot.
A little further up is a more significant upswing high at 71.79. If crude can get above and stay above that price level, higher prices become more likely. Previous resistance shows around the 70.19 to 73.27 highs, which corresponds to the 50% retracement at 72.97.
However, since a breakout of consolidation triggered there is the potential for a more aggressive move higher given the compression of the price range over recent months. In that case the 61.8% Fibonacci retracement is at 74.42 followed the 78.6% retracement at 76.47.
Also, notice that the lower boundary line of a large symmetrical triangle pattern cuts through the area between the two price levels. It also represents potential resistance. It will be interesting to see how crude oil relates to the line given that it represents the triangle.
Overall, crude remains in a downtrend. The more significant swing low of the price structure of the trend is at the swing high of 73.27 from early-October. If that price level is exceeded, then a bullish long-term reversal is indicated and an upside breakout through the triangle would have also been triggered. Regardless of current technical indications, patterns evolve or fail if they don’t follow through on the initial distinction.
December 17, 2024 – Written by Tim Boyer
STORY LINK Pound US Dollar (GBP/USD) Exchange Rate Climbs
The Pound to Dollar exchange rate (GBP/USD) gained momentum on Monday following the release of UK’s and US’s preliminary PMI data for December.
On Monday, the Pound (GBP) edged higher against most of its major trading partners after the release of the UK’s preliminary PMI data for December.
The report showed that the UK’s manufacturing index continued to decline, falling from 48.0 to 47.3, which was below the expected increase to 48.2.
However, the UK’s vital services index exceeded market expectations, rising from 50.8 to 51.4, surpassing the modest forecast of 51.0.
This forecast-beating performance in the services sector provided a substantial boost to GBP exchange rates following the data release.
On Monday, the US Dollar (USD) experienced volatility following the release of the country’s preliminary S&P Global PMIs.
Much like the Pound, the US manufacturing index declined slightly, dropping from 49.7 to 48.3, which was below the anticipated rise to 49.8.

On a more positive note, the services index surpassed expectations, climbing from 56.1 to 58.5 instead of falling to 55.7. This marked the highest level in the services sector since October 2021.
Despite this strong economic performance, USD did not gain momentum following the release. Instead, it weakened against the Pound and remained relatively stable against other currencies.
Looking ahead to Tuesday, the main driver of movement for the Pound US Dollar exchange rate will likely be the release of some high-impact economic data from both the UK and the US.
First up, the UK’s unemployment rate is expected to remain steady at 4.3%, while average earnings (excluding bonuses) are forecast to increase from 4.8% to 5%.
These economic indicators could significantly affect GBP exchange rates, particularly if there is any increased uncertainty regarding the UK’s labour market.
On the US side, the latest retail sales index will be released, and if the data meets expectations and rises from 0.4% to 0.5%, it could provide a boost to USD exchange rates.
International Money Transfer? Ask our resident FX expert a money transfer question or try John’s new, free, no-obligation personal service! ,where he helps every step of the way,
ensuring you get the best exchange rates on your currency requirements.
TAGS: Pound Dollar Forecasts
Measured moves can be used from the nearby swings to identify an upside target from recent swings. On the chart it takes the form of an ABCD pattern. The pattern looks for price symmetry between the two advancing swings, AB and CD. Other larger patterns also identify other price target levels on the chart.
The pink ABCD pattern on the chart shows the closest swings. An initial target from this pattern is up at 4.33. That is a target well above the top of the recent symmetrical triangle at 3.64. It would align with the potential for a pickup in momentum following the triangle breakout.
Nonetheless, an initial upside breakout and bull trend continuation signal is triggered above the recent highs of 3.56. That would put natural gas well on its way to approaching the top of the triangle at 3.64. Certainly, bullish momentum has the potential to have natural gas bust right through that high and head towards higher targets. Higher targets, prior to reaching 4.33, would be around the 38.2% retracement at 3.85.
Although it continues to look like there is a good chance this week will end as an inside week, if it does it sets up for the potential of a weekly inside week breakout for next week. Further up from the 38.2% retracement is a extended target for a rising ABCD pattern (purple) at 4.06.
Also, let’s consider the 4.33 target along with other price levels. Looking at the chart can be seen that there is the confluence of several indicators starting from the 4.06 price level. The target price range goes to 4.39 and then 4.50, followed by 4.56. Resistance could be seen anywhere within that zone, if it is reached.
For a look at all of today’s economic events, check out our economic calendar.
Silver price drops below the 100-day Simple Moving Average (SMA) of $30.57, extending its losses to four consecutive days, as the Greenback remains firm. At the time of writing, the XAG/USD trades at $30.42 a troy ounce, down 0.28%.
Silver continues to consolidate within the $30.00-$31.00 range for the last three trading days, clearing on its way to the bottom of the range, the 50 and 100-day Simple Moving Averages (SMAs).
Although the grey metal continues to respect the trend of higher highs and higher lows, bullish momentum seems to be fading as the XAG/USD spot price approaches the 200-day Simple Moving Average (SMA) at $29.55.
If Silver clears the latter, the bias will shift bearish, paving the way for testing $27.69, the September 6 swing low, followed by the August 8 low of $26.44.
On the upside, the 100-day SMA at $30.57 must be cleared before facing key resistance at the 50-day SMA at $31.54. On further strength, the next resistance would be the December 12 peak at $32.32.
Silver is a precious metal highly traded among investors. It has been historically used as a store of value and a medium of exchange. Although less popular than Gold, traders may turn to Silver to diversify their investment portfolio, for its intrinsic value or as a potential hedge during high-inflation periods. Investors can buy physical Silver, in coins or in bars, or trade it through vehicles such as Exchange Traded Funds, which track its price on international markets.
Silver prices can move due to a wide range of factors. Geopolitical instability or fears of a deep recession can make Silver price escalate due to its safe-haven status, although to a lesser extent than Gold’s. As a yieldless asset, Silver tends to rise with lower interest rates. Its moves also depend on how the US Dollar (USD) behaves as the asset is priced in dollars (XAG/USD). A strong Dollar tends to keep the price of Silver at bay, whereas a weaker Dollar is likely to propel prices up. Other factors such as investment demand, mining supply – Silver is much more abundant than Gold – and recycling rates can also affect prices.
Silver is widely used in industry, particularly in sectors such as electronics or solar energy, as it has one of the highest electric conductivity of all metals – more than Copper and Gold. A surge in demand can increase prices, while a decline tends to lower them. Dynamics in the US, Chinese and Indian economies can also contribute to price swings: for the US and particularly China, their big industrial sectors use Silver in various processes; in India, consumers’ demand for the precious metal for jewellery also plays a key role in setting prices.
Silver prices tend to follow Gold’s moves. When Gold prices rise, Silver typically follows suit, as their status as safe-haven assets is similar. The Gold/Silver ratio, which shows the number of ounces of Silver needed to equal the value of one ounce of Gold, may help to determine the relative valuation between both metals. Some investors may consider a high ratio as an indicator that Silver is undervalued, or Gold is overvalued. On the contrary, a low ratio might suggest that Gold is undervalued relative to Silver.
Spot Gold settled a fresh weekly low of $2,633.00 a troy ounce early in the American session, bouncing just modestly from the level in a risk-averse environment. Following a mixed performance of its overseas counterparts, Wall Street is firmly down, with the three major indexes trading in the red.
Investors got mixed macroeconomic headlines, as United States (US) Retail Sales were up a modest 0.7%, better than the 0.5% expected, yet not enough to boost the mood. The country also reported that November Capacity Utilization rose 76.8%, worse than the 77.3% expected, while Industrial Production in the same period fell 0.1%, missing the 0.3% advance anticipated by market analysts.
Meanwhile, the United Kingdom (UK) published its monthly employment figures, which showed that the ILO Unemployment Rate stayed unchanged at 4.3% in the three months to October, while the number of people claiming jobless benefits climbed by only 0.3K in November. Finally, the report showed an unexpected advance in wage pressures as Average Earnings excluding Bonus grew by 5.2% 3M YoY in October, while including bonuses were also up by 5.2%, both surpassing the market’s expectations.
Additionally, Canada reported that the Consumer Price Index (CPI) declined to 1.9% on a yearly basis in November, below the market expectation of 2%. On a monthly basis, the CPI matched the 0.4% increase recorded in October.
The US Dollar trades mixed across the FX board, firmer against commodity-linked currencies and barely down against European rivals, as the Federal Reserve (Fed) monetary policy announcement looms. The Fed will unveil its decision on monetary policy on Wednesday, and is widely anticipated to cut the benchmark interest rate by 25 basis points (bps). The focus will then be on the Summary of Economic Projections (SEP) and Chairman Jerome Powell’s words on what 2025 may bring.
From a technical point of view, the daily chart for the XAU/USD pair suggests the pair may extend its slide. It met buyers around a now flat 20 Simple Moving Average (SMA), providing dynamic resistance at around $2,655. The 100 and 200 SMAs keep heading higher well below the current level, with the 100 SMA developing in the $2,602 region. Finally, technical indicators turned lower. The Momentum indicator remains within neutral levels, but the Relative Strength Index (RSI) indicator aims lower at 46, reflecting mounting selling pressure.
The near-term picture is bearish. The XAU/USD trades below all its moving averages in the 4-hour chart, with the 20 SMA accelerating south right above converging 100 and 200 SMAs. Technical indicators, in the meantime, turned marginally higher but remain within negative levels, falling short of supporting a recovery in the upcoming Asian session.
Support levels: 2,633.00 2,617.90 2,603.15
Resistance levels: 2,643.40 2,657.30, 2,672.70
Image © Adobe Images
Nordea Bank anticipates that the Dollar will maintain its strength against the Euro throughout 2025 due to the economic divergence between the US and the Euro area; however, it says not to bet on parity just yet.
Announcing a forecast downgrade for the Euro to Dollar exchange rate (EUR/USD) for 2025, Nordea says risks that favour downside include political instability, trade wars, and a lack of improvement in economies outside of the U.S.
According to Nordea Markets’ research, the Dollar is expected to remain strong in 2025, possibly even becoming much stronger.
“There is also the potential for an even stronger dollar in the scenario of an aggressive trade war between the US and the rest of the world. Potential tariffs could put downward pressure on already weak economies outside the US and put upward pressure on US inflation, which would increase the odds that the Fed will adopt a hawkish stance,” says Philip Maldia Madsen, Macro strategist at Nordea.

Here’s a breakdown of their forecasts and the factors influencing them:
Diverging Economies: The primary driver for the strong dollar is the divergence between the US economy and the Euro area.
The U.S. economy has remained strong, while the Euro area and most other economies have slowed down. This trend is expected to continue, favouring the Dollar.
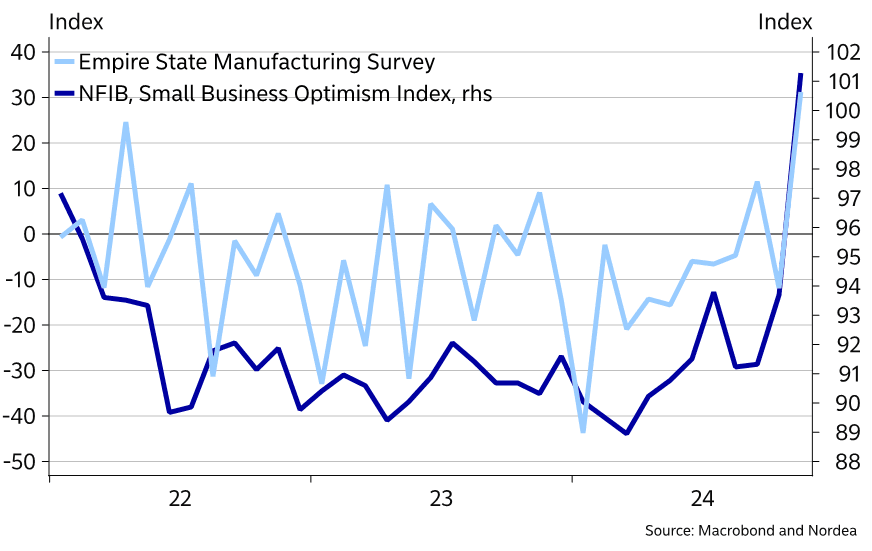
Above: “Several US sentiment indicators have skyrocketed since the election” – Nordea Markets.
Central Bank Policy: The Federal Reserve (Fed) is expected to cut its policy rate to 4.25%, while the European Central Bank (ECB) is expected to cut its policy rate to 2.25%.
This difference in policy rates is not expected to weaken or strengthen the foreign exchange rate significantly.
Investment bank EUR/USD consensus forecasts: The end-2024 and 2025 guide from Corpay has been released. Featuring the median, mean, high and low points forecasted by over 30 investment banks. Please request a copy here.
Political Risks: Political instability in Germany and France could further depress the European economy. In contrast, tax cuts in the US could increase demand and potentially reverse progress on inflation.
Trade War: An aggressive trade war between the US and the rest of the world could put downward pressure on already weak economies outside the US, and could push the dollar below parity versus the euro.
It is anticipated that tariffs could increase the odds of the Fed adopting a hawkish stance.
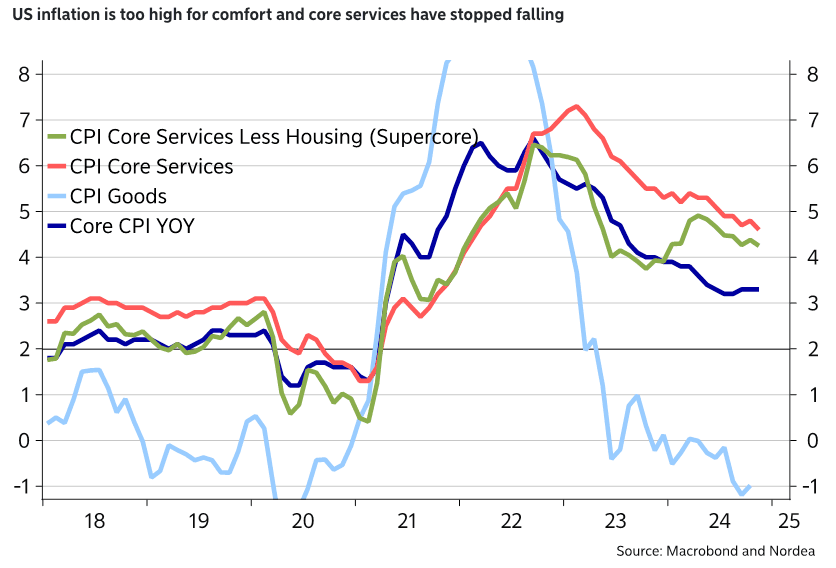
Above: “US inflation is too high for comfort and core services have stopped falling” – Nordea Markets.
Capital Flows: Despite the possibility of capital outflows due to expensive US assets, a substantial weakening of the dollar is unlikely without a clear and meaningful economic improvement in foreign economies.
The strength of the US economy is likely to continue attracting capital to dollar-denominated assets, reinforcing its dominance.
Rate Cuts: The Fed is expected to cut rates by 25 basis points this week but is expected to slow the pace of cuts.
The ECB is expected to continue cutting rates by 25 basis points at every meeting until April of next year.
Inflation: US inflation is too high for comfort.
There are concerns that the US economy may already be operating at full capacity and that further rate cuts could create a new inflation problem. The ECB is still aiming to bring rates back to neutral territory.
EUR/USD Forecast: Nordea Markets is lowering its mid-2025 EUR/USD forecast to 1.02 from 1.03 and its end-2025 forecast to 1.05 from 1.07.
“We would not be surprised if tariffs would push the dollar below parity versus the euro,” says Madsen.
Silver price (XAG/USD) slumps to near $30.30 in Tuesday’s European session. The white metal weakens as bond yields stay firm on expectations that the Federal Reserve (Fed) will signal fewer interest rate reductions in 2025 after reducing key borrowing rates by 25 basis points (bps) to 4.25%-4.50% in the monetary policy meeting on Wednesday.
10-year US Treasury yields extend their winning streak for the seventh trading day on Tuesday, rises to near 4.42%. Higher yields on interest-bearing assets bode poorly for non-yielding assets such as Silver as they increase their opportunity cost. The US Dollar Index (DXY), which tracks the Greenback’s value against six major currencies, moves higher around 107.00.
According to a Bloomberg survey, the Fed is expected to cut interest rates three times in 2025. Fed’s policy-easing cycle would be more gradual as economists worry about rising upside risks to inflation than downside risks to employment.
Investors will pay close attention to Fed Chair Jerome Powell’s press conference to get cues about to what extent policies by incoming US President Donald Trump, such as immigration, trade and taxes, will influence inflationary pressures and interest rates.
Silver price refreshes a two-week low near $30.30 on Tuesday. The white metal weakens after breaking below the 20-day Exponential Moving Average (EMA), which trades around $31.00.
The 14-day Relative Strength Index (RSI) oscillates inside the 40.00-60.00 range, suggesting a sideways trend.
Looking down, the upward-sloping trendline around $29.50, which is plotted from the February 29 low of $22.30 on a daily timeframe, would act as key support for the Silver price. On the upside, the horizontal resistance plotted from the May 21 high of $32.50 would be the barrier.
Silver is a precious metal highly traded among investors. It has been historically used as a store of value and a medium of exchange. Although less popular than Gold, traders may turn to Silver to diversify their investment portfolio, for its intrinsic value or as a potential hedge during high-inflation periods. Investors can buy physical Silver, in coins or in bars, or trade it through vehicles such as Exchange Traded Funds, which track its price on international markets.
Silver prices can move due to a wide range of factors. Geopolitical instability or fears of a deep recession can make Silver price escalate due to its safe-haven status, although to a lesser extent than Gold’s. As a yieldless asset, Silver tends to rise with lower interest rates. Its moves also depend on how the US Dollar (USD) behaves as the asset is priced in dollars (XAG/USD). A strong Dollar tends to keep the price of Silver at bay, whereas a weaker Dollar is likely to propel prices up. Other factors such as investment demand, mining supply – Silver is much more abundant than Gold – and recycling rates can also affect prices.
Silver is widely used in industry, particularly in sectors such as electronics or solar energy, as it has one of the highest electric conductivity of all metals – more than Copper and Gold. A surge in demand can increase prices, while a decline tends to lower them. Dynamics in the US, Chinese and Indian economies can also contribute to price swings: for the US and particularly China, their big industrial sectors use Silver in various processes; in India, consumers’ demand for the precious metal for jewellery also plays a key role in setting prices.
Silver prices tend to follow Gold’s moves. When Gold prices rise, Silver typically follows suit, as their status as safe-haven assets is similar. The Gold/Silver ratio, which shows the number of ounces of Silver needed to equal the value of one ounce of Gold, may help to determine the relative valuation between both metals. Some investors may consider a high ratio as an indicator that Silver is undervalued, or Gold is overvalued. On the contrary, a low ratio might suggest that Gold is undervalued relative to Silver.
The GBP/USD price analysis paints a bright future for the pound as UK labor market data shows resilience in the face of high interest rates. Meanwhile, market participants remained cautious ahead of policy meetings in the UK and the US this week.
–Are you interested to learn more about forex options trading? Check our detailed guide-
Data on Tuesday revealed that British pay growth grew more than forecast in the 3 months to October. Notably, average weekly earnings minus bonuses jumped to 5.2%, beating estimates of 5.0%. The upbeat figures further clouded the outlook for rate cuts in the UK. After the report, markets expected only two rate cuts by the end of 2025. As a result, the pound surged, recovering from last week’s lows.
Although the labor market showed resilience, data last week revealed a contraction in the economy. Markets and policymakers remain cautious about the outlook for monetary policy as they await the impact of the new UK government budget.
Meanwhile, traders expect the Bank of England to keep rates unchanged this week. However, they will focus on messaging about the future. On the other hand, the Fed will also hold its meeting and likely cut rates by 25-bps. However, data in the previous session revealed a surge in business activity in the services sector, showing continued economic resilience. At the same time, market participants have slashed bets for Fed rate cuts next year.
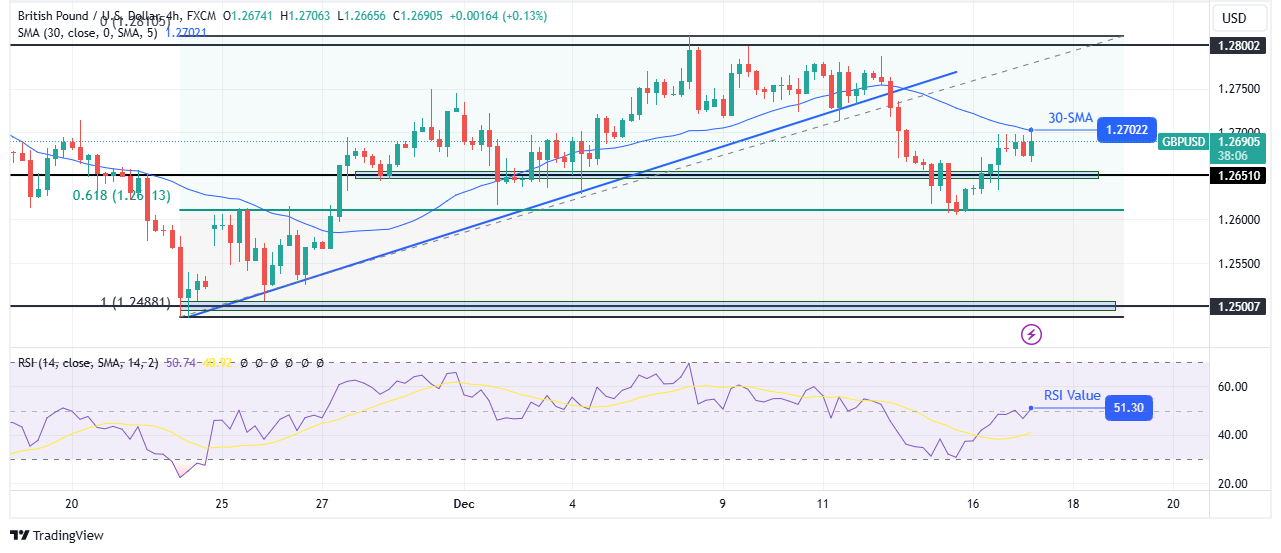
On the technical side, the GBP/USD price has pulled back to retest the 30-SMA as resistance after recently reversing to the downside. Sentiment shifted to bearish after the price broke below its bullish trendline. However, the decline paused after reaching the 0.618 Fib retracement level. Here, bulls resurfaced to challenge the new direction.
–Are you interested to learn more about forex tools? Check our detailed guide-
Bulls will take back control and aim for the 1.2800 resistance level if the price breaks above the SMA. Such an outcome would also lead to a continuation of the previous bullish trend. On the other hand, if the SMA holds firm, GBP/USD will bounce lower to retest the 0.618 Fib level. A break below this level would make a new low, continuing the downtrend.
Looking to trade forex now? Invest at eToro!
67% of retail investor accounts lose money when trading CFDs with this provider. You should consider whether you can afford to take the high risk of losing your money.
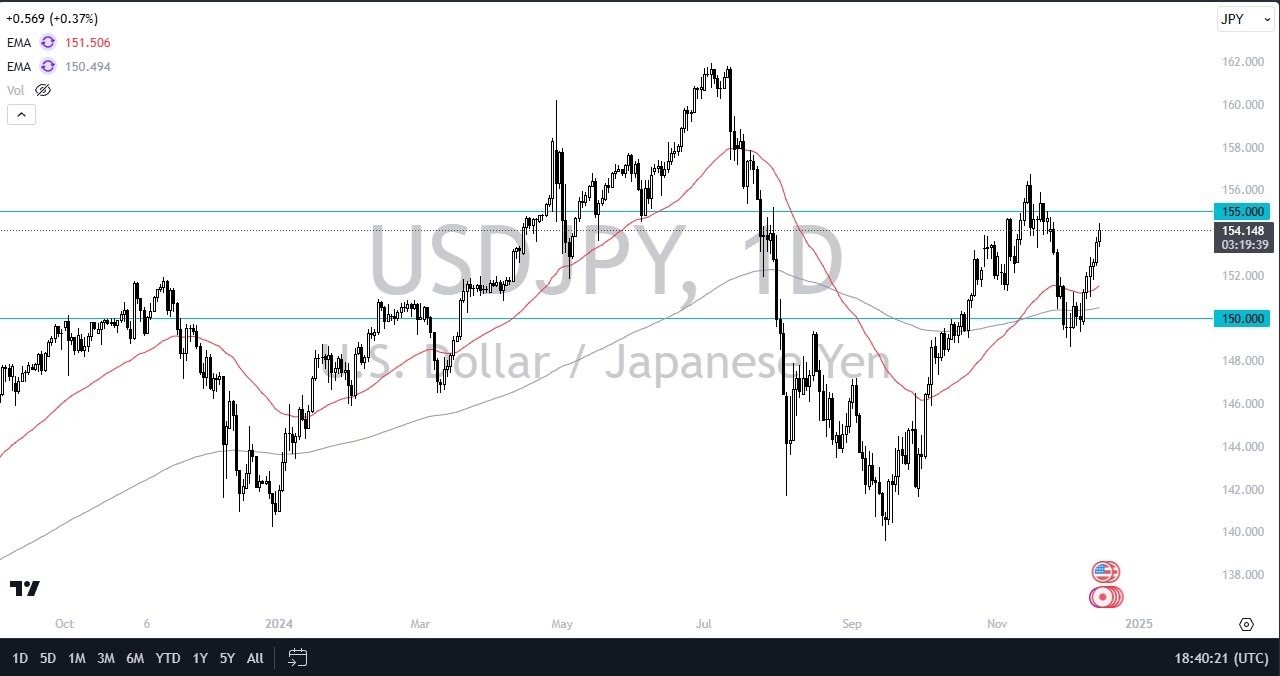
I do believe longer term that the US dollar continues to rally against the Japanese yen. But let’s be honest here, it would not be a real stretch to see people taking profit heading into the central bank announcement, especially into the Federal Reserve one, because while Jerome Powell is expected to announce a 25 basis point rate cut. The reality is we don’t really know what he’s going to say in the press conference or what the FOMC says in the statement. As things stand right now, there is an 80% chance priced into the market that the Federal Reserve will remain steady with rates into January. And that will continue to make this a positive swap situation.

Because of this, people will prefer to hold dollars. That doesn’t mean we have to go straight up in the air, and we have rallied about 450 pips in fairly short order. So, I look at a pullback as a good thing. It gives you an opportunity of buying cheaper US dollars. But I do think eventually we are going to try to break out above the 156.75 yen level to go look into the all-time high again. I don’t know if we have a huge shot higher. I just think it’s what happens given enough time. Ultimately, I think this is a move that still has some time to go, unless the FOMC shocks everyone.
Want to trade our USD/JPY forex analysis and predictions? Here’s a list of forex brokers in Japan to check out.
In May, Comex copper hit an all-time intraday high of nearly $5.20 a pound or $11,500 per tonne. Positioning went to such net lengths that dollar trading volumes scaled $100 billion (twice the Dow daily average) in one 24 hour period.
Cooler heads prevailed in London, particularly after it became clear that the squeeze was mainly a US phenomenon and cargoes destined for Rotterdam and Shanghai were soon redirected there. LME futures have yet to visit $11,000 a tonne.
A supposedly never-wrong oil hedge fund manager from France – that bastion of the commodities world – took a pause from the black stuff to forecast $40,000 a tonne for the brown metal over “the next four years or so”.
Perhaps fitting since even those with decades of experience on metals markets got caught up in the excitement, calling copper “the new oil,” the “highest conviction trade ever seen” and predicting a 50% price upside.
But like the head on a badly poured French Blanche the froth on copper markets soon settled.
Managed money longs made another big push at the end of September, this time predicated on a Beijing bazooka of economic stimulus, but the subsequent run up for copper fell well short of what was promised just like the pronouncements of the Standing Committee of the National People’s Congress.
The final blow for copper’s year of living gloriously was Trump’s tariffs and a stronger dollar and it now looks like copper will drift into the new year with most of its 2024 gains given up.
But what’s in store for 2025?
While futures are fun to follow, on and under the ground developments unfold at a slower pace – although even here surprises could be plentiful.
Copper markets took the loss of Cobre Panama mostly in stride thanks to Codelco managing to run fast enough to stand still.
Escondida, the only 1mtpa plus copper mine in the world, is also churning out metal with the latest production figures showing a 22% year on year jump, helping to lift overall Chilean output more than 6% compared to last year.
Chile’s mining association said this week copper production will range between 5.4m and 5.6m tonnes in 2025.
While major greenfield mines coming on stream is increasingly fewer and farther between with Malmyzh in Russia (120ktpa) the only entry for 2025, expansions at Almalyk in Uzbekistan (148ktpa), Kamoa Kakula (139ktpa), and QB2 in Chile, Peru’s Las Bambas in Mongolian Oyu Tolgoi each close to 80ktpa will ensure fresh supply in 2025.
With CMOC’s Tenke Fungurume and Kisanfu firing on all cylinders and ever dependable Kamoa’s contribution the DRC is likely to be once again responsible for the most additional tonnes next year as it has for the past four out of five years.
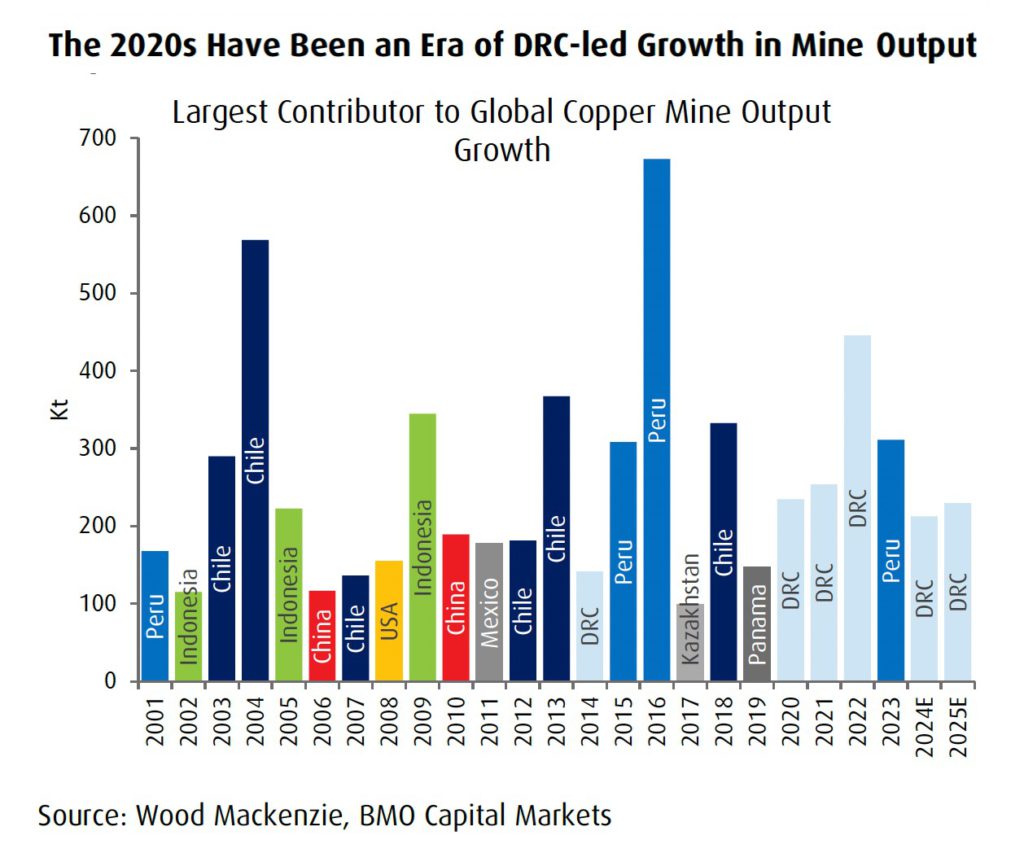
The last time the US was the greatest contributor was 2008, but the incoming Trump administration positive noises around permitting may see the country once again play its part on copper markets some time in the future.
Copper markets will remain well supplied in 2025 says BMO and at around 2.8% growth will be higher relative to recent history. Macquarie thinks output could rise by as much as 4% in 2024 and with project approvals of nearly 500kt so far in 2024, the pipeline further out may not be as thin as previously thought.
On the demand side, the backdrop of the energy transition and the rosy long term outlook for copper is very much still in place, but day-to-day it is still all about China as evidenced by the immediate response of fiscal or monetary stimulus on markets.
Overall China is responsible for around 56% of global copper consumption or around 15mt and Capital Economics in a recent research report argued that a correction in Chinese construction activity “as large as 50% decline from peak to trough” will offset most of the electrification demand.
RBC Capital Markets expects global copper demand growth of 2.9% year-over-year in 2025 with the bulk of the growth coming from outside China which will only expand by 1%.
BMO Capital Markets are more optimistic modelling 2.2% growth in China next year. Next year’s state grid budget (spending surged in 2024 by more than 20% to over $400bn) will be a factor in Chinese demand but there is consensus that the construction slump, particularly for completions, will continue to be a drag.
The all-time low benchmark treatment charges of $21.25/t (the benchmark was $80/t last year and spot TCs even went negative for several months this year) agreed between Antofagasta and Jiangxi last week lifted spirits but as many have pointed out it’s a sign of smelter overcapacity not demand for concentrate.
After promised supply cuts from Chinese refiners did not materialize 2024 turned out to be the largest (refined) copper surplus in over a decade. BMO predicts a much smaller surplus this year of around 100kt. RBC sees around half that while Macquarie is most pessimistic with a refined surplus three times BMO’s (but a deficit on concentrate markets).
Macquarie also points to the wild card for copper market over the next few years: “Should the Cobre Panama mine restart, and we believe it ultimately will, then there is the potential for an additional 300ktpa of mine supply which would keep the market in a comfortable surplus out to 2029 (all else being equal).”
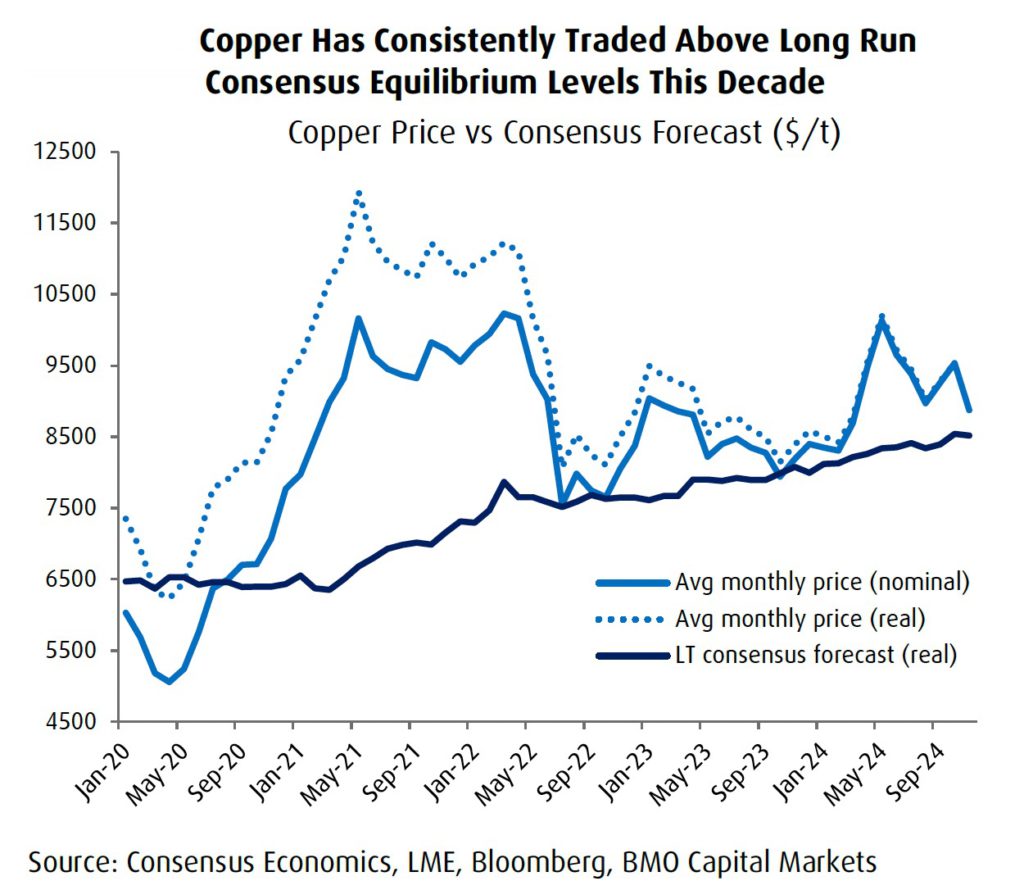
Goldman Sachs, the copper uber bulls of the last few years, took a chainsaw to its price forecast but even after cutting by $5,000 is still one of the more optimistic prognosticators. The investment bank sees copper averaging $10,160 a tonne next year.
Morgan Stanley forecasts prices will climb to $9,500 by the end of 2025. The Chile mining association is also one of the more sanguine at between $9,260–$9,920, but CitiGroup recently slashed its expectations from an average of $10,250 to $8,750 next year.
RBC lowered its 2025 estimate to $8,800 (from just under $10,000 before), while BMO’s prediction for next year is also for copper to camp out around the $4.00 or $8,800 level.
Capital Economics is the most pessimistic forecasting copper would lose touch with the $9,000 a tonne level next year, average only $8,000 by the end of 2026, and continue to drift lower through 2030.