The main category of Forex News.
You can use the search box below to find what you need.
[wd_asp id=1]
The main category of Forex News.
You can use the search box below to find what you need.
[wd_asp id=1]
Silver price (XAG/USD) falls to near $30.30 in the North American session on Wednesday. The white metal drops as investors turn cautious ahead of the Federal Reserve’s (Fed) monetary policy announcement at 20:00 GMT.
According to the CME FedWatch tool, traders have priced in a 25-basis points (bps) interest rate reduction, which will push borrowing rates lower to 4.25%-4.50%. Therefore, investors will pay close attention to the Fed’s dot plot, which shows where policymakers see Federal Fund Rates heading in the medium and long term.
A Bloomberg survey from December 6 to 11 showed that economists see the Fed reducing interest rates three times next year, assuming that progress in the disinflation process has slowed more than anticipated. The survey also indicated that economists have become more worried about upside risks to inflation than downside risks to employment, given incoming President-elect Donald Trump’s policies, including mass deportations, higher import tariffs, and tax cuts.
Ahead of the Fed meeting, the US Dollar Index (DXY), which tracks the Greenback’s value against six major currencies, consolidates around 107.00. Meanwhile, 10-year US Treasury yields rise to nearly 4.40%. Higher yields on interest-bearing assets weigh on non-yielding assets, such as Silver, because they increase their opportunity costs.
Silver price slides to a fresh two-week low near $30.20 on Wednesday. The white metal weakens after breaking below the 20-day Exponential Moving Average (EMA), which trades around $30.95.
The 14-day Relative Strength Index (RSI) oscillates inside the 40.00-60.00 range, suggesting a sideways trend.
Looking down, the upward-sloping trendline around $29.50, which is plotted from the February 29 low of $22.30 on a daily timeframe, would act as key support for the Silver price. On the upside, the horizontal resistance plotted from the May 21 high of $32.50 would be the barrier.
Silver is a precious metal highly traded among investors. It has been historically used as a store of value and a medium of exchange. Although less popular than Gold, traders may turn to Silver to diversify their investment portfolio, for its intrinsic value or as a potential hedge during high-inflation periods. Investors can buy physical Silver, in coins or in bars, or trade it through vehicles such as Exchange Traded Funds, which track its price on international markets.
Silver prices can move due to a wide range of factors. Geopolitical instability or fears of a deep recession can make Silver price escalate due to its safe-haven status, although to a lesser extent than Gold’s. As a yieldless asset, Silver tends to rise with lower interest rates. Its moves also depend on how the US Dollar (USD) behaves as the asset is priced in dollars (XAG/USD). A strong Dollar tends to keep the price of Silver at bay, whereas a weaker Dollar is likely to propel prices up. Other factors such as investment demand, mining supply – Silver is much more abundant than Gold – and recycling rates can also affect prices.
Silver is widely used in industry, particularly in sectors such as electronics or solar energy, as it has one of the highest electric conductivity of all metals – more than Copper and Gold. A surge in demand can increase prices, while a decline tends to lower them. Dynamics in the US, Chinese and Indian economies can also contribute to price swings: for the US and particularly China, their big industrial sectors use Silver in various processes; in India, consumers’ demand for the precious metal for jewellery also plays a key role in setting prices.
Silver prices tend to follow Gold’s moves. When Gold prices rise, Silver typically follows suit, as their status as safe-haven assets is similar. The Gold/Silver ratio, which shows the number of ounces of Silver needed to equal the value of one ounce of Gold, may help to determine the relative valuation between both metals. Some investors may consider a high ratio as an indicator that Silver is undervalued, or Gold is overvalued. On the contrary, a low ratio might suggest that Gold is undervalued relative to Silver.
After closing the second consecutive day in positive territory on Tuesday, GBP/USD edges lower early Wednesday and trades below 1.2700. Investors eagerly await the Federal Reserve’s (Fed) monetary policy announcements.
The table below shows the percentage change of British Pound (GBP) against listed major currencies last 7 days. British Pound was the weakest against the US Dollar.
| USD | EUR | GBP | JPY | CAD | AUD | NZD | CHF | |
|---|---|---|---|---|---|---|---|---|
| USD | 0.29% | 0.67% | 1.18% | 1.06% | 1.03% | 1.16% | 1.22% | |
| EUR | -0.29% | 0.38% | 0.90% | 0.76% | 0.74% | 0.87% | 0.93% | |
| GBP | -0.67% | -0.38% | 0.49% | 0.38% | 0.35% | 0.48% | 0.54% | |
| JPY | -1.18% | -0.90% | -0.49% | -0.12% | -0.14% | -0.02% | 0.05% | |
| CAD | -1.06% | -0.76% | -0.38% | 0.12% | -0.02% | 0.10% | 0.16% | |
| AUD | -1.03% | -0.74% | -0.35% | 0.14% | 0.02% | 0.13% | 0.19% | |
| NZD | -1.16% | -0.87% | -0.48% | 0.02% | -0.10% | -0.13% | 0.07% | |
| CHF | -1.22% | -0.93% | -0.54% | -0.05% | -0.16% | -0.19% | -0.07% |
The heat map shows percentage changes of major currencies against each other. The base currency is picked from the left column, while the quote currency is picked from the top row. For example, if you pick the British Pound from the left column and move along the horizontal line to the US Dollar, the percentage change displayed in the box will represent GBP (base)/USD (quote).
The UK’s Office for National Statistics reported in the European morning that annual inflation in the UK, as measured by the change in the Consumer Price Index (CPI), rose to 2.6% in November from 2.3% in October, as anticipated. The core CPI rose 3.5% on a yearly basis, up from the 3.3% increase recorded in October but below analysts’ estimate of 3.6%. These figures failed to trigger a noticeable market reaction.
The Fed is set to cut the policy rate by 25 basis points (bps) to the range of 4.25%-4.5% following the last meeting of the year. As such a decision is already fully priced in, it is unlikely to influence the US Dollar’s (USD) valuation in a significant way. Instead, investors will pay close attention to the revised Summary of Economic Projections (SEP), the so-called dot plot.
In case the dot plot suggests that policymakers project at least a rate reduction of 100 bps in 2025, the USD is likely to struggle to find demand. On the flip side, GBP/USD could turn south if the SEP shows that policymakers foresee less than 100 bps of rate cuts next year.
Starting at 19:30 GMT, Fed Chairman Jerome Powell will deliver the policy statement and respond to questions in a press conference. If Powell notes there is growing uncertainty surrounding the inflation outlook on potential tariffs, investors could see this as a sign that the Fed will adopt a more gradual approach to policy easing, boosting the USD.
GBP/USD faces immediate resistance at 1.2700 (100-period Simple Moving Average (SMA), Fibonacci 38.2% retracement of the latest downtrend) ahead of 1.2730 (200-period SMA) and 1.2750 (Fibonacci 50% retracement).
Looking south, first support could be spotted at 1.2670 (20-period SMA) before 1.2620 (Fibonacci 23.6% retracement).
The Pound Sterling (GBP) is the oldest currency in the world (886 AD) and the official currency of the United Kingdom. It is the fourth most traded unit for foreign exchange (FX) in the world, accounting for 12% of all transactions, averaging $630 billion a day, according to 2022 data. Its key trading pairs are GBP/USD, also known as ‘Cable’, which accounts for 11% of FX, GBP/JPY, or the ‘Dragon’ as it is known by traders (3%), and EUR/GBP (2%). The Pound Sterling is issued by the Bank of England (BoE).
The single most important factor influencing the value of the Pound Sterling is monetary policy decided by the Bank of England. The BoE bases its decisions on whether it has achieved its primary goal of “price stability” – a steady inflation rate of around 2%. Its primary tool for achieving this is the adjustment of interest rates. When inflation is too high, the BoE will try to rein it in by raising interest rates, making it more expensive for people and businesses to access credit. This is generally positive for GBP, as higher interest rates make the UK a more attractive place for global investors to park their money. When inflation falls too low it is a sign economic growth is slowing. In this scenario, the BoE will consider lowering interest rates to cheapen credit so businesses will borrow more to invest in growth-generating projects.
Data releases gauge the health of the economy and can impact the value of the Pound Sterling. Indicators such as GDP, Manufacturing and Services PMIs, and employment can all influence the direction of the GBP. A strong economy is good for Sterling. Not only does it attract more foreign investment but it may encourage the BoE to put up interest rates, which will directly strengthen GBP. Otherwise, if economic data is weak, the Pound Sterling is likely to fall.
Another significant data release for the Pound Sterling is the Trade Balance. This indicator measures the difference between what a country earns from its exports and what it spends on imports over a given period. If a country produces highly sought-after exports, its currency will benefit purely from the extra demand created from foreign buyers seeking to purchase these goods. Therefore, a positive net Trade Balance strengthens a currency and vice versa for a negative balance.
Rising non-OPEC+ production and only modest growth in global oil demand will leave the market well-supplied next year, analysts say, as they remain cautiously bearish on crude oil prices amid a myriad of uncertainties in 2025.
At the end of 2024, investment banks said they expect oil prices to stay around the current levels for 2025—in the low $70s per barrel Brent—with risks skewed to the downside on potential escalation of trade tensions.
Analysts and traders are aware that the only certain thing about oil price forecasts is that they turn out to be wrong. But with the current market fundamentals and geopolitical events, experts are more bearish than bullish on oil prices next year.
Bearish Views
The oil market will see a surplus next year even if OPEC+ begins to unwind its production cuts in April 2025 as currently planned, most analysts and investment banks say.
In early December, the OPEC+ group decided to delay the start of the easing of the 2.2 million bpd cuts to April 2025, from January 2025. The group also extended the period in which it would unwind all these cuts into the following year, until September 2026.
Due to the OPEC+ decision, next year’s surplus may not be as large as previously feared, but a surplus we will see, banks say.
“For now, we expect the oil market to be in surplus next year – although much will depend on OPEC+ production policy,” ING commodities strategists Warren Patterson and Ewa Manthey wrote in a recent note.
Oil demand growth will stay “fairly modest” in 2025 due to both cyclical and structural factors, the strategists said.
“In addition, we see another year of strong non-OPEC supply growth while OPEC still sits on a significant amount of spare production capacity, which should continue to provide comfort to the market,” they added.
The International Energy Agency (IEA) has long been predicting a large surplus in 2025.
Related: U.S. Shale Nears Limits of Productivity Gains
Even if OPEC+ keeps its oil production as-is for the whole of 2025, there would still be a surplus in supply of 950,000 barrels per day (bpd) next year, the IEA said in its monthly report last week.
If OPEC+ does begin unwinding the voluntary cuts from the end of March 2025, this glut will swell to 1.4 million bpd, according to the agency.
Global oil demand is set to rise by 1.1 million bpd next year, but it wouldn’t be able to absorb all the non-OPEC+ growth in supply coming mainly from the United States, Brazil, and Guyana, the IEA says.
OPEC also acknowledges demand has been lower this year than initially expected due to disappointing consumption figures coming out of China. The cartel last week revised down its demand growth projection for 2024 for a fifth consecutive month.
The unwinding of the OPEC+ cuts, if it is executed as planned at the latest meeting of the group, would lead to an average global inventory build of 100,000 bpd beginning in the second quarter, the EIA said in its Short-Term Energy Outlook (STEO) for December.
“We forecast that inventory builds will put some downward pressure on crude oil prices later in 2025, with Brent falling from an average of $74/b in 1Q25 to an average of $72/b in 4Q25,” the EIA said.
The administration expects an average annual Brent Crude price of $74 per barrel in 2025, down from an average of $80/b this year.
Analyst polls in recent months have also shown this trend—experts have been downgrading oil price forecasts amid weaker demand and strong supply growth.
Brent Crude prices are set to average $74.53 per barrel next year as weaker global demand growth and enough supply would offset the impact of a potential delay to the OPEC+ cuts, said 41 analysts and economists in the Reuters monthly survey for November.
Stricter U.S. sanctions against Iran under Donald Trump and geopolitical tensions could provide some support to prices early next year, but overall, expected tepid demand will weigh down on oil prices, according to analysts.
China’s looser monetary policy could revive the economy and boost demand for oil, but President-elect Trump’s promise to raise tariffs on China could weigh on economies, with tit-for-tat tariffs presenting a further downside risk to trade, economic growth, and oil demand growth.
The latest Chinese stimulus and potential further loosening of the monetary policy “could also be key for China to offset tariff threats from the US in 2025 and the move shows determination in quest to avoid a sharp economic slowdown,” Saxo Bank said last week.
Wild Cards
The incoming Trump Administration and geopolitics with the Middle East and the Russia-Ukraine war are the biggest wild cards for the world and economies next year.
Tariff threats and escalating trade tensions between the U.S. and all its trade partners – including Canada – present downside risks to oil prices. So does a strengthening U.S. dollar, amid all the tariff talk, as crude would become more expensive for holders of other currencies.
The uncertainties in 2025 could propel gold prices to new record highs, as gold would be a move to safe-haven assets amid escalating trade tensions, ING says.
“Overall, we hold a somewhat bearish view on large parts of the commodities complex for 2025 on the back of relatively comfortable fundamentals, while expectations of a stronger USD should also provide some headwinds,” ING’s strategists note.
“In addition, external risks facing markets appear to be skewed to the downside.”
By Tsvetana Paraskova for Oilprice.com
The USD/JPY forecast shows a rebound hours before the FOMC policy meeting. The dollar recovered after upbeat sales data pointed to continued resilience in the US economy, while the yen eased ahead of the Bank of Japan policy meeting.
If you are interested in automated forex trading, check our detailed guide-
After dipping in the previous session, the USD/JPY pair rebounded as markets awaited a hawkish FOMC policy meeting. Traders expect the central bank to lower borrowing costs by 25-bps. However, policymakers might take a hawkish stance on the future due to economic resilience and looming Trump policy changes.
The US economy has remained strong, with most economic reports beating expectations. On Tuesday, the US released its retail sales report, which showed an unexpected jump of 0.7% in November. Meanwhile, economists had predicted a 0.6% increase. This resilience has led to more cautious remarks by policymakers that have supported the dollar in recent weeks.
At the same time, the Trump administration will take office in January. Markets expect policy changes that will likely support the economy and boost inflation. Therefore, the Fed might have to assume a gradual pace for rate cuts.
In Japan, data on Wednesday revealed that exports increased faster than expected in November. Nevertheless, it was not enough to change the policy outlook. Markets expect the Bank of Japan to maintain rates this week, which might weaken the yen. However, a hawkish outlook from policymakers could boost the currency.
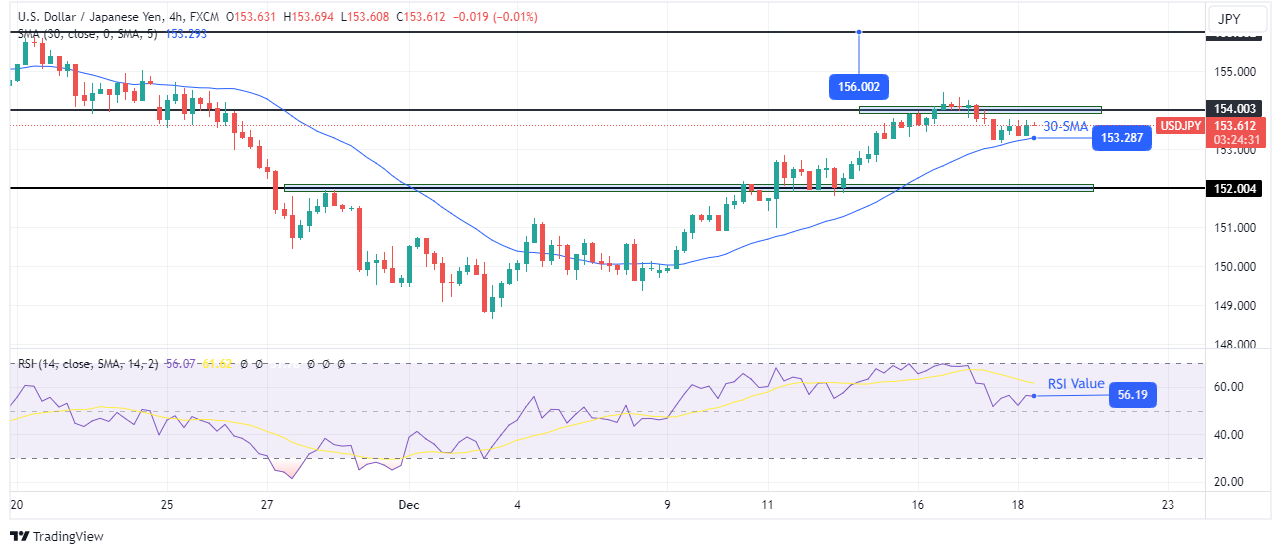
On the technical side, the USD/JPY price is bouncing higher after retesting the 30-SMA as support. The bullish bias is strong since the price has traded above the SMA since the trend reversed. At the same time, the RSI has stayed above 50 in bullish territory.
If you are interested in guaranteed stop-loss forex brokers, check our detailed guide-
Bulls paused near the 154.00 key resistance level, and bears triggered a pullback to retest the 30-SMA support. If bulls remain in charge, the price will soon breach the 154.00 resistance to target the next hurdle at 156.00. Meanwhile, if the 154.00 holds firm, bears might breach the SMA to retest the 152.00 support level.
Looking to trade forex now? Invest at eToro!
67% of retail investor accounts lose money when trading CFDs with this provider. You should consider whether you can afford to take the high risk of losing your money.
Silver (XAG/USD) struggles to capitalize on the previous day’s modest rebound from the vicinity of the monthly low, around the $30.00 psychological mark and attracts some sellers on Wednesday. The white metal remains depressed through the first half of the European session and currently trades just below mid-$30.00s, down nearly 0.30% for the day.
From a technical perspective, the recent failure near the $32.35 horizontal resistance and a subsequent slide back below the 100-day Simple Moving Average (SMA) favors bearish traders. Moreover, oscillators on the daily chart are holding in negative territory and are far from being in the oversold zone, suggesting that the path of least resistance for the XAG/USD is to the downside.
That said, it will still be prudent to wait for a sustained breakdown below the $30.00 mark before positioning for deeper losses. The XAG/USD might then weaken further below the November monthly swing low, around the $29.70-$29.65 area, towards testing the next relevant support near the $29.10-$29.00 region, which if broken should pave the way for an extension of a near two-month-old downtrend.
On the flip side, the 100-day SMA, currently around the $30.60 region, closely followed by the weekly top near the $30.75 area, now seems to act as an immediate hurdles. Some follow-through buying could assist the XAG/USD to reclaim the $31.00 mark and climb to the $31.45-$31.50 supply zone. The move up could extend towards the $32.00 round figure, which if cleared will negate the bearish outlook.
Silver is a precious metal highly traded among investors. It has been historically used as a store of value and a medium of exchange. Although less popular than Gold, traders may turn to Silver to diversify their investment portfolio, for its intrinsic value or as a potential hedge during high-inflation periods. Investors can buy physical Silver, in coins or in bars, or trade it through vehicles such as Exchange Traded Funds, which track its price on international markets.
Silver prices can move due to a wide range of factors. Geopolitical instability or fears of a deep recession can make Silver price escalate due to its safe-haven status, although to a lesser extent than Gold’s. As a yieldless asset, Silver tends to rise with lower interest rates. Its moves also depend on how the US Dollar (USD) behaves as the asset is priced in dollars (XAG/USD). A strong Dollar tends to keep the price of Silver at bay, whereas a weaker Dollar is likely to propel prices up. Other factors such as investment demand, mining supply – Silver is much more abundant than Gold – and recycling rates can also affect prices.
Silver is widely used in industry, particularly in sectors such as electronics or solar energy, as it has one of the highest electric conductivity of all metals – more than Copper and Gold. A surge in demand can increase prices, while a decline tends to lower them. Dynamics in the US, Chinese and Indian economies can also contribute to price swings: for the US and particularly China, their big industrial sectors use Silver in various processes; in India, consumers’ demand for the precious metal for jewellery also plays a key role in setting prices.
Silver prices tend to follow Gold’s moves. When Gold prices rise, Silver typically follows suit, as their status as safe-haven assets is similar. The Gold/Silver ratio, which shows the number of ounces of Silver needed to equal the value of one ounce of Gold, may help to determine the relative valuation between both metals. Some investors may consider a high ratio as an indicator that Silver is undervalued, or Gold is overvalued. On the contrary, a low ratio might suggest that Gold is undervalued relative to Silver.
EUR/USD registered small losses on Tuesday but managed to stabilize near 1.0500 in the European morning on Wednesday. The Federal Reserve’s (Fed) interest rate decision and revised Summary of Economic Projections (SEP) could cause the pair to break out of its trading range.
The table below shows the percentage change of Euro (EUR) against listed major currencies last 7 days. Euro was the weakest against the US Dollar.
| USD | EUR | GBP | JPY | CAD | AUD | NZD | CHF | |
|---|---|---|---|---|---|---|---|---|
| USD | 0.29% | 0.64% | 1.11% | 1.10% | 1.00% | 1.05% | 1.21% | |
| EUR | -0.29% | 0.35% | 0.82% | 0.80% | 0.70% | 0.75% | 0.91% | |
| GBP | -0.64% | -0.35% | 0.47% | 0.46% | 0.35% | 0.40% | 0.56% | |
| JPY | -1.11% | -0.82% | -0.47% | -0.00% | -0.10% | -0.06% | 0.11% | |
| CAD | -1.10% | -0.80% | -0.46% | 0.00% | -0.10% | -0.05% | 0.10% | |
| AUD | -1.00% | -0.70% | -0.35% | 0.10% | 0.10% | 0.05% | 0.21% | |
| NZD | -1.05% | -0.75% | -0.40% | 0.06% | 0.05% | -0.05% | 0.16% | |
| CHF | -1.21% | -0.91% | -0.56% | -0.11% | -0.10% | -0.21% | -0.16% |
The heat map shows percentage changes of major currencies against each other. The base currency is picked from the left column, while the quote currency is picked from the top row. For example, if you pick the Euro from the left column and move along the horizontal line to the US Dollar, the percentage change displayed in the box will represent EUR (base)/USD (quote).
The risk-averse market environment helped the US Dollar (USD) hold its ground on Tuesday and made it difficult for EUR/USD to gain traction.
Later in the day, the Fed is widely expected to lower the policy rate by 25 basis points (bps) to the range of 4.25%-4.5%. Since such a decision is already priced in, it is unlikely to trigger a noticeable market reaction. Instead, market participants will scrutinize the details of the revised Summary of Economic Projections (SEP), the so-called dot plot.
In case the dot plot points to a rate reduction of 100 bps or more in 2025, the USD is likely to come under pressure in the near term. On the other hand, the USD could gather strength and force EUR/USD to stay on the back foot if the revised SEP highlights less than 100 bps of rate cuts next year.
Fed Chairman Jerome Powell’s comments on the policy outlook will also be watched closely in the post-meeting press conference starting at 19:30 GMT. If Powell adopts a cautious tone regarding further policy easing, citing the uncertainty surrounding the inflation outlook on President-elect Donald Trump’s proposed tariff policies, the USD is likely to stay resilient against its rivals heading into the holidays.
EUR/USD faces stiff resistance at 1.0520, where the 100-period Simple Moving Average (SMA) on the 4-hour chart, the 50-period SMA and the Fibonacci 23.6% retracement of the latest downtrend meet. Once the pair rises above this level and starts using it as support, it could target 1.0575 (200-period SMA) and 1.0600 (Fibonacci 38.2% retracement).
Looking south, first support could be spotted at 1.0440 (static level), 1.0400 (end-point of the latest downtrend) and 1.0330 (November 22 low).
The Euro is the currency for the 19 European Union countries that belong to the Eurozone. It is the second most heavily traded currency in the world behind the US Dollar. In 2022, it accounted for 31% of all foreign exchange transactions, with an average daily turnover of over $2.2 trillion a day. EUR/USD is the most heavily traded currency pair in the world, accounting for an estimated 30% off all transactions, followed by EUR/JPY (4%), EUR/GBP (3%) and EUR/AUD (2%).
The European Central Bank (ECB) in Frankfurt, Germany, is the reserve bank for the Eurozone. The ECB sets interest rates and manages monetary policy. The ECB’s primary mandate is to maintain price stability, which means either controlling inflation or stimulating growth. Its primary tool is the raising or lowering of interest rates. Relatively high interest rates – or the expectation of higher rates – will usually benefit the Euro and vice versa. The ECB Governing Council makes monetary policy decisions at meetings held eight times a year. Decisions are made by heads of the Eurozone national banks and six permanent members, including the President of the ECB, Christine Lagarde.
Eurozone inflation data, measured by the Harmonized Index of Consumer Prices (HICP), is an important econometric for the Euro. If inflation rises more than expected, especially if above the ECB’s 2% target, it obliges the ECB to raise interest rates to bring it back under control. Relatively high interest rates compared to its counterparts will usually benefit the Euro, as it makes the region more attractive as a place for global investors to park their money.
Data releases gauge the health of the economy and can impact on the Euro. Indicators such as GDP, Manufacturing and Services PMIs, employment, and consumer sentiment surveys can all influence the direction of the single currency. A strong economy is good for the Euro. Not only does it attract more foreign investment but it may encourage the ECB to put up interest rates, which will directly strengthen the Euro. Otherwise, if economic data is weak, the Euro is likely to fall. Economic data for the four largest economies in the euro area (Germany, France, Italy and Spain) are especially significant, as they account for 75% of the Eurozone’s economy.
Another significant data release for the Euro is the Trade Balance. This indicator measures the difference between what a country earns from its exports and what it spends on imports over a given period. If a country produces highly sought after exports then its currency will gain in value purely from the extra demand created from foreign buyers seeking to purchase these goods. Therefore, a positive net Trade Balance strengthens a currency and vice versa for a negative balance.
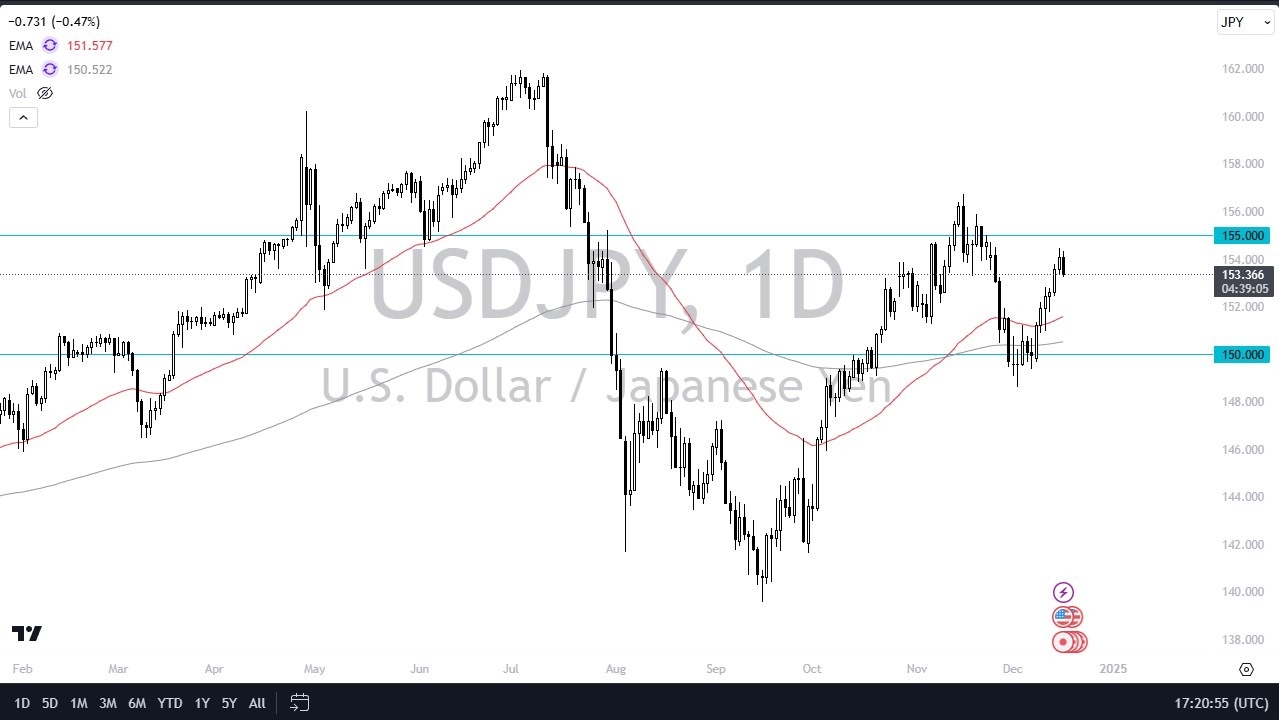
After all, we have bounced about four handles along the way, but now traders will be focusing on whatever it is that Jerome Powell has to say when it comes time to the press conference, the decision itself, coming out of the United States should be a 25 basis point cut, but where we’re going from there is the big question.

Fed Fund futures markets now have an 80% chance of the Federal Reserve sitting still in January, meaning that this will still continue to be a significant carry trade pair. However, we also have the Bank of Japan early on Thursday, and they’ll have something to say about this as well. I think because of this, it’s probably best to leave this pair alone in the short term, but I do like the idea of buying the dip. I’ll be watching closer to the 50-day EMA near the 152 yen level.
Ultimately this is a market that has been somewhat lively as of late and I think we are either going to try to find some type of range, maybe between 150 yen on the bottom and 155 yen on the top, or perhaps this is a pullback before a move higher. I suspect it’s probably the latter of the two as the US dollar, although a little overbought against quite a few currencies out there, is probably in the middle of swallowing just about everything. Next day or two though could be a bit difficult.
Want to trade our USD/JPY forex analysis and predictions? Here’s a list of forex brokers in Japan to check out.
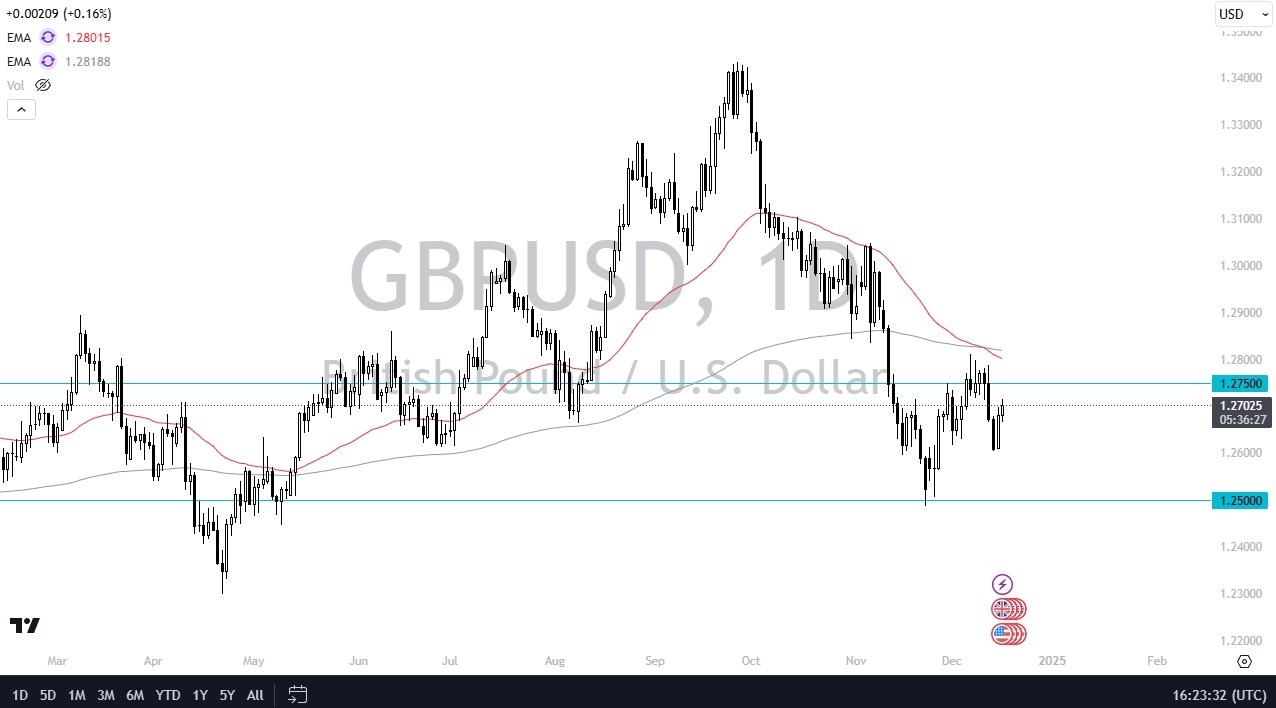
To kick things off, on Wednesday we will have the FOMC Interest Rate Announcement, and of course the press conference and statement that goes along with it. On Thursday, we have the Monetary Policy Committee coming out of the Bank of England, which is the equivalent announcement. In other words, I expect to see a lot of volatility in this pair, as it will be “Ground Zero” for a lot of noise.
I do think that the 50 Day EMA near the 1.28 level continues to act as a bit of a ceiling in this pair, and it’s not until we break above there that I would be convinced that something is changing. What I anticipate is that we will get a little bit of a rally, and then perhaps a bit of exhaustion that short sellers will be interested in. The 200 Day EMA sits just above the 50 Day EMA, so that could also come into the picture as far as a bit of a ceiling is concerned.
Underneath, we have the 1.26 level offering intermediate support, and the 1.25 level offering much more important support. I do think that this pair will be very noisy over the next couple of weeks, because quite frankly we have a situation where traders are trying to understand where the global economy is going. The Bank of England is expected to keep its interest rates flat, giving it a 25 basis points advantage over the US dollar, assuming that the FOMC does in fact cut by 25 basis points on Wednesday. In other words, it’s going to make the British pound a little bit more resilient than most other currencies against the greenback, but I think we have so much going on right now around the world and of course so much interest in investing in the United States suddenly, that we have a situation where the upside is most certainly limited. This might end up being a fairly range bound pair over the next month or 2.
Ready to trade our free trading signals? We’ve made a list of the best UK forex brokers worth using.
Silver price (XAG/USD) remains subdued for the fifth successive day, trading around $30.50 per troy ounce during the Asian hours on Wednesday. Analysis of the daily chart indicates a period of market consolidation as the pair is confined within the horizontal channel pattern.
Additionally, the alignment of the nine- and 14-day Exponential Moving Averages (EMAs) suggests that the short-term price movement is experiencing a period of consolidation, lacking a strong directional momentum. However, the 14-day Relative Strength Index (RSI) consolidates below the 50 mark, suggesting an emergence of the bearish bias.
On the downside, the XAG/USD pair may find its primary support around the lower boundary of the horizontal channel at $29.90, followed by a “throwback support” level at its three-month low of $29.65, which was recorded on November 28.
Regarding its resistance, the XAG/USD may test the nine- and 14-day EMAs at $30.82 and $30.90, respectively. A break above these levels could cause the bullish bias to re-emerge and help the Silver price to retest its six-week high of $32.28, reached on December 9, followed by the horizontal channel’s upper boundary at $32.50.
Silver is a precious metal highly traded among investors. It has been historically used as a store of value and a medium of exchange. Although less popular than Gold, traders may turn to Silver to diversify their investment portfolio, for its intrinsic value or as a potential hedge during high-inflation periods. Investors can buy physical Silver, in coins or in bars, or trade it through vehicles such as Exchange Traded Funds, which track its price on international markets.
Silver prices can move due to a wide range of factors. Geopolitical instability or fears of a deep recession can make Silver price escalate due to its safe-haven status, although to a lesser extent than Gold’s. As a yieldless asset, Silver tends to rise with lower interest rates. Its moves also depend on how the US Dollar (USD) behaves as the asset is priced in dollars (XAG/USD). A strong Dollar tends to keep the price of Silver at bay, whereas a weaker Dollar is likely to propel prices up. Other factors such as investment demand, mining supply – Silver is much more abundant than Gold – and recycling rates can also affect prices.
Silver is widely used in industry, particularly in sectors such as electronics or solar energy, as it has one of the highest electric conductivity of all metals – more than Copper and Gold. A surge in demand can increase prices, while a decline tends to lower them. Dynamics in the US, Chinese and Indian economies can also contribute to price swings: for the US and particularly China, their big industrial sectors use Silver in various processes; in India, consumers’ demand for the precious metal for jewellery also plays a key role in setting prices.
Silver prices tend to follow Gold’s moves. When Gold prices rise, Silver typically follows suit, as their status as safe-haven assets is similar. The Gold/Silver ratio, which shows the number of ounces of Silver needed to equal the value of one ounce of Gold, may help to determine the relative valuation between both metals. Some investors may consider a high ratio as an indicator that Silver is undervalued, or Gold is overvalued. On the contrary, a low ratio might suggest that Gold is undervalued relative to Silver.
Despite the latest uptick, Gold price remains in a familiar range near $2,650 early Wednesday. Gold price appears to lack bullish commitment in the lead-up to the US Federal Reserve (Fed) showdown.
Gold price has failed to sustain the upside attempts so far this week, giving into the bearish pressures on Tuesday to hit the lowest level in six days at $2,633. The unabated buying interest in US Treasury bond yields mainly sponsored the downturn in Gold price. Markets continued to believe that the Fed could pause its easing cycle early next year, especially after robust US Retail Sales data.
US Retail Sales increased 0.7% in November, outpacing expectations of a 0.5% growth in the reported period. However, the US Treasury bond yields quickly pulled back due to worsening risk sentiment on global markets. Traders turned cautious and refrained from placing bets on risk assets ahead of the critical Fed interest rate decision. This helped Gold price to limit losses and regain $2,640 at the close.
Markets remain risk-averse early Wednesday, with traders non-committal on their US Dollar positions, leaving Gold price gyrating in a narrow band. The next direction in Gold price now remains at the mercy of the language in the Fed’s policy statements, its economic projections and Chairman Jerome Powell’s press conference.
If the Summary of Economic Projections (SEP), the so-called ‘Dot-plot’ chart, points to fewer rate cuts next year than previously forecast, the US Dollar will likely see a fresh leg higher at the expense of the non-interest-bearing Gold price. Powell’s comments will also be closely scrutinised for the timing of the next rate cut if he expresses caution about inflation under Donald Trump’s presidency.
Risks appears skewed to the downside in Gold price, justified by the hawkish Fed expectations and the daily technical setup.
The daily chart shows that Gold price surrendered the 21-day Simple Moving Average (SMA) at $2,655 once again.
The 14-day Relative Strength Index (RSI) is trading flat but below the 50 level, suggesting that sellers could retain control going forward.
The immediate resistance aligns at the 21-day SMA at $2,655. However, Gold buyers need to find acceptance above the 50-day SMA at $2,672 to initiate a meaningful upside toward the $2,700 level.
Further up, Gold price could revisit the multi-week high of $2,726.
On the downside, the weekly low of $2,633 could offer some support, below which the December 6 low of $2,613 will be tested.
Gold sellers will then target the $2,600 area, where the 100-day SMA coincides with the November 26 low.
Gold has played a key role in human’s history as it has been widely used as a store of value and medium of exchange. Currently, apart from its shine and usage for jewelry, the precious metal is widely seen as a safe-haven asset, meaning that it is considered a good investment during turbulent times. Gold is also widely seen as a hedge against inflation and against depreciating currencies as it doesn’t rely on any specific issuer or government.
Central banks are the biggest Gold holders. In their aim to support their currencies in turbulent times, central banks tend to diversify their reserves and buy Gold to improve the perceived strength of the economy and the currency. High Gold reserves can be a source of trust for a country’s solvency. Central banks added 1,136 tonnes of Gold worth around $70 billion to their reserves in 2022, according to data from the World Gold Council. This is the highest yearly purchase since records began. Central banks from emerging economies such as China, India and Turkey are quickly increasing their Gold reserves.
Gold has an inverse correlation with the US Dollar and US Treasuries, which are both major reserve and safe-haven assets. When the Dollar depreciates, Gold tends to rise, enabling investors and central banks to diversify their assets in turbulent times. Gold is also inversely correlated with risk assets. A rally in the stock market tends to weaken Gold price, while sell-offs in riskier markets tend to favor the precious metal.
The price can move due to a wide range of factors. Geopolitical instability or fears of a deep recession can quickly make Gold price escalate due to its safe-haven status. As a yield-less asset, Gold tends to rise with lower interest rates, while higher cost of money usually weighs down on the yellow metal. Still, most moves depend on how the US Dollar (USD) behaves as the asset is priced in dollars (XAU/USD). A strong Dollar tends to keep the price of Gold controlled, whereas a weaker Dollar is likely to push Gold prices up.