The main category of Forex News.
You can use the search box below to find what you need.
[wd_asp id=1]
The main category of Forex News.
You can use the search box below to find what you need.
[wd_asp id=1]
Following the uptick in US CPI and PPI data, and the market’s priced in a Fed rate cut for next week, the US Dollar index stabilized above the 107-mark again. If the 108-resistance zone is breached, currencies may face critical lows, prompting central banks to adopt aggressive measures to stabilize their economies. Banks like the SNB, BOC, and PBOC have already announced drastic actions, with the ECB potentially following suit ahead of risks tied to Trump’s policies in 2025.
Expectations of a BOE rate hold have been driven by inflationary pressures from the UK’s new labor law. However, the contraction in GDP to -0.1% heightens concerns about economic growth and complicates the BOE’s decision-making process. Increased volatility in the British pound is expected next week, influenced by flash PMI data on Monday and employment figures on Tuesday, which will play a final pivotal role in shaping BOE insights.

Source: Tradingview
Using the Fibonacci extension tool between the 2021 high, 2022 low, and 2024 high, the recent drop in GBPUSD has found support at the 0.272 extension level. The next significant support level lies at the 0.382 extension. Should GBPUSD fail to sustain its rebound above the critical 1.2480 level, further declines could test support zones between the October 2023 and February 2023 lows, with support zones 1.21 and 1.19.
On the upside, the current candlestick pattern forming above the 1.25 support indicates a weekly bullish engulfing pattern, signaling strong reversal potential. Key resistance levels to watch to resume a bullish scenario include 1.30 and 1.3170.
— Written by Razan Hilal, CMT on X: @Rh_waves and Forex.com You Tube
The final working week of 2024 shapes up as pivotal for USD/JPY traders, with the Federal Reserve and Bank of Japan interest rate decisions landing just hours apart. These twin events overshadow all other data, including the Fed’s preferred inflation measure, the core PCE deflator, released on Friday. How the market reacts to these decisions will likely define USD/JPY’s trajectory as we enter 2025.
Before digging into the detail, here’s the major events calendar for the United States and Japan next week. Note times shown are US Eastern.
Source: TradingView
While Tuesday’s retail sales and Friday’s PCE reports will offer key updates on the health of the US consumer – the largest driver of the US economy – the week will be dominated by the Fed’s interest rate decision rather than its preferred inflation gauge, the core PCE deflator. The latter rarely surprises these days, leaving the Fed decision as the far more significant event for USD/JPY traders.
With a 25bps cut now seen as a near-certainty, the Fed’s updated economic and interest rate projections are expected to drive market movements. These projections will not only influence the front end of the US interest rate curve but also the belly and back end, which have been pivotal in driving USD/JPY moves.

Source: TradingView
Jerome Powell’s remarks last month – highlighting that downside risks to the labour market had diminished while inflation remained more persistent than anticipated – have traders on edge for a potential hawkish cut. The Fed’s forward guidance will therefore be key.
Unemployment is likely undershooting, and inflation overshooting, the Fed’s September forecasts. With 100bps of rate cuts set to be delivered in 2024, as outlined three months ago, the question now is how much easing the Fed signals for next year, and where members see the neutral funds rate, where inflation pressures and unemployment stabilise.

Source: Federal Reserve
In September, the Fed anticipated 100bps of cuts and a neutral rate of 2.9%. Both now seem overly dovish given recent data flow. This opens the door to a more restrained signal, perhaps as few as two, or even one, rate cut for 2025 in the updated dot plot. If the Fed maintains a projection for four 25bps cuts, it could stoke concerns about its willingness to finish the inflation fight.
The long-run dot, reflecting the median FOMC estimate for the neutral policy rate, may also shift higher. While members have been cautious about revising these projections, a minor adjustment to 3% or slightly above seems likely. A larger revision to 3.2% or more could trigger a sharp rise in US Treasury yields, with the Japanese yen likely to feel the heat.

Source: TradingView
Positioning for a hawkish adjustment is evident in US interest rate futures. Two- and 10-year contracts have broken down over the past week, signalling expectations for higher yields.
The 10-year Treasury note future has rolled over decisively, with momentum shifting sharply to the downside. With uptrend support wiped out, further price weakness looks likely in the near term, pointing to rising US Treasury yields and potential US dollar strength against the yen.
One roadblock standing in the way of continued USD/JPY upside is the BoJ interest rate decision on Thursday.

It’s likely to spark volatility in USD/JPY as soon as the outcome is released, with traders divided on whether the BoJ will lift overnight rates and, if so, by how much. Will it opt for a 10, 15, or 25bps hike, or hold off until February or March?
While the outcome is uncertain, one thing is clear: a hike exceeding 15bps would likely trigger a downside move in USD/JPY as the yen strengthens. On the other hand, if the BoJ keeps rates unchanged, there’s a solid chance of a kneejerk upside reaction.
That said, the US rate outlook remains the dominant driver of USD/JPY movements for now. Once the initial volatility from the BoJ decision fades, expect US Treasury yields to reassert their influence.

Source: TradingView
The impact of higher US Treasury yields on USD/JPY is obvious on the daily chart, with the pair resuming its push higher just as yields bottomed. Having cleared the important 200-day moving average, and with momentum indicators like RSI (14) and MACD generating bullish signals, for the first time in weeks, a bullish bias is preferred.
Resistance is located at 153.80, 155.89 and 156.75, the latter the high struck immediately before the US presidential election. On the downside, support is found at the 200DMA, uptrend support around 151 and 148.65.
Good luck with your trading and thanks to everyone who has read these weekly outlook guides in 2024. Coverage in 2025 will resume midway through January.
— Written by David Scutt
Follow David on Twitter @scutty
Gold price (XAU/USD) recovers some lost ground to around $2,690 during the Asian trading hours on Friday after retreating from a five-week high in the previous session. All eyes will be on the US Federal Reserve (Fed) interest rate decision next week.
Gold buying by central banks, including the People’s Bank of China (PBoC) could provide some support on the yellow metal. The Chinese central bank resumed gold purchases in November after a six-month hiatus, increasing its reserves to 72.96 million fine troy ounces. This move comes as Beijing signals a shift to an “appropriately loose” monetary policy, with plans for a more proactive fiscal approach in 2024. Goldman Sachs analysts noted that the People’s Bank of China (PBoC) “may even increase Gold demand during periods of local currency weakness to boost confidence in their currency.”
Additionally, the escalating tensions in the Middle East might boost the safe-haven demand flows, benefiting the precious metal. Reuters reported that an Israeli strike killed at least 30 Palestinians and wounded 50 others who were sheltering in a post office in the central Gaza Strip, bringing the death toll on Thursday in the enclave to 66.
On the other hand, the speculations that US President-elect Donald Trump’s tariff policies might prompt inflation might convince the Fed to adopt a more cautious stance on cutting interest rates. This, in turn, could act as a headwind for non-yielding assets like gold. According to CME Group’s FedWatch Tool, traders are now pricing in a nearly 96.4% chance that the Fed will reduce its rate by 25 basis points (bps) rate cut at the December meeting.
Gold has played a key role in human’s history as it has been widely used as a store of value and medium of exchange. Currently, apart from its shine and usage for jewelry, the precious metal is widely seen as a safe-haven asset, meaning that it is considered a good investment during turbulent times. Gold is also widely seen as a hedge against inflation and against depreciating currencies as it doesn’t rely on any specific issuer or government.
Central banks are the biggest Gold holders. In their aim to support their currencies in turbulent times, central banks tend to diversify their reserves and buy Gold to improve the perceived strength of the economy and the currency. High Gold reserves can be a source of trust for a country’s solvency. Central banks added 1,136 tonnes of Gold worth around $70 billion to their reserves in 2022, according to data from the World Gold Council. This is the highest yearly purchase since records began. Central banks from emerging economies such as China, India and Turkey are quickly increasing their Gold reserves.
Gold has an inverse correlation with the US Dollar and US Treasuries, which are both major reserve and safe-haven assets. When the Dollar depreciates, Gold tends to rise, enabling investors and central banks to diversify their assets in turbulent times. Gold is also inversely correlated with risk assets. A rally in the stock market tends to weaken Gold price, while sell-offs in riskier markets tend to favor the precious metal.
The price can move due to a wide range of factors. Geopolitical instability or fears of a deep recession can quickly make Gold price escalate due to its safe-haven status. As a yield-less asset, Gold tends to rise with lower interest rates, while higher cost of money usually weighs down on the yellow metal. Still, most moves depend on how the US Dollar (USD) behaves as the asset is priced in dollars (XAU/USD). A strong Dollar tends to keep the price of Gold controlled, whereas a weaker Dollar is likely to push Gold prices up.
It is worth noting that according to the European Central Bank, they expect the European economy to recover over the next several years, but they also recognize that there could be a bit of sluggish short-term growth due to geopolitical risks and consumer confidence issues. While I agree with that assessment, I think Europe has major structural issues that they will have to come to terms with, and there could be a bit of a crisis when it comes to sovereign debt before this is all said and done, but I digress.

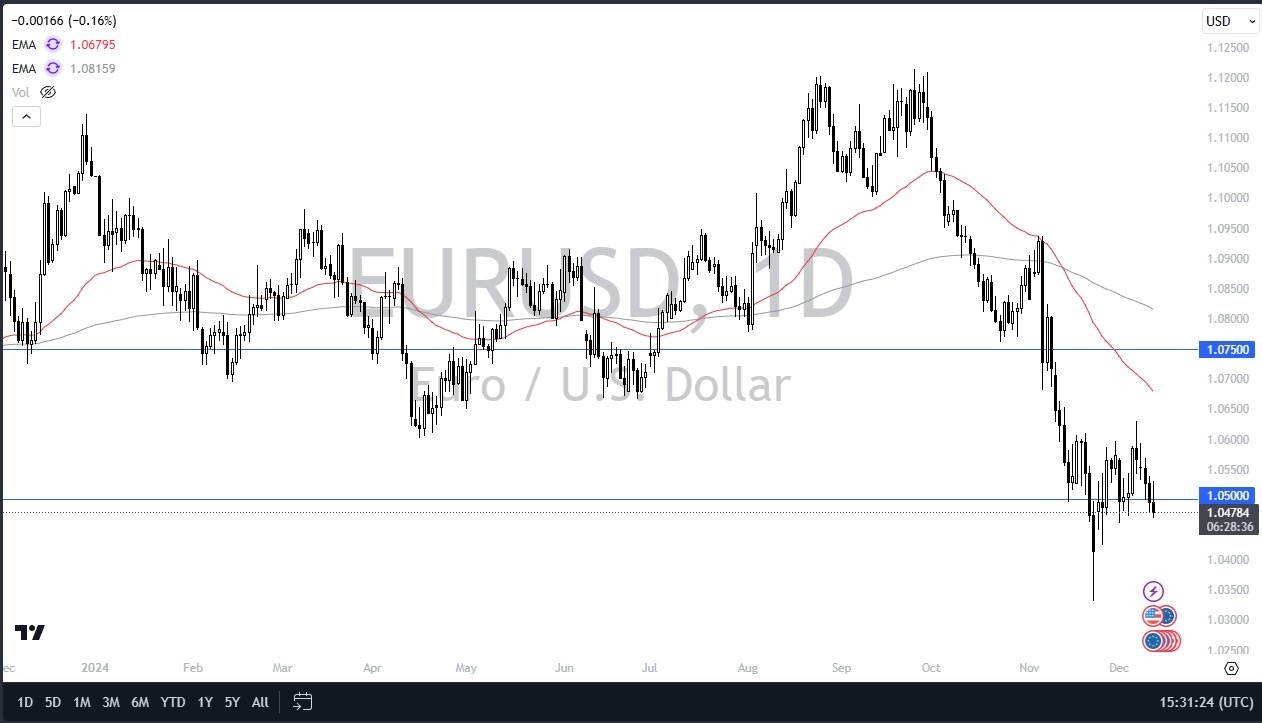
The market initially tried to rally during the day but was squashed as it entered a fairly significant area of consolidation. That being said, it is probably worth noting that we are still in that consolidation, albeit just barely. The market is seemingly using the 1.05 level for a bit of an anchor at the moment, and as long as that’s the case, I think range bound traders will be attracted to this market. However, there’s really nothing to suggest that the euro is suddenly going to take off to the upside against the US dollar. While we do have the Federal Reserve meeting next week, it’s expected that the Americans will probably sit still with their monetary policy until at least March.
This sets up the possibility of more “fade the rally” type of set ups in this market. If we were to break that 1.03 level underneath though, we will hit parity before it is all said and done. While I don’t know if that happens right away, that’s exactly what I expect to happen before the trend reverses.
Ready to trade our Forex EUR/USD daily forecast? We’ve shortlisted the best forex broker list for you to check out.
Silver price (XAG/USD) extends its losses for the second session, trading around $30.90 per troy ounce during the Asian hours on Friday. The daily chart analysis indicates a momentum shift to bearish from bullish bias as the pair has broken below the ascending channel pattern.
The XAG/USD pair moves below the nine- and 14-day Exponential Moving Averages (EMA), indicating an ongoing bearish outlook and signaling to weaken short-term price momentum. This points to increasing selling interest and raises the likelihood of further price depreciation.
Additionally, the 14-day Relative Strength Index (RSI) falls below the 50 mark, further confirming the emergence of the bearish bias.
On the downside, the XAG/USD pair could navigate the region around the psychological level of $30.00, followed by a “throwback support” level at its three-month low of $29.65, which was recorded on November 28.
The immediate barriers appear at the 14-day EMA at $31.18, followed by the nine-day EMA at $31.22. A break above these levels could cause the bullish bias to re-emerge and help the Silver price to return to the ascending channel pattern.
A return to the channel would support the XAG/USD pair to retest its five-week high of $32.28, followed by the ascending channel’s upper boundary at $33.00.
Silver is a precious metal highly traded among investors. It has been historically used as a store of value and a medium of exchange. Although less popular than Gold, traders may turn to Silver to diversify their investment portfolio, for its intrinsic value or as a potential hedge during high-inflation periods. Investors can buy physical Silver, in coins or in bars, or trade it through vehicles such as Exchange Traded Funds, which track its price on international markets.
Silver prices can move due to a wide range of factors. Geopolitical instability or fears of a deep recession can make Silver price escalate due to its safe-haven status, although to a lesser extent than Gold’s. As a yieldless asset, Silver tends to rise with lower interest rates. Its moves also depend on how the US Dollar (USD) behaves as the asset is priced in dollars (XAG/USD). A strong Dollar tends to keep the price of Silver at bay, whereas a weaker Dollar is likely to propel prices up. Other factors such as investment demand, mining supply – Silver is much more abundant than Gold – and recycling rates can also affect prices.
Silver is widely used in industry, particularly in sectors such as electronics or solar energy, as it has one of the highest electric conductivity of all metals – more than Copper and Gold. A surge in demand can increase prices, while a decline tends to lower them. Dynamics in the US, Chinese and Indian economies can also contribute to price swings: for the US and particularly China, their big industrial sectors use Silver in various processes; in India, consumers’ demand for the precious metal for jewellery also plays a key role in setting prices.
Silver prices tend to follow Gold’s moves. When Gold prices rise, Silver typically follows suit, as their status as safe-haven assets is similar. The Gold/Silver ratio, which shows the number of ounces of Silver needed to equal the value of one ounce of Gold, may help to determine the relative valuation between both metals. Some investors may consider a high ratio as an indicator that Silver is undervalued, or Gold is overvalued. On the contrary, a low ratio might suggest that Gold is undervalued relative to Silver.
(MENAFN– Daily Forex)
The euro has rallied a little bit during the early hours on Thursday as we continue to see a lot of choppy behavior with the euro against the pound.
The 0.8250 level is an area that has been rather significant support and ultimately, I think this area is something that you need to pay close attention to.
Not only is it important right now, but it’s been important multiple times going back all the way to 2016.
We are on the precipice of perhaps falling apart or perhaps bouncing significantly. We’ll just have to wait and see if we do drop down below the 0.8250 level and even the 0.82 level then we have a situation where the market would really start to tank for the euro, you’d probably see the euro tanking against the US dollar as well i do think that’s a real possibility here so because of that I’m not willing to throw a huge position on to the upside.Top Forex Brokers1 Get Started 74% of retail CFD accounts lose money IF We Break HigherThat being said, if we could recapture the 0.8350 level, then we may get a grind higher. That I don’t think would be a quick move, but it is a possibility. I mean, it’s something that we’ve seen previously, but the euro just looks really threatened right now. And if we do break down below the 0.82 area, you could see the market drop all the way down to the 0.76 level before it’s all said and done. Obviously, this would be a huge move and would take quite a bit of time to get there. Ultimately, if that were to happen, I would also anticipate that the Euro would be doing better against the US dollar, and it could be a longer-term“buy on the dips” trend that a lot of people would be following. I don’t anticipate this happening, but it is something that you need to keep in the back of your mind.Ready to trade our daily Forex analysis? We’ve made this UK forex brokers list for you to check out.
EURUSD Chart by TradingView
MENAFN06122024000131011023ID1108963606

Legal Disclaimer:
MENAFN provides the information “as is” without warranty of any kind. We do not accept any responsibility or liability for the accuracy, content, images, videos, licenses, completeness, legality, or reliability of the information contained in this article. If you have any complaints or copyright issues related to this article, kindly contact the provider above.
According to reliable trading platforms, the EUR/USD pair may remain in a cautious downward waiting position until the announcement of the European Central Bank today. In general, financial markets expect another 25-basis point cut from the European Central Bank, which would reduce the rate from 3.25% to 3.00% following a similar 25 basis point cut in October. Overall, if the European Central Bank implements another interest rate cut this month, the Euro is likely to weaken against other major currencies due to further monetary policy easing within the bloc. Ahead of today’s event, the Euro’s performance has struggled to attract investor interest due to a mix of mixed economic data and generally positive market sentiment, which tends to diminish the attractiveness of the single European currency.
As a safe-haven asset, the Euro often loses strength when market conditions are optimistic, making it less attractive compared to higher-risk currencies.
According to stock trading company platforms, the Euro Stoxx 50 (SX5E) index has seen an eight-day consecutive upward trend. This has been helping to support the Euro against the US Dollar. According to trades, the SX5E index has risen for eight consecutive days, outperforming the SPX index throughout those days, a feat we have seen only once before in more than 25 years. Overall, the rise in European equities has led to an exceptionally high information ratio for the SX5E index, indicating strong risk-adjusted returns. The rise was broad-based, encompassing most European sectors and positively impacting the exchange rate of the Euro against the Dollar (EUR/USD).
The rise in European stock prices has been observed despite the economic and political uncertainty of the largest economies in the Eurozone. Barclays attributed this rise in Eurozone equities to several key factors:
The EUR/USD price is increasing in the bearishness ahead of today’s ECB announcement. Furthermore, be cautious and do not rely on what is expected from the bank and wait for the reaction to the announcement to move towards strong trading opportunities.
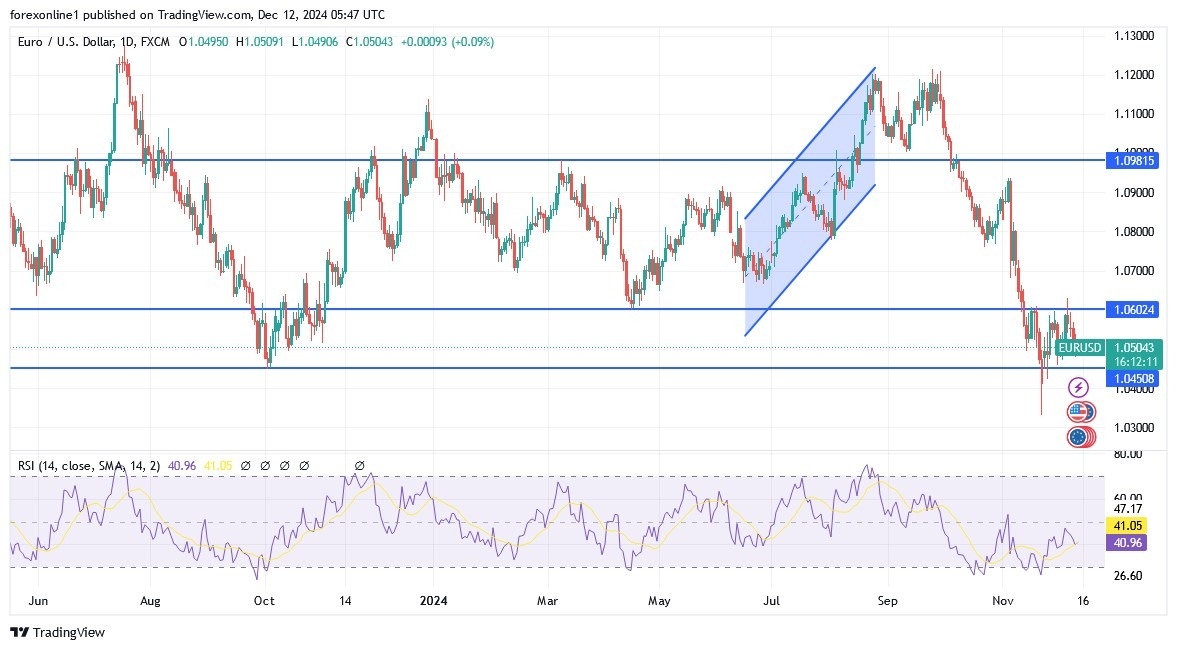
By examining the performance of the Euro-US Dollar EUR/USD price, it is confirmed that the general downward trend is stronger and may remain as long as the price is stable around and below the psychological support level of 1.0500. As we mentioned before and I confirm now, expectations for the future parity price of the Euro Dollar may strengthen if the bears move first towards the support levels of 1.0435 and 1.0320 respectively. At the same time, the technical indicators will move towards strong oversold levels. Led by the Relative Strength Index and the MACD indicator. In contrast, to achieve an initial break of the downward trend, the bulls must move the currency pair towards the resistance levels of 1.0670 and 1.0830 respectively. Also, the Euro Dollar will focus on US data led by the weekly jobless claims and the inflation reading of the Producer Price Index.
Ready to trade our daily EUR/USD Forex analysis? We’ve made this forex brokers list for you to check out.
Nonetheless, a decisive advance above 3.56 triggers a continuation of the bull trend. And a new portion of the trend has likely recently begun, following the upside breakout of a symmetrical triangle pattern on November 20. The recent retracement found support around the 61.8% Fibonacci support level and the pattern breakout level of 3.02, which eventually lead to an improvement in upward momentum as seen the past couple of days.
Moreover, a weekly bullish reversal triggered this week on a rally above last week’s high of 3.28, and the week should end above the high, thereby confirming the reversal. This is classic bullish behavior given the subsequent rebound from the 2.98 swing low.
A decisive rally above the 3.56 high puts natural gas on track to target the 2023 high of 3.64, and likely continue to rise from there. The high is the top of the triangle pattern and a rally above the top of the pattern would provide another piece of bullish evidence if triggered. There are several higher targets thereafter as marked on the chart. The more significant and higher price target is up around a price range from 4.39 to 4.56. That range begins with prior monthly support and ends with a 50% retracement level.
On the way towards 4.39, if natural gas continues to strengthen, the first area to watch for resistance above the 3.64 peak is 4.06. That is where a rising ABCD pattern (purple) hits its 161.8% extended target. However, that will likely be a minor level heading towards a price zone around a 38.2% Fibonacci retracement at 3.85. Close by is the 127.2% extension of a large rising ABCD pattern (orange) at 3.87. Watch the price levels together as a range.
For a look at all of today’s economic events, check out our economic calendar.
Spot Gold came under selling pressure on Thursday, trading around $2,680 a troy ounce. The US Dollar (USD) gathered momentum early in the American session following the release of dismal United States (US) data.
The country reported that Initial Jobless Claims for the week ended December 6 increased to 242K, worse than the 220K expected and above the previous 225K. Additionally, the November Producer Price Index (PPI) came in higher than anticipated, rising 3.4% on a yearly basis against the expected 3.2% and the previous 3.1%. The news pushed speculative interest into further betting on Federal Reserve (Fed) interest rate cuts through 2025.
Wall Street started the day with modest optimism but finally gave up. The three major indexes trade in the red, reflecting the poor sentiment. For a change, however, the USD has gathered more attention than gold as a safe haven.
Market players are now heading into a more quiet day, as the macroeconomic calendar has nothing relevant to offer on Friday. However, the Bank of Japan (BoJ), the Federal Reserve (Fed) and the Bank of England (BoE) will announce their decisions on monetary policy next week. Most rate decisions are widely anticipated, with the focus on what 2025 may bring to monetary policy.
Technically, the XAU/USD pair is at risk of extending its slide, albeit far from bearish. The daily chart shows that the pair keeps developing above all its moving averages, with the 20 Simple Moving Average (SMA) maintaining its upward slope below the current level and above also bullish 100 and 200 SMAs. However, technical indicators have turned south, with the Momentum heading firmly south below its 100 level and the RSI also pointing lower, albeit at around 54.
In the near term, and according to the 4-hour chart, XAU/USD is currently developing below its 20 SMA, which anyway remains above directionless longer ones. The corrective decline could continue, given that technical indicators head firmly lower, although considering the Momentum indicator remains above its 100 line.
Support levels: 2,676.30 2,662.50 2,650.40
Resistance levels: 2,693.70 2,704.35 2,722.60
EUR/USD steadies above 1.05 after 4-days of losses, amid USD weakness and ahead of the ECB rate decision.
We expect the ECB to cut rates by 25 basis points, bringing them to 3%; however, a 50-basis-point cut cannot entirely be excluded. In fact, the market would likely focus more on communication. The updated staff forecast could see the inflation target being reached sooner next year, which could enable the ECB to cut rates by 25 basis points but with a more dovish tone.
Recent data, including the composite PMI at a 10-month low and political uncertainty in Germany and France affecting economic sentiment, also give the ECB reason to adopt a more dovish stance.
The market is pricing in 150 basis points worth of cuts between now and the end of next year. A dovish-sounding Christine Lagarde could fuel rate-cut bets, pulling EUR lower.
The USD is easing but continues to trade in a narrow range, following US CPI data yesterday, which supports the view the Fed will cut rates next week and ahead of PPI data today.
PPI is expected to rise to 2.6%, YoY up from 2.4%. This comes after CPI rose to 2.7% from 2.6%.
Signs that disinflation is stalling underpin the USD. While a December rate cut looks certain, a more gradual pace of cuts is likely next year.
EUR/USD fell from 1.12 in late September to a low of 1.0330 on November 2025. The price is currently consolidating between 1.05 to 1.06 and is once again testing the lower band of this holding pattern.
Sellers must take out 1.05 to extend the longer-term bearish trend towards 1.04 and 1.0330.
However, should 1.05 hold, buyers will look to extend the gain to 1.06. Beyond here, 1.07 comes into play.

GBP/USD continues to trade in a tight range around the 1.2750 level following US CPI data and ahead of more US stats. The UK economic calendar is quiet, leaving the USD in the driving seat.
US CPI rose to 2.2%, up from 2.6%, in line with expectations, while core CPI held steady at 3.3%. Despite the increase in inflation, the data was in line with forecasts, giving the green light to a December rate cut.
According to the CME Fed watch tool, the market is pricing in a 95% chance of a 25 basis point cut at the FOMC meeting next week, up from 85% ahead of the meeting.
Today, attention is on US PPI inflation, which is expected to rise. PPI is forecast to rise to 3.2%, up from the 3.1% previously.
US jobless claims data will also be under the spotlight. It is expected to show the ongoing resilience in the US labour market, with 220K initial claims forecast down from 224 K.
The pound has been supported by expectations that the Bank of England will cut interest rates at a slower pace than its major central bank peers. The BoE is expected to leave rates unchanged in the meeting next week, and the market is only pricing in 60 basis points worth of cuts between now and the end of next year.
The central bank has adopted a more hawkish tone following the New Labour government’s budget, which is seen as inflationary.
There is no high impact UK economic data today. Attention will be on GDP figures tomorrow.
GBP/USD extended its recovery from 1.25 rising out of the multi-month descending channel, but the recovery has stopped short below the 200 SMA.
Buyers will look to extend the recovery above the 200 SMA1.2825 towards 1.2875 static resistance and 50 SMA. A rise above her brings 1.29 and then the key 1.30 level into play.
Failure to retake the 200 SMA could see sellers retest the 1.27, the weekly low ahead of 1.2630 the December low and 1.26. A breakdown here brings 1.25 into focus.