The main category of Forex News.
You can use the search box below to find what you need.
[wd_asp id=1]
The main category of Forex News.
You can use the search box below to find what you need.
[wd_asp id=1]
Spot Gold came under selling pressure on Thursday, trading around $2,680 a troy ounce. The US Dollar (USD) gathered momentum early in the American session following the release of dismal United States (US) data.
The country reported that Initial Jobless Claims for the week ended December 6 increased to 242K, worse than the 220K expected and above the previous 225K. Additionally, the November Producer Price Index (PPI) came in higher than anticipated, rising 3.4% on a yearly basis against the expected 3.2% and the previous 3.1%. The news pushed speculative interest into further betting on Federal Reserve (Fed) interest rate cuts through 2025.
Wall Street started the day with modest optimism but finally gave up. The three major indexes trade in the red, reflecting the poor sentiment. For a change, however, the USD has gathered more attention than gold as a safe haven.
Market players are now heading into a more quiet day, as the macroeconomic calendar has nothing relevant to offer on Friday. However, the Bank of Japan (BoJ), the Federal Reserve (Fed) and the Bank of England (BoE) will announce their decisions on monetary policy next week. Most rate decisions are widely anticipated, with the focus on what 2025 may bring to monetary policy.
Technically, the XAU/USD pair is at risk of extending its slide, albeit far from bearish. The daily chart shows that the pair keeps developing above all its moving averages, with the 20 Simple Moving Average (SMA) maintaining its upward slope below the current level and above also bullish 100 and 200 SMAs. However, technical indicators have turned south, with the Momentum heading firmly south below its 100 level and the RSI also pointing lower, albeit at around 54.
In the near term, and according to the 4-hour chart, XAU/USD is currently developing below its 20 SMA, which anyway remains above directionless longer ones. The corrective decline could continue, given that technical indicators head firmly lower, although considering the Momentum indicator remains above its 100 line.
Support levels: 2,676.30 2,662.50 2,650.40
Resistance levels: 2,693.70 2,704.35 2,722.60
EUR/USD steadies above 1.05 after 4-days of losses, amid USD weakness and ahead of the ECB rate decision.
We expect the ECB to cut rates by 25 basis points, bringing them to 3%; however, a 50-basis-point cut cannot entirely be excluded. In fact, the market would likely focus more on communication. The updated staff forecast could see the inflation target being reached sooner next year, which could enable the ECB to cut rates by 25 basis points but with a more dovish tone.
Recent data, including the composite PMI at a 10-month low and political uncertainty in Germany and France affecting economic sentiment, also give the ECB reason to adopt a more dovish stance.
The market is pricing in 150 basis points worth of cuts between now and the end of next year. A dovish-sounding Christine Lagarde could fuel rate-cut bets, pulling EUR lower.
The USD is easing but continues to trade in a narrow range, following US CPI data yesterday, which supports the view the Fed will cut rates next week and ahead of PPI data today.
PPI is expected to rise to 2.6%, YoY up from 2.4%. This comes after CPI rose to 2.7% from 2.6%.
Signs that disinflation is stalling underpin the USD. While a December rate cut looks certain, a more gradual pace of cuts is likely next year.
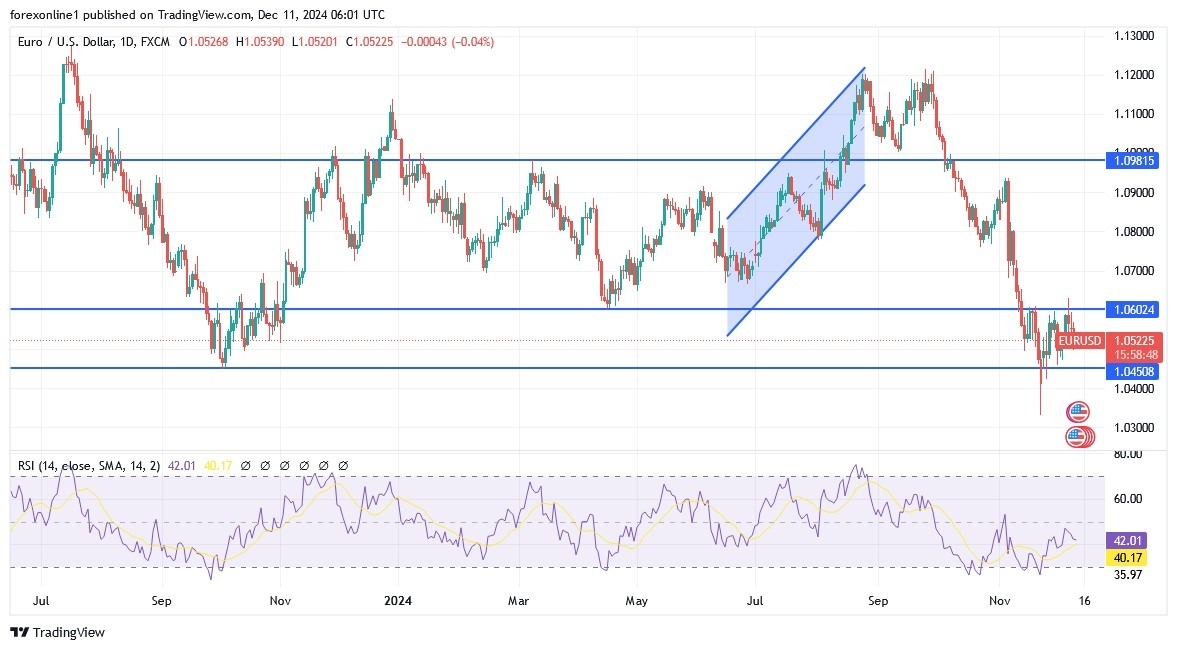
EUR/USD fell from 1.12 in late September to a low of 1.0330 on November 2025. The price is currently consolidating between 1.05 to 1.06 and is once again testing the lower band of this holding pattern.
Sellers must take out 1.05 to extend the longer-term bearish trend towards 1.04 and 1.0330.
However, should 1.05 hold, buyers will look to extend the gain to 1.06. Beyond here, 1.07 comes into play.

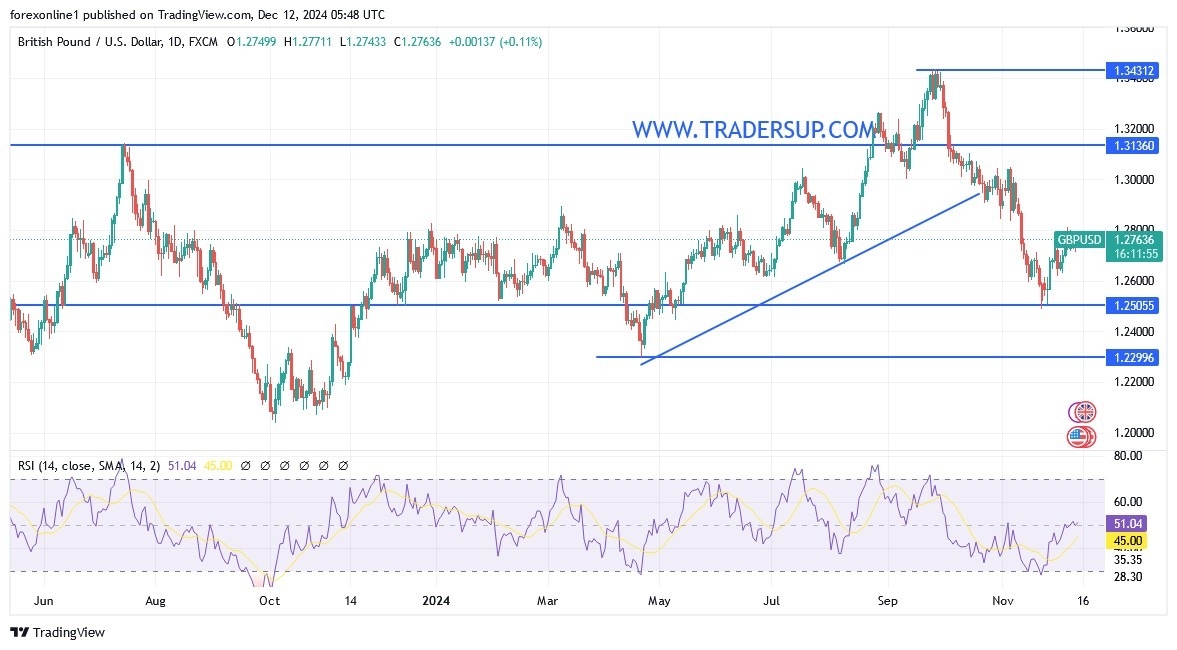
GBP/USD continues to trade in a tight range around the 1.2750 level following US CPI data and ahead of more US stats. The UK economic calendar is quiet, leaving the USD in the driving seat.
US CPI rose to 2.2%, up from 2.6%, in line with expectations, while core CPI held steady at 3.3%. Despite the increase in inflation, the data was in line with forecasts, giving the green light to a December rate cut.
According to the CME Fed watch tool, the market is pricing in a 95% chance of a 25 basis point cut at the FOMC meeting next week, up from 85% ahead of the meeting.
Today, attention is on US PPI inflation, which is expected to rise. PPI is forecast to rise to 3.2%, up from the 3.1% previously.
US jobless claims data will also be under the spotlight. It is expected to show the ongoing resilience in the US labour market, with 220K initial claims forecast down from 224 K.
The pound has been supported by expectations that the Bank of England will cut interest rates at a slower pace than its major central bank peers. The BoE is expected to leave rates unchanged in the meeting next week, and the market is only pricing in 60 basis points worth of cuts between now and the end of next year.
The central bank has adopted a more hawkish tone following the New Labour government’s budget, which is seen as inflationary.
There is no high impact UK economic data today. Attention will be on GDP figures tomorrow.
GBP/USD extended its recovery from 1.25 rising out of the multi-month descending channel, but the recovery has stopped short below the 200 SMA.
Buyers will look to extend the recovery above the 200 SMA1.2825 towards 1.2875 static resistance and 50 SMA. A rise above her brings 1.29 and then the key 1.30 level into play.
Failure to retake the 200 SMA could see sellers retest the 1.27, the weekly low ahead of 1.2630 the December low and 1.26. A breakdown here brings 1.25 into focus.

Silver price (XAG/USD) gives up its entire gains and declines to near $31.50 in the North American session on Thursday. The white metal declines after posting a fresh two-week high around $32.20. The asset faces pressure after the conclusion of China’s two-day economic work conference. a high-level meeting that sets economic priorities for next year.
Top leaders of China didn’t provide specific details on the likely size of the stimulus package and the pace of monetary policy easing. However, officials said that they will increase the issuance of ultra-long special treasury bonds and local government special notes next year, which are important sources for infrastructure investment and other public spending, Bloomberg reported.
Investors await more details on the stimulus package to forecast the demand for Silver, given its application in various industries such as solar panels and mining, etc.
Meanwhile, hotter-than-expected United States (US) Producer Price Index (PPI) data for November has also weighed on the Silver price. As measured by the PPI, annual headline and core producer inflation accelerated to 3% and 3.4%, respectively. The impact of the hit US PPI data appears to be negligible on Federal Reserve (Fed) interest rate projections for the policy meeting on December 18 but could boost expectations that the central bank will pause the policy-easing spell in January.
After the US PPI data release, the US Dollar Index (DXY) recovered intraday losses and rises to near 106.80 and weighed on the Silver price.
Silver price retreats after failing to revisit the horizontal resistance plotted from the May 21 high of $32.50. The near-term appeal of the Silver price remains firm until it stays above the 20-day Exponential Moving Average (EMA), which trades around $31.25.
The 14-day Relative Strength Index (RSI) approaches 60.00. A bullish momentum would trigger a decisive break above the same.
Looking down, the upward-sloping trendline is around $29.50, which is plotted from the February 29 low of $22.30 on a daily timeframe
Silver is a precious metal highly traded among investors. It has been historically used as a store of value and a medium of exchange. Although less popular than Gold, traders may turn to Silver to diversify their investment portfolio, for its intrinsic value or as a potential hedge during high-inflation periods. Investors can buy physical Silver, in coins or in bars, or trade it through vehicles such as Exchange Traded Funds, which track its price on international markets.
Silver prices can move due to a wide range of factors. Geopolitical instability or fears of a deep recession can make Silver price escalate due to its safe-haven status, although to a lesser extent than Gold’s. As a yieldless asset, Silver tends to rise with lower interest rates. Its moves also depend on how the US Dollar (USD) behaves as the asset is priced in dollars (XAG/USD). A strong Dollar tends to keep the price of Silver at bay, whereas a weaker Dollar is likely to propel prices up. Other factors such as investment demand, mining supply – Silver is much more abundant than Gold – and recycling rates can also affect prices.
Silver is widely used in industry, particularly in sectors such as electronics or solar energy, as it has one of the highest electric conductivity of all metals – more than Copper and Gold. A surge in demand can increase prices, while a decline tends to lower them. Dynamics in the US, Chinese and Indian economies can also contribute to price swings: for the US and particularly China, their big industrial sectors use Silver in various processes; in India, consumers’ demand for the precious metal for jewellery also plays a key role in setting prices.
Silver prices tend to follow Gold’s moves. When Gold prices rise, Silver typically follows suit, as their status as safe-haven assets is similar. The Gold/Silver ratio, which shows the number of ounces of Silver needed to equal the value of one ounce of Gold, may help to determine the relative valuation between both metals. Some investors may consider a high ratio as an indicator that Silver is undervalued, or Gold is overvalued. On the contrary, a low ratio might suggest that Gold is undervalued relative to Silver.
As a currency that has become more sensitive to risk, the Pound Sterling benefited from the optimistic market sentiment at the beginning of the week. However, with little other support, the Pound Sterling’s gains were relatively modest, with the Pound Sterling primarily rising against safer currencies rather than its riskier counterparts.
According to licensed trading platforms, the US dollar has retreated from its previous highs after US inflation rates came in line with expectations. According to economic data results, the US Consumer Price Index rose to 2.7% in November, as expected, but this was higher than 2.6% in October, marking the fifth consecutive increase.
It was also announced that the US Consumer Price Index rose by 0.3% on a monthly basis, which is also in line with expectations. The core Consumer Price Index recorded 0.31% in November, with the 12-month rate remaining at 3.3%, which is in line with analysts’ forecasts. Overall, the main conclusions are that US inflation is proving to be stubborn, which will limit the pace of the Federal Reserve’s interest rate cuts in 2025. However, the Federal Reserve is likely to cut interest rates again next week as the numbers were in line with expectations.

China’s stimulus measures this week have supported risk appetite and expectations of further cuts in Chinese interest rates. There were reports that the Politburo had changed its 2025 forecast for China’s monetary policy from cautious to appropriately loose. This would be the first official change in language since 2010. As a result, hopes for political stimulus have supported commodities and British stocks, which in turn helped support the Pound Sterling. However, there are still significant geopolitical pressures and uncertainties.
After financial markets and investors reacted to the US jobs and inflation announcements, financial markets are expecting another US interest rate cut by the Federal Reserve next week, with markets pricing in a near 90% chance of a 25bp cut. The US Federal Reserve will generally enter a blackout period this week, but there will be increased focus on the 2025 outlook. President-elect Trump has recently indicated that he will not ask Fed Chairman Powell to resign, although there is an element of ambiguity as he has stated that Powell may resign if asked. As such, uncertainty may limit the scope for buying the US dollar.
It seems clear that the performance of the British pound is waiting for more stimulus so that it does not get sold and lose its recent gains, as the sterling is a risk currency
According to the performance on the daily chart, the GBP/USD pair remains in a neutral position with an upward bias. The bulls’ success in moving towards the resistance levels of 1.2840 and the psychological resistance of 1.3000 will strengthen the upward trend. Conversely, and on the same time frame, a return to the vicinity of the 1.2610 support will undermine the current upward outlook. The Relative Strength Index is in a neutral position, confirming the balance between bears and bulls. Technically, the MACD is turning upwards but still needs more gains to confirm. Today, GBP/USD will be affected by the announcement of weekly US jobless claims and the reading of the Producer Price Index. Furthermore, this is in addition to the extent of investor risk appetite.
Ready to trade our Forex GBP/USD analysis and predictions? Here are the top UK forex trading platforms to choose from.
Silver (XAG/USD) trades with a positive bias above the $32.00 mark during the Asian session on Thursday and remains close to over a one-month high touched earlier this week. Moreover, the technical setup suggests that the path of least resistance for the white metal remains to the upside.
This week’s sustained move beyond the 200-period Simple Moving Average (SMA) on the 4-hour chart was seen as a key trigger for bullish traders. Moreover, the recent move-up witnessed over the past two weeks or so has been along an upward-sloping channel. Apart from this, positive technical indicators on daily/hourly charts validate the near-term positive outlook for the XAU/USD and support prospects for additional gains.
Hence, a subsequent move up towards retesting the monthly swing high, around the $32.55-$32.60 area, which now coincides with the top boundary of the aforementioned channel, looks like a distinct possibility. Some follow-through buying will confirm a fresh breakout and lift the XAG/USD to the next relevant hurdle near the $32.80-$32.85 region en route to the $33.00 round figure mark and the $33.20-$33.25 horizontal resistance.
On the flip side, weakness below the $32.00-$31.90 area now seems to find some support near the $31.60 horizontal zone ahead of the $31.45-$31.40 confluence. The latter comprises the 200-period SMA on the 4-hour chart and the ascending channel support, which if broken decisively might prompt aggressive selling and shift the bias in favor of bearish traders. The XAG/USD might then drop to sub-$31.00 levels en route to mid-$30.00s.
Silver is a precious metal highly traded among investors. It has been historically used as a store of value and a medium of exchange. Although less popular than Gold, traders may turn to Silver to diversify their investment portfolio, for its intrinsic value or as a potential hedge during high-inflation periods. Investors can buy physical Silver, in coins or in bars, or trade it through vehicles such as Exchange Traded Funds, which track its price on international markets.
Silver prices can move due to a wide range of factors. Geopolitical instability or fears of a deep recession can make Silver price escalate due to its safe-haven status, although to a lesser extent than Gold’s. As a yieldless asset, Silver tends to rise with lower interest rates. Its moves also depend on how the US Dollar (USD) behaves as the asset is priced in dollars (XAG/USD). A strong Dollar tends to keep the price of Silver at bay, whereas a weaker Dollar is likely to propel prices up. Other factors such as investment demand, mining supply – Silver is much more abundant than Gold – and recycling rates can also affect prices.
Silver is widely used in industry, particularly in sectors such as electronics or solar energy, as it has one of the highest electric conductivity of all metals – more than Copper and Gold. A surge in demand can increase prices, while a decline tends to lower them. Dynamics in the US, Chinese and Indian economies can also contribute to price swings: for the US and particularly China, their big industrial sectors use Silver in various processes; in India, consumers’ demand for the precious metal for jewellery also plays a key role in setting prices.
Silver prices tend to follow Gold’s moves. When Gold prices rise, Silver typically follows suit, as their status as safe-haven assets is similar. The Gold/Silver ratio, which shows the number of ounces of Silver needed to equal the value of one ounce of Gold, may help to determine the relative valuation between both metals. Some investors may consider a high ratio as an indicator that Silver is undervalued, or Gold is overvalued. On the contrary, a low ratio might suggest that Gold is undervalued relative to Silver.
Image © Adobe Images
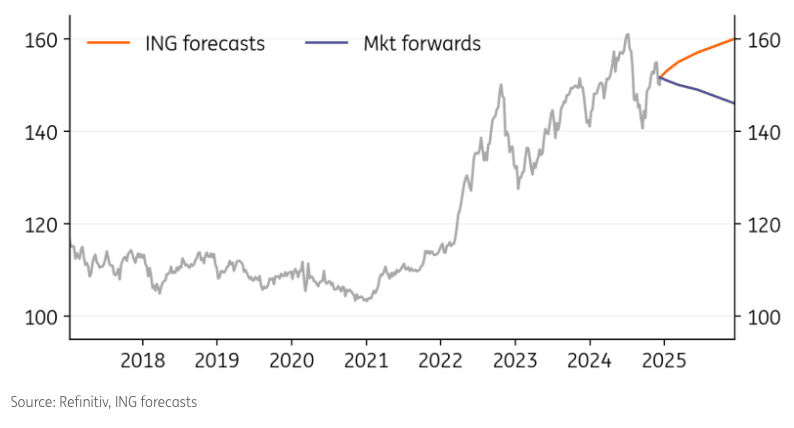
The Japanese Yen might not see a strong 2025 after all.
Analysts at ING Bank see a route to 160 in Dollar-Yen (USD/JPY) over the next year, disappointing a consensus looking for Yen outperformance.
Currently, market forward points show the market looks for USD/JPY to move towards the mid-140s next year, in a steady trend of Yen appreciation.
Part of this assumption rests on the view that the Bank of Japan will raise interest rates in a world where everyone else is cutting, creating a favourable interest rate convergence story for JPY.
ING’s economists maintain that the Bank of Japan will hike by 25bp on 20 December, and further hikes will follow, but these won’t put a rocket under the Yen as was seen earlier this year when the Bank raised rates for the first time in years.
“Recall that it was the hawkish hike in July that prompted the disorderly unwind of the carry trade. This time, however, the market is not as short yen as it was in July and the BoJ has probably learned its communication lesson. We do, however, look for two further 25bp rate hikes next year,” says ING.

Bank of Japan hikes won’t be able to close the gap with U.S. yields, which will remain elevated as the Trump 2.0 era commences.
“Our forecast profile of a higher USD/JPY is largely down to the fact that we expect the US 10yr Treasury to end 2025 at 5.50%. There is some talk of a ‘Mar-a-Lago accord’ to weaken the US dollar. We think Trump’s policies are dollar positive, but if Washington’s dollar policy were to make an impact, especially if US growth disappoints, we suspect USD/JPY would lead $ lower,” says ING.
The bank forecasts USD/JPY at 153 in one month, 155 in three months, 157 in six months and 160 in 12 months.
Silver price (XAG/USD) surges above $31.50 at the start of the week. The white metal strengthens as financial market participants become increasingly confident that the Federal Reserve (Fed) will cut interest rates by 25 basis points (bps) to 4.25%-4.50% in the policy meeting on December 18.
According to the CME FedWatch tool, the probability for the Fed to cut interest rates by 25 bps to 4.25%-4.50% on December 18 has increased to 87% from 62% a week ago. A scenario that historically weighs on the US Dollar (USD) and bond yields but is favorable for non-yielding assets, such as Silver, given that lower yields result in lower opportunity cost for holding an investment in them.
The US Dollar Index (DXY), which gauges the Greenback’s value against six major currencies, retreats after failing to sustain above the key figure of 106.00. 10-year US Treasury yields tick higher to near 4.16%.
Meanwhile, fresh attempts at a ceasefire between Russia and Ukraine by US President-elect Donald Trump could weigh on the safe-haven demand for Silver. “Zelenskyy and Ukraine would like to make a deal and stop the madness,” Trump wrote on a social media platform. The safe-haven demand for precious metals increases in a heightened geopolitical uncertainty.
This week, investors will focus on the closed-door annual central economic work conference to be held on Dec 11-12, according to Bloomberg. The committee is expected to set priorities for the following year along with scrutinizing current economic performance. The outcome will influence the Silver price, given the application of Silver as a metal in diversified industries.
Silver price rallies to near $31.60 after breaking above the three-day resistance of $31.30. The asset climbs above the 20- and 50-day Exponential Moving Averages (EMAs) near $31.10 and $31.20, respectively, suggesting a strong uptrend.
The 14-day Relative Strength Index (RSI) approaches 60.00. A bullish momentum would trigger a decisive break above the same.
Looking down, the upward-sloping trendline around $29.50, which is plotted from the February 29 low of $22.30 on a daily timeframe, would act as key support for the Silver price. On the upside, the horizontal resistance plotted from the May 21 high of $32.50 would be the barrier.
Silver is a precious metal highly traded among investors. It has been historically used as a store of value and a medium of exchange. Although less popular than Gold, traders may turn to Silver to diversify their investment portfolio, for its intrinsic value or as a potential hedge during high-inflation periods. Investors can buy physical Silver, in coins or in bars, or trade it through vehicles such as Exchange Traded Funds, which track its price on international markets.
Silver prices can move due to a wide range of factors. Geopolitical instability or fears of a deep recession can make Silver price escalate due to its safe-haven status, although to a lesser extent than Gold’s. As a yieldless asset, Silver tends to rise with lower interest rates. Its moves also depend on how the US Dollar (USD) behaves as the asset is priced in dollars (XAG/USD). A strong Dollar tends to keep the price of Silver at bay, whereas a weaker Dollar is likely to propel prices up. Other factors such as investment demand, mining supply – Silver is much more abundant than Gold – and recycling rates can also affect prices.
Silver is widely used in industry, particularly in sectors such as electronics or solar energy, as it has one of the highest electric conductivity of all metals – more than Copper and Gold. A surge in demand can increase prices, while a decline tends to lower them. Dynamics in the US, Chinese and Indian economies can also contribute to price swings: for the US and particularly China, their big industrial sectors use Silver in various processes; in India, consumers’ demand for the precious metal for jewellery also plays a key role in setting prices.
Silver prices tend to follow Gold’s moves. When Gold prices rise, Silver typically follows suit, as their status as safe-haven assets is similar. The Gold/Silver ratio, which shows the number of ounces of Silver needed to equal the value of one ounce of Gold, may help to determine the relative valuation between both metals. Some investors may consider a high ratio as an indicator that Silver is undervalued, or Gold is overvalued. On the contrary, a low ratio might suggest that Gold is undervalued relative to Silver.
EUR/USD steadies above 1.05 after 4-days of losses, amid USD weakness and ahead of the ECB rate decision.
We expect the ECB to cut rates by 25 basis points, bringing them to 3%; however, a 50-basis-point cut cannot entirely be excluded. In fact, the market would likely focus more on communication. The updated staff forecast could see the inflation target being reached sooner next year, which could enable the ECB to cut rates by 25 basis points but with a more dovish tone.
Recent data, including the composite PMI at a 10-month low and political uncertainty in Germany and France affecting economic sentiment, also give the ECB reason to adopt a more dovish stance.
The market is pricing in 150 basis points worth of cuts between now and the end of next year. A dovish-sounding Christine Lagarde could fuel rate-cut bets, pulling EUR lower.
The USD is easing but continues to trade in a narrow range, following US CPI data yesterday, which supports the view the Fed will cut rates next week and ahead of PPI data today.
PPI is expected to rise to 2.6%, YoY up from 2.4%. This comes after CPI rose to 2.7% from 2.6%.
Signs that disinflation is stalling underpin the USD. While a December rate cut looks certain, a more gradual pace of cuts is likely next year.
EUR/USD fell from 1.12 in late September to a low of 1.0330 on November 2025. The price is currently consolidating between 1.05 to 1.06 and is once again testing the lower band of this holding pattern.
Sellers must take out 1.05 to extend the longer-term bearish trend towards 1.04 and 1.0330.
However, should 1.05 hold, buyers will look to extend the gain to 1.06. Beyond here, 1.07 comes into play.

GBP/USD continues to trade in a tight range around the 1.2750 level following US CPI data and ahead of more US stats. The UK economic calendar is quiet, leaving the USD in the driving seat.
US CPI rose to 2.2%, up from 2.6%, in line with expectations, while core CPI held steady at 3.3%. Despite the increase in inflation, the data was in line with forecasts, giving the green light to a December rate cut.
According to the CME Fed watch tool, the market is pricing in a 95% chance of a 25 basis point cut at the FOMC meeting next week, up from 85% ahead of the meeting.
Today, attention is on US PPI inflation, which is expected to rise. PPI is forecast to rise to 3.2%, up from the 3.1% previously.
US jobless claims data will also be under the spotlight. It is expected to show the ongoing resilience in the US labour market, with 220K initial claims forecast down from 224 K.
The pound has been supported by expectations that the Bank of England will cut interest rates at a slower pace than its major central bank peers. The BoE is expected to leave rates unchanged in the meeting next week, and the market is only pricing in 60 basis points worth of cuts between now and the end of next year.
The central bank has adopted a more hawkish tone following the New Labour government’s budget, which is seen as inflationary.
There is no high impact UK economic data today. Attention will be on GDP figures tomorrow.
GBP/USD extended its recovery from 1.25 rising out of the multi-month descending channel, but the recovery has stopped short below the 200 SMA.
Buyers will look to extend the recovery above the 200 SMA1.2825 towards 1.2875 static resistance and 50 SMA. A rise above her brings 1.29 and then the key 1.30 level into play.
Failure to retake the 200 SMA could see sellers retest the 1.27, the weekly low ahead of 1.2630 the December low and 1.26. A breakdown here brings 1.25 into focus.

GBP/USD registered small losses on Wednesday but didn’t have a difficult time holding its ground. The pair trades modestly higher on the day above 1.2750 on Thursday and the technical outlook suggests that the bullish bias remains intact in the near term.
The table below shows the percentage change of British Pound (GBP) against listed major currencies this week. British Pound was the strongest against the Japanese Yen.
| USD | EUR | GBP | JPY | CAD | AUD | NZD | CHF | |
|---|---|---|---|---|---|---|---|---|
| USD | 0.51% | -0.17% | 1.80% | -0.04% | -0.35% | 0.62% | 0.50% | |
| EUR | -0.51% | -0.67% | 1.40% | -0.47% | -0.77% | 0.19% | 0.07% | |
| GBP | 0.17% | 0.67% | 1.91% | 0.20% | -0.11% | 0.87% | 0.74% | |
| JPY | -1.80% | -1.40% | -1.91% | -1.84% | -2.03% | -1.28% | -1.20% | |
| CAD | 0.04% | 0.47% | -0.20% | 1.84% | -0.25% | 0.67% | 0.54% | |
| AUD | 0.35% | 0.77% | 0.11% | 2.03% | 0.25% | 0.98% | 0.85% | |
| NZD | -0.62% | -0.19% | -0.87% | 1.28% | -0.67% | -0.98% | -0.14% | |
| CHF | -0.50% | -0.07% | -0.74% | 1.20% | -0.54% | -0.85% | 0.14% |
The heat map shows percentage changes of major currencies against each other. The base currency is picked from the left column, while the quote currency is picked from the top row. For example, if you pick the British Pound from the left column and move along the horizontal line to the US Dollar, the percentage change displayed in the box will represent GBP (base)/USD (quote).
The US Dollar outperformed its major rivals midweek following the inflation report. The Bureau of Labor Statistics (BLS) reported that the Consumer Price Index (CPI) and the core CPI both increased by 0.3% on a monthly basis, matching market forecasts.
Later in the day, the BLS will publish the Producer Price Index (PPI) data for November and the US Department of Labor will release the weekly Initial Jobless Claims figures. Markets expect the number of first-time applications for unemployment benefits to decline to 220,000 from 224,000. In case this data arrives above 230,000, the USD could come under pressure and help GBP/USD push higher.
Meanwhile, US stock index futures were last seen losing between 0.2% and 0.3%. A bearish opening in Wall Street could cap GBP/USD’s upside in the early American session.
Investors will also pay close attention to the European Central Bank’s (ECB) policy announcements. A dovish ECB surprise, be it a 50 basis points (bps) rate cut, or a 25 bps cut with a dovish policy statement, could trigger a Euro selloff. In this scenario, Pound Sterling could capture capital outflows out of the Euro and stay resilient against the USD.
In case GBP/USD continues to trade above 1.2750-1.2760 area, where the Fibonacci 50% retracement of the latest downtrend and the 200-period Simple Moving Average (SMA) are located, it could meet the next resistance at 1.2800 (Fibonacci 61.8% retracement) before targeting 1.2850 (static level).
On the downside, immediate support aligns at 1.2730 (50-period SMA) ahead of 1.2700 (Fibonacci 38.2% retracement) and 1.2670 (100-period SMA).
The Pound Sterling (GBP) is the oldest currency in the world (886 AD) and the official currency of the United Kingdom. It is the fourth most traded unit for foreign exchange (FX) in the world, accounting for 12% of all transactions, averaging $630 billion a day, according to 2022 data. Its key trading pairs are GBP/USD, also known as ‘Cable’, which accounts for 11% of FX, GBP/JPY, or the ‘Dragon’ as it is known by traders (3%), and EUR/GBP (2%). The Pound Sterling is issued by the Bank of England (BoE).
The single most important factor influencing the value of the Pound Sterling is monetary policy decided by the Bank of England. The BoE bases its decisions on whether it has achieved its primary goal of “price stability” – a steady inflation rate of around 2%. Its primary tool for achieving this is the adjustment of interest rates. When inflation is too high, the BoE will try to rein it in by raising interest rates, making it more expensive for people and businesses to access credit. This is generally positive for GBP, as higher interest rates make the UK a more attractive place for global investors to park their money. When inflation falls too low it is a sign economic growth is slowing. In this scenario, the BoE will consider lowering interest rates to cheapen credit so businesses will borrow more to invest in growth-generating projects.
Data releases gauge the health of the economy and can impact the value of the Pound Sterling. Indicators such as GDP, Manufacturing and Services PMIs, and employment can all influence the direction of the GBP. A strong economy is good for Sterling. Not only does it attract more foreign investment but it may encourage the BoE to put up interest rates, which will directly strengthen GBP. Otherwise, if economic data is weak, the Pound Sterling is likely to fall.
Another significant data release for the Pound Sterling is the Trade Balance. This indicator measures the difference between what a country earns from its exports and what it spends on imports over a given period. If a country produces highly sought-after exports, its currency will benefit purely from the extra demand created from foreign buyers seeking to purchase these goods. Therefore, a positive net Trade Balance strengthens a currency and vice versa for a negative balance.
The most important data in today’s economic calendar. The announcement of the US consumer price index readings, and the index is expected to rise for the fourth consecutive month. The core CPI reading – without food and energy prices – is expected to record 0.3 percent. With the announcement of consumer prices and the announcement of US producer prices later this week, the complete picture of what the US Federal Reserve’s decision will be next week is formed, and the comparison between them and the numbers that will occur under Trump’s official leadership of the US economy during the year 2025. As is known, Trump’s hostile trade policy supports the rise in inflation rates, which may affect the path of the US Federal Reserve’s policy in the coming months, as a result of which I expect the bank to stop the path of reducing US interest rates.
According to an official announcement, the annual inflation rate in Germany rose to 2.2% in November 2024, up from 2% in October, in line with initial estimates, and the announcement represents the highest level in four months. According to the announcement, service inflation remained unchanged at 4%, while energy costs declined at a slower pace (-3.7% versus -5.5% in October). At the same time, food inflation slowed to 1.8%, compared to 2.3% in the previous period. On a monthly basis, German consumer prices fell by 0.2%, in line with initial estimates, following a 0.4% increase in October.
Core inflation, which excludes volatile food and energy prices, reached a six-month high of 3% in November. The harmonized inflation rate for the European Union remained at 2.4% annually, confirming the initial estimates. Harmonized consumer prices fell by 0.7% monthly, in line with preliminary data, reversing a 0.4% increase from the previous month.
According to stock trading company platforms, European stock market indices halted a recent upward wave, and according to trades, the Stoxx 50 index declined by 0.7% and the Stoxx 600 index fell by 0.5%, led by a 1.1% decline in industrial stocks. Weaker-than-expected Chinese import and export data affected mining stocks, which fell by 0.8%, and at the same time, investors are cautiously awaiting the announcement of US inflation figures today.
The euro-dollar price will remain on a downward path, whatever the US inflation figures today. Cautiously, eyes are turning with the European Central Bank announcement, and selling the euro-dollar is still in place.
My technical view of the EUR/USD pair performance has not changed. The overall trend is still downward, and the movement around and below the psychological support level of 1.0500 still supports the bears’ strong control over the trend. Regarding the performance of technical indicators, the RSI is still heading downward, and at the same time, the MACD is strongly bearish, confirming the bears’ opportunity to move towards deeper support levels, the closest of which is currently 1.0435 and 1.0300, which in turn will move the technical indicators towards strong oversold levels and increase expectations towards the future of the Euro-Dollar’s equilibrium price.
On the other hand, and on the same time frame, the daily chart will not witness an initial break of the downtrend without moving towards the resistance levels of 1.0680 and 1.0800 respectively.
Ready to trade our daily EUR/USD Forex analysis? We’ve made a list of the best forex demo accounts worth trading with.