The main category of Forex News.
You can use the search box below to find what you need.
[wd_asp id=1]
The main category of Forex News.
You can use the search box below to find what you need.
[wd_asp id=1]
EUR/USD is rising despite the collapse of the French government. French lawmakers passed a no-confidence vote against PM Michel Barnier on Wednesday evening, throwing the country into more political uncertainty and a deeper crisis.
However, both the euro and the French CAC managed to move higher because the collapse of the French government was already priced in. Furthermore, contagion outside of French markets is fairly limited. The risk premium on holding French debt over German debt has risen to its highest level since 2012.
On the data front, eurozone retail sales were weaker than expected, falling -0.5% MoM in October after falling -0.3% in September. The data comes after weak PMI data yesterday showed the eurozone composite PMI fell to a 10-month low.
The ECB is expected to cut interest rates by 25 basis points next week, and the markets are also pricing in around 157 basis points worth of easing by the end of next year, significantly more than the level of easing expected from the Federal Reserve.
The US dollar is trading slightly lower versus its major peers after Federal Reserve chair Jerome Powell’s speech yesterday, where he continued support for a slower pace of rate reductions ahead but did nothing to deter from expectations of a December cut.
Attention now turns to US initial jobless claims and comments from fed Barkin.
After recovering from a low of 1.0330 EUR/USD is consolidating between 1.06 and 1.0450. To extend the bearish trend that has been in place since the end of September, sellers will look to break below 1.0450 to test 1.04 and 1.0330.
Meanwhile, a rise above 1.06 creates a higher high and support the pair towards 1.07
USD/JPY resumed its downtrend after rising in the previous session. It is strengthening as traders assess whether the BoJ will hike interest rates again later this month. Known dove policy maker Nakamura said he wasn’t opposed to rate hikes, which has helped to strengthen the currency.
BoJ will announce its rate decision on December 19th, and expectations of a hike have been growing following recent comments from Ueda. However, media reports have raised questions over whether the hike will actually happen.
The yen is also benefiting from concerns surrounding South Korea, where the won continues to trade around a 2 year low following a short-lived martial law decree.
The U.S. dollar gained yesterday, but it’s inching lower against its major peers today after Federal Reserve Jerome Powell highlighted the strength of the U.S. economy and signaled support for slower rate reductions. However, a December rate cut is still expected, with the market pricing in a 74% chance of a 25 basis point reduction.
Attention is now on US jobless claims, which come ahead of Friday’s non-farm payroll report. Expectations are for 215k jobs added, up from 213k. Non-farm payrolls are expected to show 200,000 jobs were added in November up from just 12,000 in October.
After falling from a peak of 156.75, USD/JPY fell below the 200 SMA before finding support at the 100 SMA at 148.65. The recovery failed to rise above 150.8, the 0.5% Fib retracement of the 162 high and 139 low.
Sellers supported by the RSI below 50 will look to extend the bearish trend below 148.65 towards 148.15 the 38.2% level and towards 145.00.
Should buyers retake 150.80 a move towards 153.85 and 157.10 could be on the cards.

So, there are conflicting signals coming from the price behavior of natural gas. It remains below the lower rising trend channel line, which is bearish, but has retained an area of previously identified support around the 61.8% retracement. And for the prior few days it managed to close just a little above support at the 20-Day line. Natural gas remains on track to close at or above the 20-Day MA today as well. The 20-Day line is currently at 3.08.
There was a bottom tail on Wednesday and there is currently a bottom tail today. Given that they are occurring in a support zone, it shows bullish behavior as the buyers stepped up following intraday weakness. If natural gas ends today in a similar position a second bullish hammer candlestick pattern will be generated. The first was on Wednesday. In summary, natural gas is holding a support zone that could lead to a rally and possibly an eventual challenge to the recent 3.07 trend high.
If the day ends with a bullish hammer, a rally above today’s high of 3.10 will provide a bullish signal. But natural gas will still be below the lower channel line, and it may continue to act as resistance. Therefore, a bullish reversal will be indicated on a rally above Wednesday’s high of 3.035. Further strength would then be shown on a move above the four-day high at 3.03. It is possible that natural gas could rally yet stay below the trend channel. For the bullish advance to have a better chance of continuing, a daily close will need to eventually be seen above that line.
For a look at all of today’s economic events, check out our economic calendar.
Morgan Stanley expects Brent Crude prices to average $70 per barrel in the second half of 2025, up from a $66-$68 a barrel range expected previously, after OPEC+ delayed the beginning of its production increase and slowed the pace of the output hikes into 2026.
The OPEC+ alliance decided on Thursday to delay the start of the easing of the 2.2 million barrels per day (bpd) cuts to April 2025, from January 2025. The group also extended the period in which it would unwind all these cuts until September 2026.
The delay and the slower ramp-up in OPEC+’s oil production increases mean that the market would see a smaller surplus than expected, Morgan Stanley analysts wrote in a note, as carried by Reuters.
Excluding the three OPEC members exempted from the cuts (Iran, Libya, and Venezuela), the other nine OPEC producers are now expected to pump 400,000 bpd less in 2025, the bank said. It also lowered its projection of the combined output of the nine OPEC producers by 700,000 bpd by the fourth quarter of 2025.
“In aggregate, this reduces our estimated surplus in 2025 from 1.3 to 0.8 million bpd in our total liquids balance, and from 0.7 to 0.3 million bpd in our crude-only balance,” Morgan Stanley said.
Early on Friday, oil prices were on track to book a weekly loss, as prices have been little moved since the OPEC+ decision on Thursday.
The three-month delay to the start of the easing of the production cuts was expected by the market. The slower pace of planned increases in output and kicking the can down the road may reduce the previously expected market surplus, but it is also an indication that OPEC+ is aware that demand isn’t strong enough to absorb the reversal of all the cuts throughout 2025.
By Charles Kennedy for Oilprice.com
All week, traders were waiting for the release of the November jobs report to see whether it will confirm market pricing of a 25 basis point rate cut in December. In short, it may well have. Although wages remained strong and the headline nonfarm payrolls data beat expectations, it was the reports other metrics that caused the dollar to wobble. Traders saw rising unemployment rate, falling participation rate and the weak household survey – with the latter showing a big drop – as reasons to sell the USD/JPY. But with the EUR/USD dropping as well, it wasn’t just a clean dollar reaction you would have expected. The USD/JPY forecast is subject to change greatly in the coming weeks with US CPI due next week followed by FOMC and BoJ decisions the following week.
The non-farm payrolls data was stronger and there were positive revisions to prior two months data, increasing employment by 56K. However, the household survey revealed a big 355K drop, and participation rate fell to a 6-month low of 62.5%. The unemployment rate also ticked higher to 4.2%.
Average earnings came in stronger, rising 0.4% on a month-over-month basis compared to 0.3% expected, keeping the year-over-year rate to 4.0%. This was overshowed however by the mostly negative news from the jobs front.
US inflation data (CPI and PPI) will be released next week, the last set of key data before the Fed meets the following week. CPI will be published on Wednesday, December 11 at 13:30 GMT. Following Trump’s victory in the presidential election race, investors have sharply reduced their expectations about further US interest rate cuts in 2025. The upcoming December rate decision is unlikely to be impacted by this CPI report, unless we see a super-hot print. But whether the Fed will go ahead with a cut at its initial 2025 meetings will be influenced, among other key data highlights, by this CPI report, although it is employment that the Fed is now more focused on.
But after today’s NFP report, a 25-bps rate cut is now more likely than not. Indeed, market pricing of a December rate cut rose to around 87% from 70%, and USD/JPY dipped back to 150.00 handle – will it break lower now?
The EUR/JPY fell along with the USD/JPY, suggesting a broad-based yen rally following the US nonfarm payrolls report. In recent weeks, the yen has strengthened against most major currencies, particularly commodity dollars, the euro, and to a lesser extent, the US dollar. This surge has been driven by investor speculation that the Bank of Japan might raise interest rates at its final meeting of 2024, scheduled for later this month.
However, a couple of days ago comments from BoJ board member Toyoaki Nakamura tempered this momentum. Nakamura struck a dovish tone, urging a cautious approach to policy tightening and raising concerns about the sustainability of wage growth.


Source: TradingView.com
The USD/JPY has again dropped to test the key 149.40-150.00 support zone where it was residing at the time of writing. A close below this zone could potentially pave the way for this week’s earlier of 148.65 and then 146.50 – the next potential support level. A daily close above or within this zone 149.40-150.00 support zone will keep the bulls interested and we may then see a potential recovery towards the 151.20-152.00 resistance range. All told, the odds of a breakdown look the more likely scenario, owing to the drop in bond yields and expectations about a potential BoJ rate hike in two weeks’ time.
— Written by Fawad Razaqzada, Market Analyst
Follow Fawad on Twitter @Trader_F_R
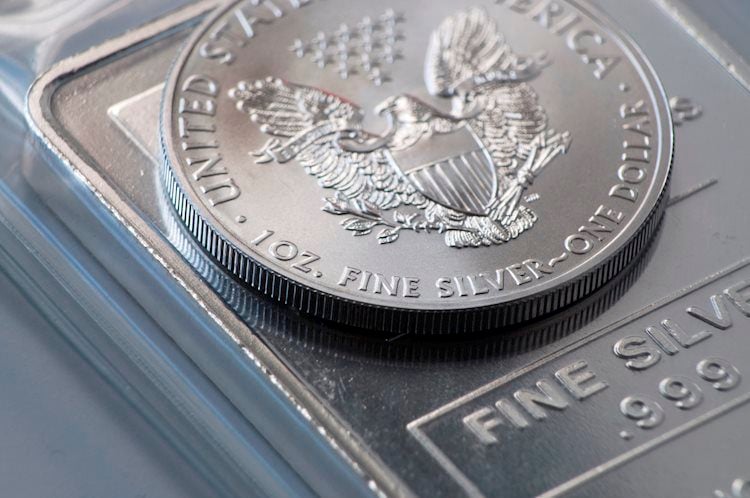
Silver (XAG/USD) rally from last week’s lows near $30.00 has been capped at the top of the last two week’s horizontal channel, at 31.15, with investors awaiting the release of November’s US employment data.
The US economy is expected to have created 200,000 new jobs in the month, while the unemployment rate ticked up to 4.2%. This latter data and softer wage inflation are likely to keep hopes of December rate cuts alive.
On Thursday, the weekly jobless claims showed a larger-than-expected increase in the last week of November. This, coupled with below-consensus ADP employment figures seen on Wednesday, has cast some doubt about the NFP reading and increased pressure on the USD.
The technical picture shows the bullish momentum losing steam, with the 4-hour RSI turning down towards the 50 level and bulls capped below the mentioned $31.45. Above here, the next target is the November, 7 high, at 32.15. Supports are $30.90 and $30.45 (Dec 5 and 4 lows respectively)
Silver is a precious metal highly traded among investors. It has been historically used as a store of value and a medium of exchange. Although less popular than Gold, traders may turn to Silver to diversify their investment portfolio, for its intrinsic value or as a potential hedge during high-inflation periods. Investors can buy physical Silver, in coins or in bars, or trade it through vehicles such as Exchange Traded Funds, which track its price on international markets.
Silver prices can move due to a wide range of factors. Geopolitical instability or fears of a deep recession can make Silver price escalate due to its safe-haven status, although to a lesser extent than Gold’s. As a yieldless asset, Silver tends to rise with lower interest rates. Its moves also depend on how the US Dollar (USD) behaves as the asset is priced in dollars (XAG/USD). A strong Dollar tends to keep the price of Silver at bay, whereas a weaker Dollar is likely to propel prices up. Other factors such as investment demand, mining supply – Silver is much more abundant than Gold – and recycling rates can also affect prices.
Silver is widely used in industry, particularly in sectors such as electronics or solar energy, as it has one of the highest electric conductivity of all metals – more than Copper and Gold. A surge in demand can increase prices, while a decline tends to lower them. Dynamics in the US, Chinese and Indian economies can also contribute to price swings: for the US and particularly China, their big industrial sectors use Silver in various processes; in India, consumers’ demand for the precious metal for jewellery also plays a key role in setting prices.
Silver prices tend to follow Gold’s moves. When Gold prices rise, Silver typically follows suit, as their status as safe-haven assets is similar. The Gold/Silver ratio, which shows the number of ounces of Silver needed to equal the value of one ounce of Gold, may help to determine the relative valuation between both metals. Some investors may consider a high ratio as an indicator that Silver is undervalued, or Gold is overvalued. On the contrary, a low ratio might suggest that Gold is undervalued relative to Silver.
The Pound Sterling (GBP) held on to the corrective upside against the US Dollar (USD), fuelling a brief GBP/USD recovery above the 1.2750 barrier.
Political turbulence in South Korea and France, US President-elect Donald Trump’s tariff threats, and the diverging monetary policy outlooks between the US Federal Reserve (Fed) and the Bank of England (BoE) emerged as the main drivers for the GBP/USD price action.
On Monday, the pair started the week negatively, tumbling over a big figure to hit weekly lows at 1.2617. Since then, Pound Sterling buyers fought back control and resumed the previous week’s recovery to reach the highest level in three weeks above 1.2750.
Trump threatened on Saturday that he would impose 100% tariffs on BRICS nations if they tried to replace the USD with their own. Mounting tariff war fears fuelled risk-aversion across the financial markets, reviving the demand for the Greenback as a safe-haven asset while weighing on risk currencies such as the British Pound.
However, sustained bets for a 25 basis points (bps) Fed interest rate cut in December remained a drag on the US Dollar despite Chairman Jerome Powell’s prudent remarks. Markets price in a 70% chance of such a move later this month, the CME Group’s FedWatch Tool shows, at the press time.
Powell said in his speech at the New York Times’ DealBook Summit, “growth is definitely stronger than we thought, and inflation is coming a little higher. The good news is that we can afford to be a little more cautious as we try to find neutral,” he added, referring to the neutral interest rate.
A series of US economic data releases, including the ISM surveys, JOLTS Job Openings and the ADP Employment Change, came in mixed and failed to alter the market’s expectations of a rate cut this month, limiting the Greenback’s upside attempts.
That said, the USD stayed underpinned by the market’s nervousness amid looming geopolitical and trade war risks and ahead of the all-important US Nonfarm Payrolls data release.
On the other side, the Pound Sterling regained traction, paying little heed to the dovish comments from BoE Governor Andrew Bailey on Wednesday. In a pre-recorded interview with the Financial Times (FT), Bailey said that “he expects four UK rate cuts next year as inflation eases.”
Heading into the weekend, GBP/USD consolidated at multi-week highs, anticipating the key US labor data for a fresh directional impetus.
Following the 36,000 increase recorded in October, the US Bureau of Labor Statistics announced on Friday that Nonfarm Payrolls (NFP) rose by 227,000 in November. This print came in above the market expectation of 200,000 but failed to boost the USD, helping GBP/USD cling to its weekly gains. Other details of the jobs report showed that the Unemployment Rate edged higher to 4.2%, while the annual wage inflation held steady at 4%.
It’s a mediocre week from the point of view of macroeconomic news, with the US Consumer Price Index (CPI) data likely to stand out.
The first two trading days of the week have little to no top-tier economic publications from both sides of the Atlantic until the US inflation report drops on Wednesday.
However, China’s inflation data could stir markets amid mounting concerns about an economic slowdown, impacting risk sentiment and high-beta currencies such as the British Pound.
Thursday will feature the US Producer Price Index (PPI) data, while the UK monthly Gross Domestic Product (GDP) and industrial figures will feature on Friday.
It will be dry in terms of Fedspeak as the Fed enters its ‘blackout period’ on Saturday ahead of the December 17-18 policy meeting.
That said, geopolitical developments and US-Sino trade updates will be closely followed.
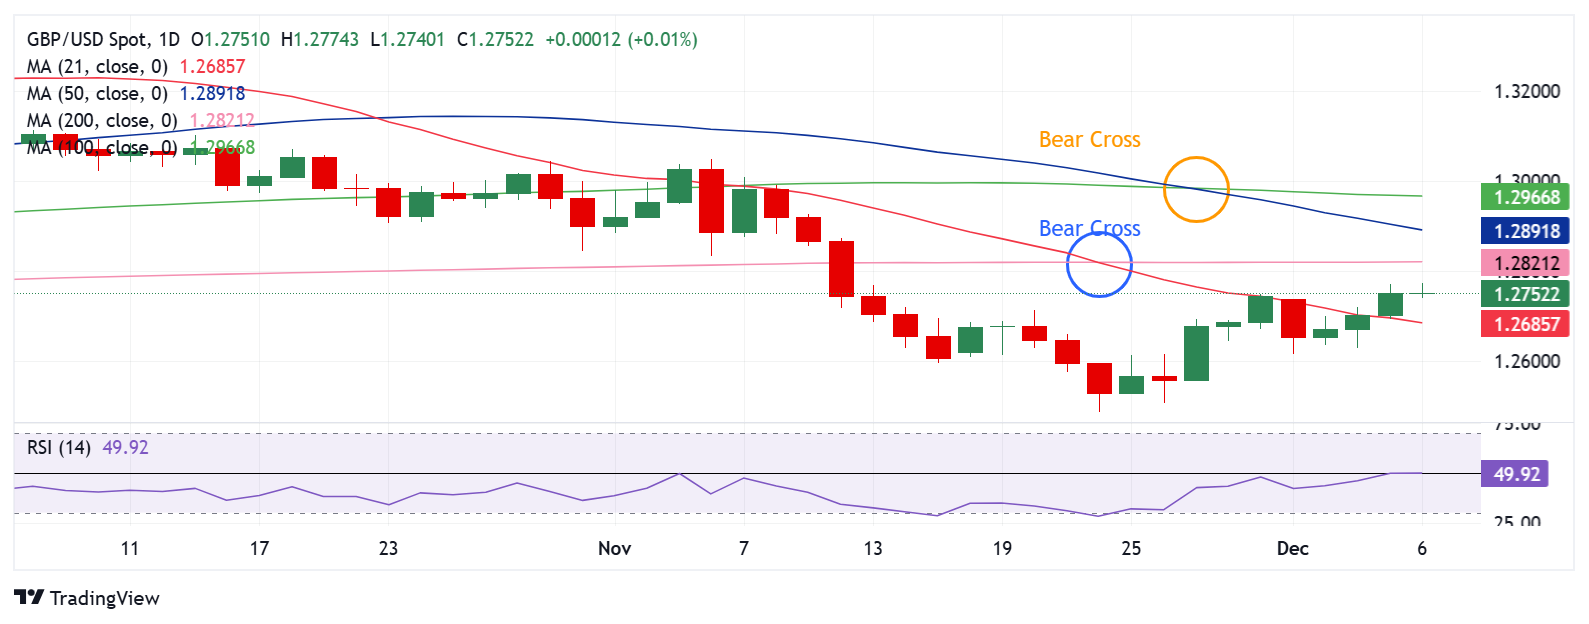
From a short-term technical outlook, sellers will likely retain control if GBP/USD holds below the 200-day Simple Moving Average (SMA) at 1.2821.
Adding credence to the negative outlook, the pair charted dual Bear Crosses a week ago.
However, the 14-day Relative Strength Index (RSI) has recovered to the 50 level from the negative territory, suggesting that the rebound could extend before the next leg down.
The Pound Sterling needs a sustained break above the 200-day SMA at 1.2821 to sustain the recovery.
The next substantial contention area aligns near 1.2900, the confluence of the round figure and the 50-day SMA.
Further up, the 100-day SMA at 1.2967 could challenge the bearish commitments.
On the downside, the immediate support aligns at the 21-day SMA at 1.2685, below which the week low of 1.2617 will be tested.
Additional declines will threaten the six-month low of 1.2488.
Coffee price today, date December 5, 2024 on the market world, at 4:30 am updated on the Vietnam Commodity Exchange MXV (world coffee prices are continuously updated by MXV, matching with world exchanges, the only channel in Vietnam that continuously updates and links with world exchanges).
At the end of the trading session, the price of Robusta coffee on the London floor at 4:30 a.m. on December 5, 2024 increased again, increasing from 144 – 161 USD/ton, fluctuating from 4.423 – 4.779 USD/ton. Specifically, the monthly delivery term January 2025 was 4.770 USD/ton (up 144 USD/ton); the monthly delivery term March 2025 was 4.751 USD/ton (up 147 USD/ton); the monthly delivery term May 2025 was 4.702 USD/ton (up 158 USD/ton) and the monthly delivery term July 2025 was 4.638 USD/ton (up 161 USD/ton).
Similarly, the price of Arabica coffee in New York this morning December 5, 2024 rebounded, with green dominating, increasing by 7.15 – 8.20 cents/lb. Specifically, the monthly delivery term March 2025 was 303.70 cents/lb; the monthly delivery term May 2025 was 301.75 cents/lb; the monthly delivery term July 2025 was 297.25 cents/lb and the monthly delivery term September 2025 was 292.20 cents/lb (down 19.70 cents/lb).
At the end of the trading session, on the morning of December 5, 2024, the price of Brazilian Arabica coffee continued to increase and decrease mixedly across delivery terms, ranging from 358.75 – 383.75 USD/ton. Specifically, the monthly delivery term December 2024 was 377.50 USD/ton; the monthly delivery term March 2025 was 379.50 USD/ton; the monthly delivery term May 2025 was 374.95 USD/ton and the monthly delivery term July 2025 was 368.85 USD/ton.
Domestic coffee prices were updated at 4:30 a.m. on December 5, 2024 as follows: Domestic coffee prices continued to decrease, down about 1.000 VND/kg. Currently, the average purchase price in the Central Highlands provinces is at 108.200 VND/kg.
Specifically, the coffee purchase price in the province Gia Lai at 108.000 VND/kg (down 1.000 VND/kg compared to the previous trading session). Coffee purchasing price in the province Dak Nong at about 108.500 VND/kg.
Price of green coffee beans (coffee beans, fresh coffee beans) in the province Lam Dong In districts such as Bao Loc, Di Linh, Lam Ha, coffee is purchased at 107.000 VND/kg.
Coffee price today (date 5/12) in the province Dak LakIn Cu M’gar district, coffee is purchased at 108.000 VND/kg, and in Ea H’leo district, Buon Ho town, it is purchased at 107.900 VND/kg.
| Coffee price tomorrow December 6, 2024 |
On 5/12, domestic coffee prices increased sharply again in the context of recovering world coffee prices; the weakening of the USD has promoted some short-covering activities in the coffee futures market.
In addition, dry weather in Brazil has caused the market to continue to worry about coffee production in the world’s largest coffee exporting country.
In Vietnam, rains are continuing in some areas of the Central Highlands, disrupting farmers’ coffee harvest. This concern has prompted investors to enter the derivatives market with strong buying power.
Adverse weather not only affects harvesting activities but also causes problems in the logistics chain, leading to the possibility that the supply of new crop coffee from Vietnam to the international market will be lower and slower than usual.
According to experts, coffee prices will continue to fluctuate in the coming time. However, concerns about reduced output in coffee-producing countries due to unfavorable weather; interest rate adjustments by the FED, and the delay in the implementation of the EU Deforestation Regulation (EUDR)… mean that in the long term, coffee prices are likely to stabilize and increase again.
Sources: https://congthuong.vn/du-bao-gia-ca-phe-ngay-mai-6122024-gia-ca-phe-on-dinh-va-tang-tro-lai-362691.html
The Dollar’s pullback below the 108 zone, coupled with rising inflation figures in Japan, is shifting market sentiment. The latest Tokyo Core CPI has risen from 1.8% to 2.2%, boosting expectations for a potential BOJ rate hike on December 19th, just after the anticipated Fed rate cut on December 18th.
Another crucial factor is the “Trump effect” on the US Dollar, which is countering the bearish pressure from priced-in Fed rate cuts as we head into the December holidays. Demand for the US Dollar may increase alongside interest in precious metals, including silver. This dynamic is likely to keep a relatively bullish foundation for both assets unless key support levels are breached.

Source: Tradingview
USDJPY is currently testing key support at 148.60, with the next level to watch at 146.80 in the event of further downside. Deeper declines could retest levels 144 and 140.
The current technical setup, however, leans bullish:
If the 148.60 low holds firm, the next resistance is at 153.30, aligning with the lower boundary of the long-term trendline connecting consecutive lows from January 2023 to 2024. Longer-term resistance levels include 157 and 160, reflecting significant Yen weakness and potential BOJ intervention risks.

Source: Tradingview
Silver is in rebound mode, trading above the $29.80 support, which aligns with the trendline connecting consecutive higher lows over the past year. Resistance remains strong at $31.50.
Key technical indicators signal that the primary uptrend is intact:
While gold has broken below the lower boundary of its primary uptrend following the US presidential election, silver remains resilient. Critical support levels are intact until convincingly breached.
Upside potential: Above $31.50, resistance levels to watch include $32.50, $35, $37, and $40
Downside Potential: Below $29.60, support levels lie at $27.80, $26.80, and $26.00
— Written by Razan Hilal, CMT – on X: @Rh_waves and Forex.com Youtube Channel
Silver (XAG/USD) rally from last week’s lows near $30.00 has been capped at the top of the last two week’s horizontal channel, at 31.15, with investors awaiting the release of November’s US employment data.
The US economy is expected to have created 200,000 new jobs in the month, while the unemployment rate ticked up to 4.2%. This latter data and softer wage inflation are likely to keep hopes of December rate cuts alive.
On Thursday, the weekly jobless claims showed a larger-than-expected increase in the last week of November. This, coupled with below-consensus ADP employment figures seen on Wednesday, has cast some doubt about the NFP reading and increased pressure on the USD.
The technical picture shows the bullish momentum losing steam, with the 4-hour RSI turning down towards the 50 level and bulls capped below the mentioned $31.45. Above here, the next target is the November, 7 high, at 32.15. Supports are $30.90 and $30.45 (Dec 5 and 4 lows respectively)
Silver is a precious metal highly traded among investors. It has been historically used as a store of value and a medium of exchange. Although less popular than Gold, traders may turn to Silver to diversify their investment portfolio, for its intrinsic value or as a potential hedge during high-inflation periods. Investors can buy physical Silver, in coins or in bars, or trade it through vehicles such as Exchange Traded Funds, which track its price on international markets.
Silver prices can move due to a wide range of factors. Geopolitical instability or fears of a deep recession can make Silver price escalate due to its safe-haven status, although to a lesser extent than Gold’s. As a yieldless asset, Silver tends to rise with lower interest rates. Its moves also depend on how the US Dollar (USD) behaves as the asset is priced in dollars (XAG/USD). A strong Dollar tends to keep the price of Silver at bay, whereas a weaker Dollar is likely to propel prices up. Other factors such as investment demand, mining supply – Silver is much more abundant than Gold – and recycling rates can also affect prices.
Silver is widely used in industry, particularly in sectors such as electronics or solar energy, as it has one of the highest electric conductivity of all metals – more than Copper and Gold. A surge in demand can increase prices, while a decline tends to lower them. Dynamics in the US, Chinese and Indian economies can also contribute to price swings: for the US and particularly China, their big industrial sectors use Silver in various processes; in India, consumers’ demand for the precious metal for jewellery also plays a key role in setting prices.
Silver prices tend to follow Gold’s moves. When Gold prices rise, Silver typically follows suit, as their status as safe-haven assets is similar. The Gold/Silver ratio, which shows the number of ounces of Silver needed to equal the value of one ounce of Gold, may help to determine the relative valuation between both metals. Some investors may consider a high ratio as an indicator that Silver is undervalued, or Gold is overvalued. On the contrary, a low ratio might suggest that Gold is undervalued relative to Silver.
EUR/USD gathered bullish momentum and gained more than 0.7% on Thursday. Before testing 1.0600, however, the pair went into a consolidation phase and was last seen fluctuating at around 1.0570.
The table below shows the percentage change of Euro (EUR) against listed major currencies this week. Euro was the strongest against the Australian Dollar.
| USD | EUR | GBP | JPY | CAD | AUD | NZD | CHF | |
|---|---|---|---|---|---|---|---|---|
| USD | 0.08% | -0.06% | 0.16% | 0.35% | 1.36% | 1.13% | -0.11% | |
| EUR | -0.08% | -0.18% | 0.11% | 0.28% | 1.37% | 1.04% | -0.17% | |
| GBP | 0.06% | 0.18% | 0.27% | 0.46% | 1.60% | 1.22% | -0.02% | |
| JPY | -0.16% | -0.11% | -0.27% | 0.16% | 1.21% | 0.95% | -0.35% | |
| CAD | -0.35% | -0.28% | -0.46% | -0.16% | 1.17% | 0.76% | -0.47% | |
| AUD | -1.36% | -1.37% | -1.60% | -1.21% | -1.17% | -0.34% | -1.55% | |
| NZD | -1.13% | -1.04% | -1.22% | -0.95% | -0.76% | 0.34% | -1.20% | |
| CHF | 0.11% | 0.17% | 0.02% | 0.35% | 0.47% | 1.55% | 1.20% |
The heat map shows percentage changes of major currencies against each other. The base currency is picked from the left column, while the quote currency is picked from the top row. For example, if you pick the Euro from the left column and move along the horizontal line to the US Dollar, the percentage change displayed in the box will represent EUR (base)/USD (quote).
The US Dollar (USD) came under bearish pressure and helped EUR/USD push higher on Thursday after the US Department of Labor reported that the number of first-time applications for unemployment benefits rose to 224,000 in the week ending November 30 from 215,000 in the previous week.
Later in the day, November labor market data from the US will be scrutinized by investors. Following the 12,000 increase recorded in October, because of hurricanes and strikes, Nonfarm Payrolls (NFP) are forecast to rise by 200,000 in November.
According to the CME FedWatch Tool, markets are currently pricing in about a 70% probability of a 25 basis points (bps) Federal Reserve (Fed) rate cut in December. A disappointing NFP print of 150,000 or lower could confirm a rate reduction and further weigh on the USD. On the flip side, a reading above 200,000 could cause markets to refrain from pricing in a December cut and trigger a leg lower in EUR/USD.
Later in the American session, several Fed policymakers will be delivering speeches. Since the Fed’s blackout period will start on Saturday, these comments could also drive the USD’s valuation heading into the weekend.
The Relative Strength Index (RSI) indicator on the 4-hour chart retreated toward 60 early Friday, suggesting that the bullish bias remains intact, while EUR/USD stages a technical correction. On the upside, 1.0600 (Fibonacci 38.2% retracement of the latest downtrend) aligns as immediate resistance before 1.0650-1.0660 (200-period Simple Moving Average (SMA), Fibonacci 50% retracement) and 1.0730 (Fibonacci 61.8% retracement).
Looking south, first support could be spotted at 1.0520-1.0530 (100-period SMA, 50-period SMA, 20-period SMA, Fibonacci 23.6% retracement) ahead of 1.0500 (psychological level, static level) and 1.0440 (static level).