The main category of Forex News.
You can use the search box below to find what you need.
[wd_asp id=1]
The main category of Forex News.
You can use the search box below to find what you need.
[wd_asp id=1]
According to Bloomberg Economics, US headline inflation is expected to be 0.2% month-on-month and 2.6% year-on-year last month, matching October’s figures. Forward-looking pricing and early submissions to the Bloomberg survey align with these expectations. For the Federal Reserve, steady inflation is likely to signal caution when assessing interest rate cuts at the December meeting. Experts at Bloomberg expect US core consumer prices—a better measure of underlying inflation pressures—to have risen by 0.3% in November, matching the previous month’s pace. Also, the data will be released during the Federal Reserve’s traditional blackout period on public comments ahead of the meeting. These figures, along with the non-farm payroll report released last week, will shape expectations for the Fed’s decision.

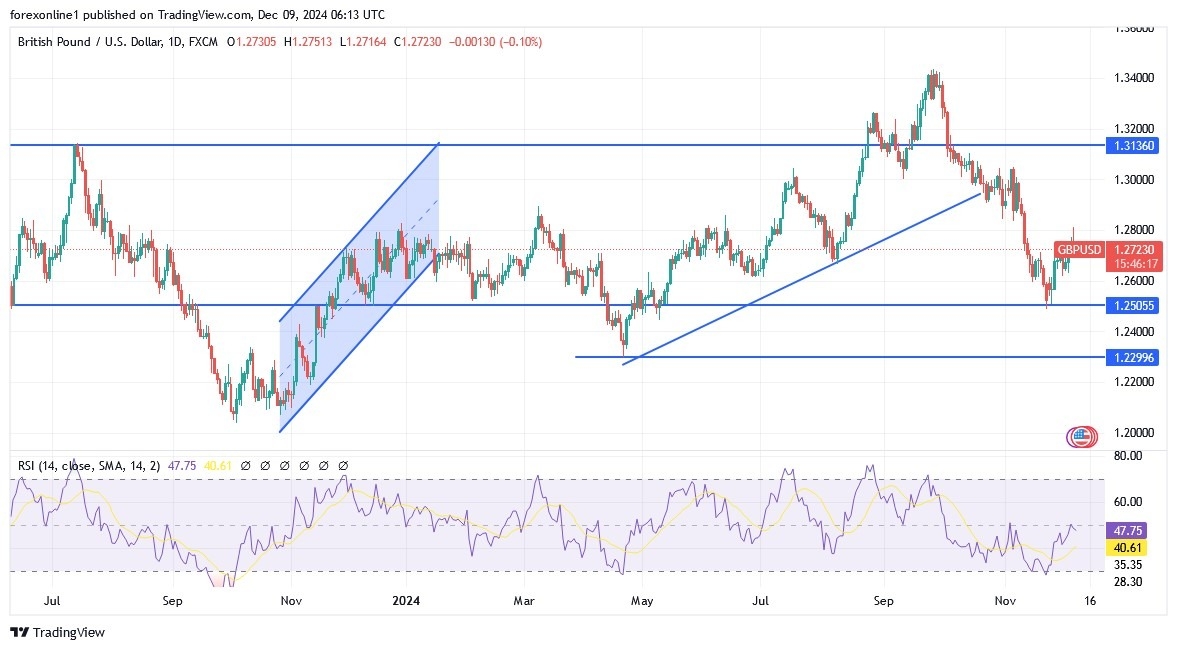
Despite the recent strong performance of the Pound, it may be susceptible to renewed selling in the coming trading sessions.
With the gains of the GBP/USD pair, the direction of the technical indicators, the RSI and the MACD, has shifted upwards, and to confirm the general trend has shifted to an upward trend, bulls should launch the currency pair towards the resistance levels of 1.2860. consequently, the psychological resistance of 1.3000. Otherwise, the technical gains of the pair will be subject to renewed selling operations to take profits, which we expect in the coming days. Especially, if the US inflation figures come out stronger than all expectations. The expected US trade wars have expanded, which increases the demand for buying the US dollar as a safe haven. As is known, the British pound is a risk currency. Decisively, it must be considered that returning to the 1.2600 level will end hopes for the recent rise for a period of time.
Ready to trade our Forex GBP/USD daily analysis and predictions? Here are the best forex trading platforms UK to choose from.
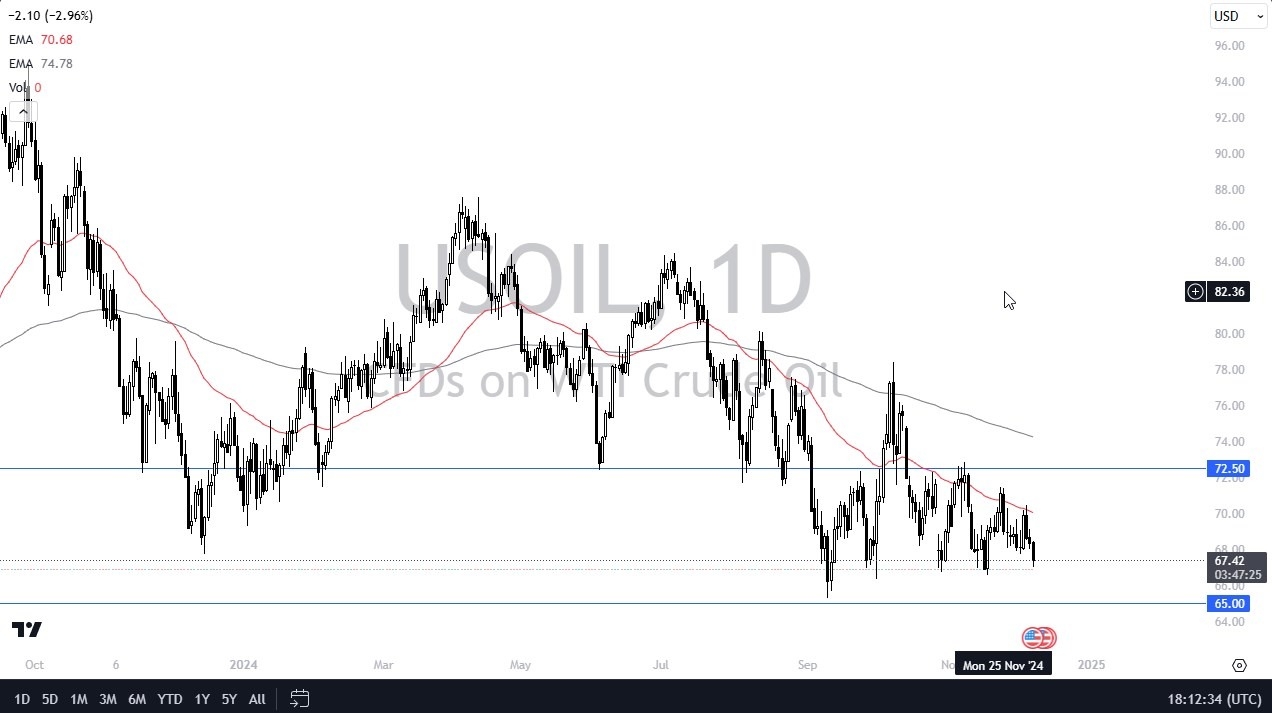
All things being equal, this is a market that I think if you see some type of bounce, you have to look at it as a short-term buying opportunity. The 50-day EMA is near the $70 level, and that of course is an area that I think would attract a lot of attention in and of itself, just due to the fact that it is such a big round hole number.
If we can break above there, then the crude oil market is likely to go looking to the $72.50 level above, which is a significant barrier also. If we were to break down below the $65 level, it’s likely that the bottom will fall out. But as things stand right now, I think what you’ve got here is a market that is just simply trying to hang on to the range that it’s been in for about three years.
The $65 level has been consistently important, so I like the idea of buying the pullback. Once we get a turnaround, perhaps a little bit of a balance in order to form a V on the chart, as it were. Whether or not we break out to the upside would be a completely different question, but as things stand right now, I think the market is just simply hanging around, killing time, seeing if it can find a reason to go higher. At this juncture, if you can watch the charts for short term trades, this is a market for you.
Ready to trade the daily crude oil Forex forecast? Here’s a list of some of the best Oil trading platforms to check out.
The EUR/USD outlook shows some strength in the euro as the dollar drops due to increasing bets for a December Fed rate cut. Meanwhile, traders remained cautious ahead of key US inflation data that will continue shaping the outlook for US monetary policy.
-If you are interested in Islamic forex brokers, check our detailed guide-
The greenback fluctuated on Friday when data showed a mixed picture of the US labor sector. Employers added 224,000 new workers in November, beating forecasts. This surge in job growth initially boosted the dollar. However, the unemployment rate rose from 4.1% to 4.2%, signaling cracks in the labor market. As a result, markets raised the likelihood of a 25-bps December Fed rate cut from 70% to 85%, weighing on the dollar.
Meanwhile, the euro remained vulnerable ahead of the ECB meeting. At the same time, fears of likely US tariffs have kept downward pressure on the currency.
A Reuters poll showed that most economists expect the European Central Bank to lower borrowing costs by 25-bps in December. At the same time, they expect 100-bps of cuts by the end of next year.
Meanwhile, traders await the US CPI report for more clues on Fed rate cuts.
Neither the US nor the Eurozone will release any key reports today. Therefore, the pair might remain in consolidation ahead of a busy week.
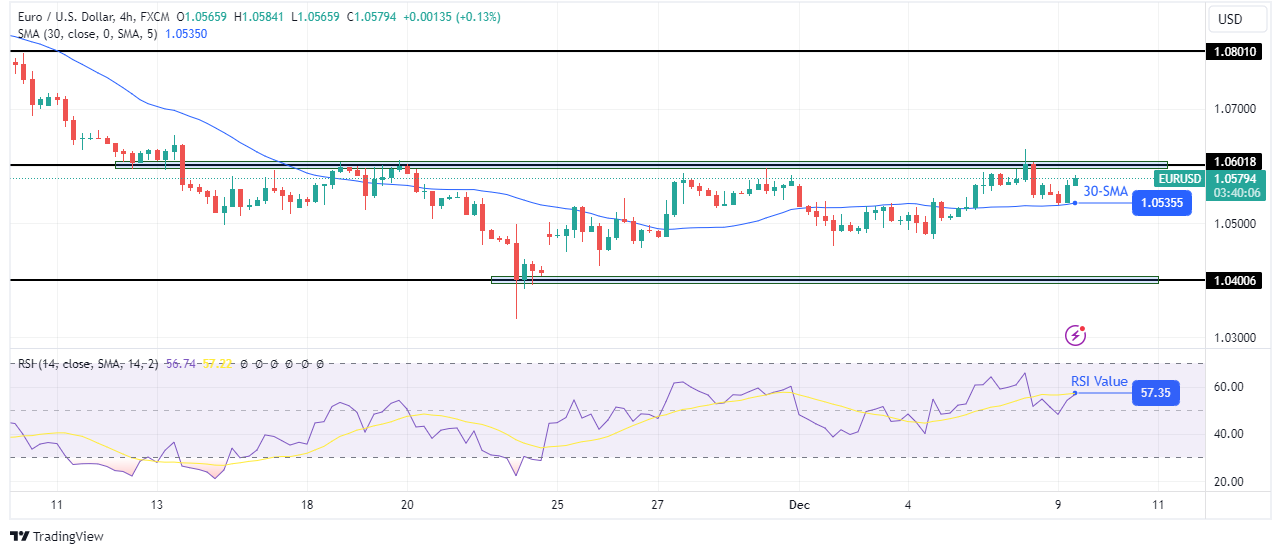
On the technical side, the EUR/USD price is trading in a range between the 1.0400 support level and the 1.0601 resistance level. This sideways move came after a downtrend that weakened at the 1.0400 support level. The range is a shallow corrective move that might end to allow the downtrend to continue. Therefore, bulls might find it difficult to breach the 1.0601 resistance level. Meanwhile, a break below the 1.0400 support level would signal a continuation of the downtrend.
-If you are interested in brokers with Nasdaq, check our detailed guide-
On the other hand, if bears are not strong enough to continue pushing EUR/USD lower, it might reverse to start an uptrend. Currently, bulls are pushing the price higher after retesting the 30-SMA support. However, the price must break above the 1.0601 resistance level to make higher highs and lows.
Looking to trade forex now? Invest at eToro!
67% of retail investor accounts lose money when trading CFDs with this provider. You should consider whether you can afford to take the high risk of losing your money.
Gold’s price continues to face sellers at $2,650 early Monday, capping the latest uptick sponsored by fresh Middle East geopolitical tensions. Meanwhile, traders resort to repositioning heading into the US inflation week, lending some support to Gold price.
Asian traders hit their desks on Monday, reacting to the weekend’s news of Syrian rebels seizing the capital, Damascus, ousting President Bashar al-Assad, who fled to Russia with his family seeking asylum. The toppling of Assad’s government ended a 13-year civil war and more than 50 years of his family’s brutal rule.
In response, the United Nations (UN) will likely convene for an emergency closed-door meeting on Monday to discuss the situation in Syria. Investors remain wary amid multiple risks emanating from the Middle East even as Israel struck a ceasefire deal with the Lebanese militant group Hezbollah a week ago.
They also remain cautious ahead of this week’s US Consumer Price Index (CPI) data, especially after Friday’s US labor data showed that the Nonfarm Payrolls rebounded by 227K in November, beating the estimated 200K increase. The Unemployment Rate ticked higher to 4.2% in the same period, as expected.
Despite the big beat on the headline NFP number, markets ramped up bets for a US Federal Reserve (Fed) interest rate cut this month to above 80%, according to the CME Group’s FedWatch Tool. This helped Gold price shake off the knee-jerk drop to the weekly low of $2,613 following the US labor data release.
Looking ahead, geopolitical developments will continue playing a pivotal role in influencing risk sentiment, significantly impacting safe-haven assets such as Gold price, the US Dollar (USD) and the US Treasuries.
Besides Syria’s political upheaval, South Korea faces the same problem, with President Yoon Suk Yeol having survived the impeachment vote on Saturday. Yoon’s People Power Party boycotted the Saturday impeachment vote brought by opposition parties.
Markets also remain hopeful of more stimulus from China after the country’s consumer inflation data signalled continued demand weakness in the world’s biggest consumer. China’s stimulus optimism bodes well for the non-yielding Gold price. China’s CPI missed expectations in November, rising by 0.2% year on year (YoY), down from a 0.3% increase in October.
The daily chart shows that Gold’s price failed to chart a range breakdown on a daily closing basis on Friday and regained the critical short-term 21-day Simple Moving Average (SMA) at $2,630 after briefly breaching it during the day.
The 14-day Relative Strength Index (RSI) has turned higher to test the 50 level, backing the renewed uptick in Gold price.
However, it remains to be seen if Gold price extends the rebound from the weekly low as the $2,650 level emerges as the immediate upside hurdle.
Meanwhile, the 50-day SMA at $2,668 remains a tough nut to crack for the optimists. The next relevant resistance is seen at $2,700.
On the flip side, a daily candlestick closing below the 21-day SMA at $2,630 will likely revive the downside.
The next support aligns at the previous week’s low of $2,613, below which the 100-day SMA at $2,586 will be the line in the sand for Gold buyers.
After spiking to its highest level since November 12 above 1.2800 on Friday, GBP/USD reversed its direction in the American session and closed in the red, snapping a three-day winning streak. In the European morning on Monday, the pair holds its ground and looks to test 1.2780 resistance.
The table below shows the percentage change of British Pound (GBP) against listed major currencies this week. British Pound was the strongest against the Japanese Yen.
| USD | EUR | GBP | JPY | CAD | AUD | NZD | CHF | |
|---|---|---|---|---|---|---|---|---|
| USD | 0.02% | -0.19% | 0.33% | -0.03% | -0.69% | -0.23% | 0.11% | |
| EUR | -0.02% | -0.20% | 0.43% | 0.04% | -0.62% | -0.16% | 0.17% | |
| GBP | 0.19% | 0.20% | 0.46% | 0.24% | -0.42% | 0.04% | 0.38% | |
| JPY | -0.33% | -0.43% | -0.46% | -0.39% | -0.93% | -0.68% | -0.14% | |
| CAD | 0.03% | -0.04% | -0.24% | 0.39% | -0.62% | -0.20% | 0.14% | |
| AUD | 0.69% | 0.62% | 0.42% | 0.93% | 0.62% | 0.46% | 0.81% | |
| NZD | 0.23% | 0.16% | -0.04% | 0.68% | 0.20% | -0.46% | 0.33% | |
| CHF | -0.11% | -0.17% | -0.38% | 0.14% | -0.14% | -0.81% | -0.33% |
The heat map shows percentage changes of major currencies against each other. The base currency is picked from the left column, while the quote currency is picked from the top row. For example, if you pick the British Pound from the left column and move along the horizontal line to the US Dollar, the percentage change displayed in the box will represent GBP (base)/USD (quote).
The data published by the US Bureau of Labor Statistics (BLS) showed on Friday that Nonfarm Payrolls (NFP) in the US rose by 227,000 in November, beating the market expectation for an increase of 200,000. The Unemployment Rate edged higher to 4.2% from 4.1% in the same period, while the annual wage inflation, as measured by the change in the Average Hourly Earnings, remained unchanged at 4%, coming in above analysts’ forecast of 3.9%. After suffering large losses against its major rivals on Thursday, the US Dollar (USD) benefited from the upbeat jobs report late Friday, causing GBP/USD to stretch lower.
The US economic calendar will not offer any high-tier data releases until the BLS publishes the Consumer Price Index (CPI) figures for November on Wednesday.
In the European morning on Monday, the UK’s FTSE 100 is up nearly 0.4% and US stock index futures trade marginally higher on the day. In case risk flows dominate the action in financial markets following a bullish opening in Wall Street, the USD could come under renewed selling pressure and help GBP/USD push higher.
GBP/USD holds above the ascending trend line and the Relative Strength Index (RSI) indicator on the 4-hour chart stays near 60, highlighting the bullish bias in the near term. On the upside, the 200-period Simple Moving Average (SMA) aligns as first resistance at 1.2780 ahead of 1.2810-1.2820 (Fibonacci 61.8% retracement of the latest downtrend, 200-day SMA) and 1.2870 (50-day SMA).
Looking south, immediate support could be spotted at 1.2750 (Fibonacci 50% retracement) before 1.2700 (Fibonacci 38.2% retracement) could be seen as next support before 1.2650 (100-period SMA).
The Pound Sterling (GBP) is the oldest currency in the world (886 AD) and the official currency of the United Kingdom. It is the fourth most traded unit for foreign exchange (FX) in the world, accounting for 12% of all transactions, averaging $630 billion a day, according to 2022 data. Its key trading pairs are GBP/USD, also known as ‘Cable’, which accounts for 11% of FX, GBP/JPY, or the ‘Dragon’ as it is known by traders (3%), and EUR/GBP (2%). The Pound Sterling is issued by the Bank of England (BoE).
The single most important factor influencing the value of the Pound Sterling is monetary policy decided by the Bank of England. The BoE bases its decisions on whether it has achieved its primary goal of “price stability” – a steady inflation rate of around 2%. Its primary tool for achieving this is the adjustment of interest rates. When inflation is too high, the BoE will try to rein it in by raising interest rates, making it more expensive for people and businesses to access credit. This is generally positive for GBP, as higher interest rates make the UK a more attractive place for global investors to park their money. When inflation falls too low it is a sign economic growth is slowing. In this scenario, the BoE will consider lowering interest rates to cheapen credit so businesses will borrow more to invest in growth-generating projects.
Data releases gauge the health of the economy and can impact the value of the Pound Sterling. Indicators such as GDP, Manufacturing and Services PMIs, and employment can all influence the direction of the GBP. A strong economy is good for Sterling. Not only does it attract more foreign investment but it may encourage the BoE to put up interest rates, which will directly strengthen GBP. Otherwise, if economic data is weak, the Pound Sterling is likely to fall.
Another significant data release for the Pound Sterling is the Trade Balance. This indicator measures the difference between what a country earns from its exports and what it spends on imports over a given period. If a country produces highly sought-after exports, its currency will benefit purely from the extra demand created from foreign buyers seeking to purchase these goods. Therefore, a positive net Trade Balance strengthens a currency and vice versa for a negative balance.
Domestic and world coffee prices increased sharply on 7/12
Today’s coffee price December 7, 2024 on the world market, at 4:30 am, is updated on the Vietnam Commodity Exchange MXV (world coffee prices are continuously updated by MXV, matching the world exchanges, the only channel in Vietnam that continuously updates and links with the world exchanges). Today’s online coffee prices of the three main coffee futures exchanges ICE Futures Europe, ICE Futures US and B3 Brazil are continuously updated by Y5 Cafe during the trading hours of the exchange, updated as follows:
At the end of the trading session, the price of Robusta coffee on the London floor at 4:30 a.m. on December 7, 2024 continued to increase sharply, increasing from 233 – 258 USD/ton, fluctuating from 4.779 – 5193 USD/ton. Specifically, the monthly delivery term January 2025 was 5153 USD/ton (up 258 USD/ton); the monthly delivery term March 2025 was 5116 USD/ton (up 243 USD/ton); the monthly delivery term May 2025 was 5065 USD/ton (up 238 USD/ton) and the monthly delivery term July 2025 was 5000 USD/ton (up 233 USD/ton).
| Domestic coffee prices on December 7, 2024 increased sharply. Photo: Hoang Thien Nga. |
Similar to the London floor, the price of Arabica coffee on the New York floor on the morning of December 7, 2024 also increased sharply, increasing from 13.05 – 16.75 cents/lb, fluctuating from 300.70 – 331.70 cents/lb. Specifically, the monthly delivery term March 2025 is 330.25 cents/lb (up 16.75 cents/lb); the monthly delivery term May 2025 is 327.60 cents/lb (up 16.30 cents/lb); the monthly delivery term July 2025 is 321.95 cents/lb (up 15.40 cents/lb) and the monthly delivery term September 2025 is 314.15 cents/lb (up 13.05 cents/lb).
At the end of the trading session, the price of Brazilian Arabica coffee in the morning of December 7, 2024 was dominated by green, the price increased sharply, the increase was from 14.90 – 21.55 USD/ton depending on the delivery terms. Specifically, the monthly delivery term December 2024 was 405.00 USD/ton (up 14.95 USD/ton); the monthly delivery term March 2025 was 408.95 USD/ton (down 0.35 USD/ton); the monthly delivery term May 2025 was 409.15 USD/ton (up 21.55 USD/ton) and the monthly delivery term July 2025 was 401.50 USD/ton (up 20.35 USD/ton).
Meanwhile, domestic coffee prices updated at 4:30 a.m. on December 7, 2024 also continued to increase sharply compared to the previous trading session, an increase of about VND5.600/kg. Currently, the average coffee purchase price in the Central Highlands provinces is VND120.100/kg.
Specifically, the coffee purchase price in Gia Lai province is at 120.000 VND/kg; the coffee purchase price in Dak Nong province is 120.200 VND/kg and Dak Lak has the highest price of 120.000 VND/kg; the price of green coffee beans (coffee beans, fresh coffee beans) in Lam Dong province in districts such as Bao Loc, Di Linh, Lam Ha, coffee is purchased at 118.500 VND/kg.
Coffee price today (date 7/12) in Dak Lak province; in Cu M’gar district, coffee is purchased at the price of 120.100 VND/kg, and in Ea H’leo district, Buon Ho town, it is purchased at the price of 120.000 VND/kg.
Experts predict that tomorrow’s coffee price December 8, 2024 will continue to increase strongly.
According to statistics, today 7/12 is the 3 consecutive day that world coffee prices have increased strongly by 3 digits, the increase has regained what was lost in previous deep declines. Meanwhile, domestic coffee prices have also witnessed the 2 consecutive day of strong price increases.
 |
| Experts say that tomorrow December 8, 2024, domestic and world coffee prices will continue to increase strongly. |
According to experts, the price of coffee in the Central Highlands increased faster than the world price due to many different reasons, including speculation when coffee prices decreased. Specifically, some businesses took advantage of the coffee price reduction at the beginning of the week to buy coffee to pay off contract debts and “hold on to goods” to make a profit.
In addition, experts also commented that the global coffee market trend is still low supply compared to the increasing consumer demand. Moreover, the current harvest in many places has not yet reached its peak, reaching only about 30% and farmers are not under economic pressure, so the recent price drop did not cause a sell-off. Therefore, when the world market recovered, domestic prices increased sharply again.
According to Reuters, despite the peak harvest season, domestic coffee prices in Vietnam are still rising due to high demand and limited supply. In the two months since the new harvest began, farmers in the Central Highlands have only harvested about 2% of the coffee output.
Experts say that farmers are not facing much financial pressure at present thanks to stable income from other crops such as durian and pepper, so they are not in a hurry to sell their products and continue to wait for coffee prices to increase. In addition, speculators are also “holding on to goods” to push up prices for profit.
Therefore, experts predict that tomorrow December 8, 2024, domestic and world coffee prices will continue to increase strongly.
Trade NYMEX WTI Crude Oil futures (CL), the world’s most liquid crude oil contract. When traders need the current oil price, they check the WTI Crude Oil price. WTI (West Texas Intermediate, a US light sweet crude oil blend) futures provide direct crude oil exposure and are the most efficient way to trade oil after a sharp rise in US crude oil production.
Use WTI Crude Oil futures to hedge against adverse oil price moves or speculate on whether WTI oil prices will rise or fall. Our diverse WTI futures and options suite provides more flexibility to trade oil with WTI Crude Oil price discovery. View delayed WTI Oil prices and WTI Oil price charts below.
Risk Disclaimer: DailyForex will not be held liable for any loss or damage resulting from reliance on the information contained within this website including market news, analysis, trading signals and Forex broker reviews. The data contained in this website is not necessarily real-time nor accurate, and analyses are the opinions of the author and do not represent the recommendations of DailyForex or its employees. Currency trading on margin involves high risk, and is not suitable for all investors. As a leveraged product losses are able to exceed initial deposits and capital is at risk. Before deciding to trade Forex or any other financial instrument you should carefully consider your investment objectives, level of experience, and risk appetite. We work hard to offer you valuable information about all of the brokers that we review. In order to provide you with this free service we receive advertising fees from brokers, including some of those listed within our rankings and on this page. While we do our utmost to ensure that all our data is up-to-date, we encourage you to verify our information with the broker directly.
I wrote on 1st December that the best trade opportunities for the week were likely to be:
The weekly gain of 0.83% equals 0.28% per asset.
Last week’s key takeaways were:
What has been the most interesting to the market over the past week was the strong US data, continuing the theme of American economic growth and other economic metrics making the USA the envy of the world right now. We saw also the Australian Dollar get hit and this is due to a faltering Australian economy that makes further rate cuts likelier over the near term. Markets are more interested right now in global growth and the likely appointments of the upcoming Trump administration, which will take power in January. We saw US and European stock markets gaining again last week as risk sentiment in parts of the world improved, with the broad US S&P 500 Index, the NASDAQ 100 Index, and the German DAX all reaching record highs.
The coming week’s schedule is packed with key US economic data, and four central bank policy meetings, with three of them expected to produce rate cuts. This means it will likely be an important week, and we will probably see a strong increase in price movements in the Forex and stock markets.
For the month of December, I forecasted that the EUR/USD currency pair would fall in value. The performance of my forecast so far is:

Last week, I forecasted that the AUD/JPY and CAD/JPY currency pairs would rise in value, as they fell by such unusually large amounts the previous week. Unfortunately, both currency crosses fell over the week, the AUD/JPY by 1.74% and the CAD/JPY by 0.94%.
The US Dollar was the strongest major currency, while the Australian Dollar was the weakest. Volatility fell last week, with less than half of the most important Forex currency pairs and crosses changing in value by over 1%.
You can trade these forecasts in a real or demo Forex brokerage account.

Last week, the US Dollar Index printed a bearish doji candlestick that continued the reversal of the recent breakout to back underneath the resistance level at 105.81, as well as the upper trend line of the formerly dominant consolidating triangle chart pattern, which can be seen in the price chart below. These are bearish signs, but it should be noted that the price is above its levels from three and six months ago, suggesting a long-term bullish trend in the greenback that should be exploitable.
I have plenty of fundamental reasons to be bullish on the US Dollar. However, the upside over the coming week might be limited, so long-term trades long of the USD might be more successful than short-term trades.
We will be getting highly important US CPI (inflation) and PPI (purchasing power index) data on the US economy this week, so technical factors might not be very important, with price action over the second half of this week likely to be more data-driven.

Bitcoin finally broke above the psychologically important $100,000 level last week, reaching a new record high above that, and even made a daily close above this level. However, there are signs that the momentum has stalled or slowed, and the price does not really seem to be respecting $100,000 anymore, as the price is chopping above and beyond it.
The strong long-term bullish trend is something worth paying attention to, and it has been given a tailwind by the Republican victory in the recent US elections. The price chart below shows a spectacular long-term bullish trend which has been ongoing for the past two years.
As we got a daily close above $100,000 on Friday, I am comfortable being long. I am not confident we are going to immediately see a further strong rise, but there is no reason to be bearish. The weekly price action still looks bullish.

Last week, the EUR/USD currency pair printed a doji candlestick, with the candlestick having a higher high and higher low than the previous week’s candlestick. These are potentially bullish signs. However, the price is still below its levels from both 3 and 6 months ago, which is my preferred metric for calling a long-term bearish trend. The US Dollar Index is also in a long-term bearish trend. A final bearish filter is that the 50-day moving average is below the 100-day moving average, which validates the trend.
Although there are reasons to be short here, I am a bit concerned about the strength of the bullish inflection from the recent multi-year low. On the other hand, this currency pair tends to make deep retracements within even its strongest trends.
Friday saw the price strongly reject the resistance level at $1.0610 although it is also possible this was simply a reaction to the strong average hourly earnings and non-farm payrolls data which was released in the USA that day.
I am not very optimistic about this trade but based on historical precedents in technical analysis and trend, it makes sense to be short of this currency pair.
A rate cut by the ECB is expected this week, so if there is any surprise there, we might see a move in the Euro which could push the price around here. The same holds for US CPI (inflation) data which is also coming this week.

Last week saw the NASDAQ 100 Index print a powerful bullish candlestick reach and close at a new record high for the first time in three weeks, and the price closed very near the top of its range, which is a bullish sign. There is nothing more bullish than the fact that the price is trading bullishly in blue sky.
The price is nicely contained within a linear regression analysis channel, which can be seen in the price below, giving added reliability to the continuation of this trend.
US stock markets are leading global equities, which is nothing unusual, boosted by President Trump’s reputation as doing anything to generate economic growth and stock market growth, as well as his announcement of his intention to put strong tariffs on imports from Mexico and China.
Maybe more importantly, the US stock market has been in a strong bullish trend for over one year now, so there is plenty of momentum supporting last week’s bullish move.
I see the NASDAQ 100 Index as a buy.

Last week saw the S&P 500 Index rise again to reach a new record high, and it closed the week quite near the high, which is a bullish sign. There is no sign more bullish than the fact that the price is trading bullishly in blue sky.
Everything I wrote above about the NASDAQ 100 applies to the S&P 500 Index too, the only difference is that while the NASDAQ 100 was dipping previously, the S&P 500 was still rising. Both indices have performed almost exactly the same over 2024 in terms of percentage gain.
I see the S&P 500 Index as a buy.

Last week saw the DAX Index rise unusually strongly to reach a new record high, and it closed the week right on its high, which is a bullish sign. There is no sign more bullish than the fact that the price is trading bullishly in blue sky.
Recent weeks have been dominated by the USA having a successful economy and soaring stock market compared to the rest of the world, with the German DAX one of the very few other major equity indices that is also breaking to new all-time highs. This is seen as a bit of a mystery as the German economy is not doing especially well, with most analysts seeing it as due to the strength of the German industries which the index represents (technology, financials, industrials) rather than Germany as a whole.
It is worth noting that the DAX performed almost as well as the major US equity indices over 2024. The DAX is up by 19% while the major US indices are up by 26%.
After a bullish candlestick with such strength, I see the DAX Index as a buy.

I see the best trading opportunities this week as
Ready to trade our Forex weekly forecast? Check out our list of the top 10 Forex brokers in the world worth checking out.
OPEC+ verdict: Leading global investment bankers Morgan Stanley and HSBC revised down their expectations for an oil market surplus next year and forecast a Brent crude price of $70 per barrel, following a decision by the Organisation of Petroleum Exporting Countries (OPEC) to delay and slow plans for a higher crude output. The decision comes after crude prices have weakened 18 per cent since June over an oversupply in the market and low war-related risk premium.
On Thursday, OPEC and its allies including Russia (OPEC+), postponed the start of oil output increases by three months until April 2025. The oil cartel also said the cuts would take place until September 2026, nine months later than what was previously planned. OPEC+ has discussed plans of a supply hike since June.
According to news agency Reuters, Morgan Stanley raised its Brent forecast for the second half of 2025 to $70 from $66-68 per barrel. The bank lowered its estimate for OPEC-9 (OPEC members minus Iran, Libya and Venezuela who are exempted from output curbs) production by 400,000 barrels per day (bpd) for 2025, and by 700,000 bpd by the fourth quarter of next year.
It also cut its estimate for Iran’s production by about 100,000 bpd through 2025. “In aggregate, this reduces our estimated surplus in 2025 from 1.3 to 0.8 million bpd in our total liquids balance, and from 0.7 to 0.3 million bpd in our crude-only balance,” said Morgan Stanley in its note on Thursday, December 5.
On the other hand, HSBC maintained its Brent crude price forecast at $70 per barrel for 2025 and beyond, it said in a note on Friday. The bank anticipates an oil market surplus of 0.2 million barrels per day in 2025 if OPEC proceeds with planned production hikes in April. Previously, it had expected a surplus of 0.5 million bpd.
Bank of America (BoFA) expects Brent oil prices to average $65 per barrel, assuming no significant increase in OPEC production volumes in 2025. “Demand growth has slowed this year and is expected to remain tepid in 2025 too, tipping the market into surplus next year,” said BoFA. The weak demand outlook is the Achilles’ heel for OPEC , the bank said, and forecast global oil demand growth averaging one million bpd this year and 1.1 million bpd next.
Crude oil slid to the lowest in three weeks on concerns about excess supplies and a wave of technical selling. US West Texas Intermediate (WTI) futures declined as much as 1.9 per cent to trade below $67 a barrel and touch its lowest intraday price since November 18. Brent traded near $71.
Despite OPEC vowing to return output to the market at a slower pace than initially planned, a looming supply surplus continues to pressure prices. Both WTI and Brent have met resistance at their short-term moving averages, prompting algorithm-driven traders to enter the market and extend losses.
Yesterday, OPEC+ opted to start with a modest output increase in April and unwind the cuts over 18 months. The deferral was aimed at offsetting a seasonal demand lull early next year, Saudi Arabian Energy Minister Prince Abdulaziz bin Salman told CNBC on Friday. Banks still largely expect a surplus in 2025 as Chinese demand growth cools and production from the Americas swells.
“The first quarter is not a good quarter to bring volumes,” Prince Abdulaziz bin Salman told CNBC in an interview. “That quarter is known to be a quarter for building stocks.” Despite deciding to postpone, Prince Abdulaziz said that the alliance “honestly believe the market next year will be better than what is being projected.”
Eight OPEC countries will extend their “voluntary adjustments” of 2.2 million bpd until the end of March, the Vienna-based group said in a statement following a virtual meeting. After that, those cuts “will be gradually phased out” monthly until the end of September 2026, “subject to market conditions”.
Without a new agreement, the eight countries were set to begin increasing production in January to gradually return it to 2023 levels. Algeria, Iraq, Kazakhstan, Kuwait, Oman, Russia, Saudi Arabia, and the United Arab Emirates have already twice pushed back the production increases that were set to begin in October and then in December.
For several months, OPEC+ has been seeking to restore output halted over the past two years, but been frustrated as faltering demand in China and swelling supplies from the Americas pressure crude prices. Many analysts predict that global oil markets will still face a surplus in 2025 even if OPEC does not raise output.
Crude has been range-bound since mid-October, with bullishness from geopolitical developments in the Middle East and Ukraine countered by expectations of a glut in 2025. The potential for Trump administration tariffs and possible sanctions on Iran also are injecting uncertainty into the market.
Catch all the Business News , Market News , Breaking News Events and Latest News Updates on Live Mint. Download The Mint News App to get Daily Market Updates.
MoreLess