The main category of Forex News.
You can use the search box below to find what you need.
[wd_asp id=1]
The main category of Forex News.
You can use the search box below to find what you need.
[wd_asp id=1]
Given the confluence of indicators pointing to potential support around 3.04 to 3.02 and the intraday recovery, there is a chance that today’s low ends the short-term correction. A return to the breakout level of 3.02 is typical as prior resistance levels are tested as support. The decisive rally above 3.02, a prior swing high, on November 20 triggered a bullish breakout of a symmetrical triangle pattern.
Once triggered the price of natural gas reclaimed the next two higher swings that construct the top of the triangle formation at 3.16 and 3.39, before peaking at a new trend high of 3.56. The 2023 peak is a little further up at 3.64. That was the highest traded price since January 2023.
Regardless of the potential for the 3.02 support zone to hold, there is also the top boundary line of the triangle a little lower, around 2.92, depending on when it might be reached. The line also defined resistance at the top of the triangle. It could still be tested as support. The line is joined by 2.90 and 2.88, the 127.2% extended target for the falling ABCD pattern and the 78.6% retracement level, respectively.
A daily close above 3.02 would provide a small indication of strength that would need follow-through, and further still on a close above 3.04. Nonetheless, a bullish reversal would not be indicated until there was an advance above today’s low of 3.08, assuming there is not a new low for the current bearish retracement beforehand.
For a look at all of today’s economic events, check out our economic calendar.
Image © Adobe Images
The Dollar fell after an unexpected slowdown in the mighty U.S. services sector was reported by the Institute for Supply Management (ISM).
The ISM Services PMI read at 52.1% in November, well below October’s 56% and the consensus estimate of 55.5%.
The ISM said election ramifications and tariffs were cited by respondents to the survey as being behind a more cautious sentiment.
The index’s Employment, Business Activity and New Orders components all receded versus the month prior.

In the wake of the release, the Pound to Dollar exchange rate (GBP/USD) is 0.32% higher on the day. The rise comes amidst a broader pullback by the Dollar.
The price action suggests markets have grown more confident that the Federal Reserve will cut interest rates in December after these softer data.
Several members of the Federal Reserve’s policy-setting committee have spoken recently, with most saying they are inclined to cut interest rates if incoming data turns softer.
“This week’s ISM reports have ticked that box and a soft jobs number on Friday would likely seal the deal even if next week’s inflation data remains sticky,” says James Knightley, Chief International Economist at ING Bank.
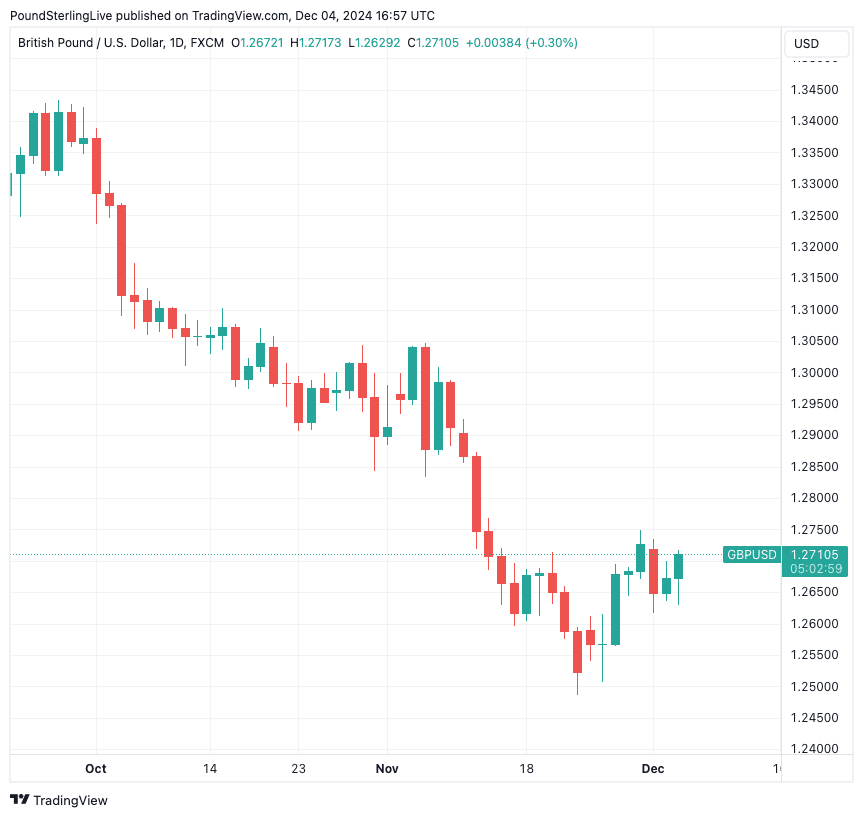
Above: GBP/USD is forming a base following a period of decline.
GBP/USD investment bank consensus forecasts: The end-2024 and 2025 guide from Corpay has been released. It shows a sizeable uplift was made to the consensus forecasts for GBP/USD. Please request a copy here.
“On balance, it is supportive of the rate cut narrative at the December FOMC meeting and suggests a cooling in economic growth in the fourth quarter,” he adds.
ING tells clients that if Friday’s U.S. job report indicates an approximate 100k net job creation, and the unemployment rate ticks up to 4.2%, then a 25bp rate cut on December 18 looks probable.
The Dollar has outperformed in October and November on the back of a run of above-consensus economic data releases that confirm the U.S. economy is in robust shape.
The data outcomes have prompted investors to slash expectations for the scale of rate cuts to come from the Fed, which has bolstered U.S. bond yields and the Dollar.
However, sentiment towards the USD is nearing stretched levels, leaving the currency at risk of a pullback in the event of data setbacks.
This PMI report is a perfect example of such a setback, and the Dollar’s response is, therefore, unsurprising.
Silver price (XAG/USD) recovers in a V-shape manner from the key support of $30.50 in Wednesday’s North American session and refreshes an intraday high near $31.20 after the release of the United States (US) ADP Employment Change data for November. The agency reported that the private sector hired fresh 146K workers, marginally missed estimates of 150K but was significantly lower from the former release of 184K, downwardly revised from 233K.
However, the private sector employment data has not weighed much on the US Dollar (USD). The US Dollar Index (DXY), which tracks the Greenback’s value against six major currencies, surrenders nominal gains but holds the key support of 106.50. 10-year US Treasury yields hold onto gains near 4.27%.
Historically, higher yields on interest-bearing assets increase the opportunity cost of holding an investment in non-yielding assets, such as Silver. But it doesn’t appear in this case, suggesting that geopolitical tensions continue to maintain safe-haven demand.
According to Reuters, the Hamas internal statement has reported that the group has information that Israel intends to carry out a hostage rescue operation similar to Israel’s June nuseirat operation in Gaza, a move that could derail the ceasefire between Iran and Israel. The appeal of the Silver price strengthens in a heightened geopolitical environment.
Going forward, investors will focus on Federal Reserve (Fed) Chair Jerome Powell’s speech at the New York Times DealBook Summit for fresh guidance on interest rates. The probability for the Fed to cut interest rates by 25 basis points (bps) to 4.25%-4.50% is 74%, while the rest favors leaving them unchanged at their current levels, according to the CME FedWatch tool.
Silver price strives to extend recovery above the 20-day Exponential Moving Average (EMA), which trades around $31.30.
The 14-day Relative Strength Index (RSI) oscillates in the 40.00-60.00 range, suggesting a sideways trend.
Looking down, the upward-sloping trendline around $29.50, which is plotted from the February 29 low of $22.30 on a daily timeframe, would act as key support for the Silver price. On the upside, the horizontal support plotted from the May 21 high of $32.50 would be the resistance zone.
Silver is a precious metal highly traded among investors. It has been historically used as a store of value and a medium of exchange. Although less popular than Gold, traders may turn to Silver to diversify their investment portfolio, for its intrinsic value or as a potential hedge during high-inflation periods. Investors can buy physical Silver, in coins or in bars, or trade it through vehicles such as Exchange Traded Funds, which track its price on international markets.
Silver prices can move due to a wide range of factors. Geopolitical instability or fears of a deep recession can make Silver price escalate due to its safe-haven status, although to a lesser extent than Gold’s. As a yieldless asset, Silver tends to rise with lower interest rates. Its moves also depend on how the US Dollar (USD) behaves as the asset is priced in dollars (XAG/USD). A strong Dollar tends to keep the price of Silver at bay, whereas a weaker Dollar is likely to propel prices up. Other factors such as investment demand, mining supply – Silver is much more abundant than Gold – and recycling rates can also affect prices.
Silver is widely used in industry, particularly in sectors such as electronics or solar energy, as it has one of the highest electric conductivity of all metals – more than Copper and Gold. A surge in demand can increase prices, while a decline tends to lower them. Dynamics in the US, Chinese and Indian economies can also contribute to price swings: for the US and particularly China, their big industrial sectors use Silver in various processes; in India, consumers’ demand for the precious metal for jewellery also plays a key role in setting prices.
Silver prices tend to follow Gold’s moves. When Gold prices rise, Silver typically follows suit, as their status as safe-haven assets is similar. The Gold/Silver ratio, which shows the number of ounces of Silver needed to equal the value of one ounce of Gold, may help to determine the relative valuation between both metals. Some investors may consider a high ratio as an indicator that Silver is undervalued, or Gold is overvalued. On the contrary, a low ratio might suggest that Gold is undervalued relative to Silver.
The EUR/JPY is our featured technical chart, for not only a technical breakdown is looking increasingly likely, but the macro back backdrop makes for a bearish fundamental backdrop. In short, the euro is undermined because of Europe’s persistent economic and political challenges, while a potential rate hike from the Bank of Japan magnifies the yen’s appeal. Against this backdrop, our short-term EUR/JPY forecast is bearish.
The euro rebounded slightly across the board amid a firmer risk tone with the DAX and S&P hitting new record highs this week. Still, FX traders are treading cautiously ahead of significant political developments in France and a packed week of US economic data, which could have indirect influence on the JPY through the bond market (i.e., should US data surprise to the upside, this should push US and global bond yields higher, which would be negative for the low-yielding assets like JPY).
Meanwhile, geopolitical tensions are still at the forefront. Donald Trump’s recent threat of trade tariffs, slated for implementation once he assumes office in January, adds an obvious layer of pressure on the euro. Over the weekend, Trump also warned of tariffs targeting BRIC nations not aligned with the US dollar as a reserve currency. In Europe, French Prime Minister Michel Barnier faces mounting pressure, with his coalition government on the verge of collapse. A no-confidence vote is scheduled for tomorrow, and analysts anticipate he will struggle to retain his position. This could usher in further political instability in the eurozone’s second-largest economy, potentially weighing on the EUR/JPY forecast and undermining other euro crosses.
Adding to the bearish sentiment for the euro are weak economic fundamentals. Yesterday’s release of updated Eurozone PMIs showed no improvement, underscoring the region’s deepening manufacturing recession, with little sign of recovery in sight.
The yen has been strengthening as speculation grows that the Bank of Japan could raise interest rates this month. This anticipation is not only boosting the yen against the dollar but also pressuring other pairs like the GBP/JPY and AUD/JPY.
And it looks like speculators appear eager to capitalize on the yen’s rally, according to the latest CFTC positioning data. Last week, large speculative traders significantly increased their long positions on the yen, driven by renewed expectations of a 25 basis point rate hike by the Bank of Japan this month. Notably, these traders reduced their short positions while boosting long exposure by over 23%, adding nearly 15,000 contracts to their bullish wagers.

Source: TradingView.com
As far as the technical EUR/JPY forecast is concerned, well this pair slid below the pivotal 160.00 level last week and is now hovering near the 158.00 old support level. Once support, this level could turn into resistance and potentially trigger another drop in this pair. The next level of support comes in around 156.50 to 157.00, which also marks the trend support in place since August. Should the EJ break below this area, then this could pave the way for a potential drop to take out liquidity resting below the lows of September and August at 155.15 and 154.41, respectively.
So, not only is the EUR/JPY under pressure because of a stronger yen, but the euro’s ongoing weakness, driven by Europe’s persistent economic and political challenges, further magnifies the yen’s appeal. Against this backdrop, our short-term EUR/JPY forecast is bearish, and we expect to see a breakdown below the summer low of 154.41.
— Written by Fawad Razaqzada, Market Analyst
Follow Fawad on Twitter @Trader_F_R
Back and forth among financial markets did not impact Gold price on Wednesday, with the bright metal stuck around $2,650 a troy ounce. The US Dollar seesawed between gains and losses, on the one hand, backed by political jitters weighing on the mood, and on the other hand, losing ground on the back of tepid United States (US) data.
Also, central banks’ chiefs affected markets. Bank of England (BoE) Governor Andrew Bailey was the first to publicly appear, saying markets should expect the United Kingdom (UK) to keep cutting rates gradually next year as inflation eases. He added that the disinflation process is well embedded but that there’s more to do.
Next was European Central Bank (ECB) President Christine Lagarde, who testified before the European Parliament’s Committee on Economic and Monetary Affairs. Lagarde said that the economic growth in the EU will be weaker in the near term, adding the recovery should start to gather “some steam.” She added inflation is expected to temporarily increase in the last quarter of the year, and decline to target in the course of the next one.
Data-wise, the US released the ADP Employment Change report, showing the private sector added 146,000 new positions in November, below the 150,000 expected. Additionally, the ISM Services Purchasing Managers Index (PMI), which unexpectedly fell to 52.1 in November from 56 in the previous month, also missed the expected 55.5.
Still pending is a speech from Federal Reserve’s (Fed) Chairman Jerome Powell, due to participate in a moderated discussion at the New York Times DealBook Summit. The next first tier-event will take place on Friday, when the US will release the November Nonfarm Payrolls (NFP) report.
From a technical point of view, XAU/USD has made no progress. The daily chart shows it has held within familiar levels for a seventh consecutive trading day, albeit finding intraday support around a now flat 20 Simple Moving Average (SMA). The 100 and 200 SMAs advance below the current level but lose their upward strength. Finally, technical indicators remain within positive levels, with uneven upward strength, not enough to confirm a bullish extension.
In the near term, and according to the 4-hour chart, XAU/USD is neutral. All moving averages are flat, with the 200 SMA at around $2,678.35 and the shorter ones below the current level. Technical indicators stand above their midlines but lack directional strength. Gold may keep consolidating ahead of upcoming central banks’ meetings scheduled throughout the upcoming two weeks.
Support levels: 2,626.70 2,611.35 2,598.70
Resistance levels: 2,671.55 2,688.65 2,700.00
The GBP/USD forecast indicates a strong pound after slightly hawkish Bank of England remarks. Meanwhile, the dollar gained after upbeat data in the previous session, and markets awaited more crucial US employment figures.
-Are you looking for the best AI Trading Brokers? Check our detailed guide-
BoE governor Andrew Bailey on Wednesday noted that the Bank of England would stick to a gradual pace for rate cuts next year. Markets are pricing four rate cuts in 2024. However, they do not expect any more cuts this year.
Meanwhile, the greenback rose on Tuesday after figures showed that US job vacancies rose more than expected. The JOLTs report revealed 7.74 million job openings, above estimates of 7.51 million. The numbers indicated a high demand for labor. However, there was little impact on rate cut expectations as traders awaited the more crucial nonfarm payrolls report.
According to estimates, the economy might add 195,000 new jobs in November. Meanwhile, the unemployment rate might increase to 4.2%. The last report showed dismal job growth at 12,000.
However, experts chalked it up to hurricane disruptions. Another month of poor job growth could be a red flag for the labor sector. Moreover, it would increase bets for a rate cut in December, weighing on the dollar.
On the other hand, an upbeat report could lower the chances of a rate cut, boosting the greenback. At the same time, traders will pay attention to Powell’s speech later in the day for clues on the outlook for rate cuts. Currently, markets are pricing a 75% chance of a cut in December.
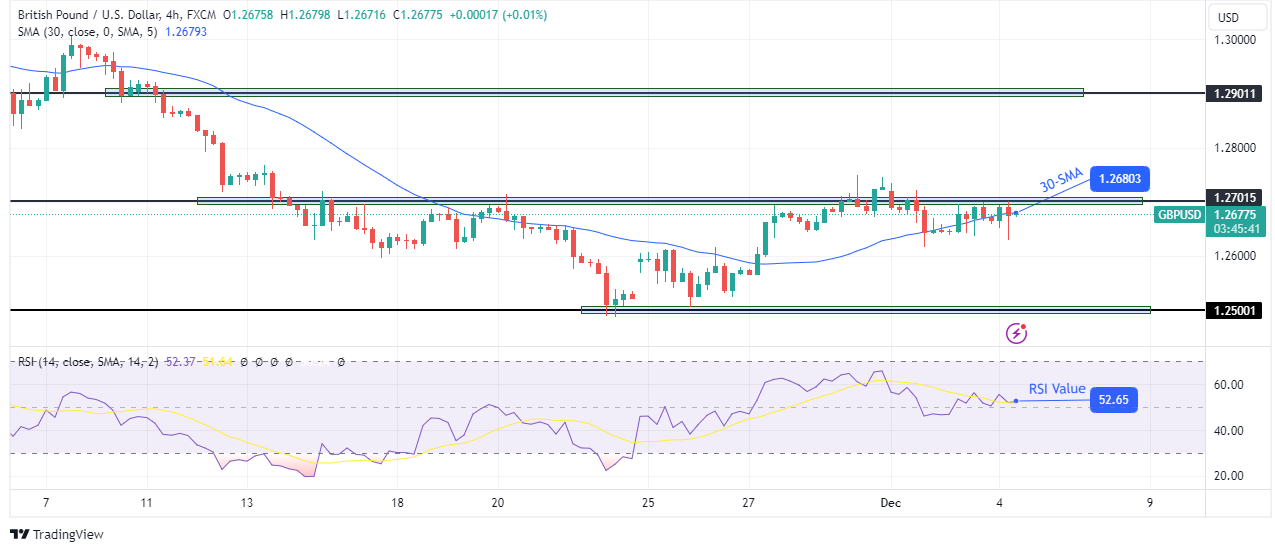
On the technical side, the GBP/USD price has bounced off the 30-SMA but failed to breach the 1.2701 resistance level. Bulls took over when the downtrend paused at the 1.2500 support level. The price broke above the 30-SMA and made a new high slightly above the 1.2701 resistance level.
-Are you looking for the best MT5 Brokers? Check our detailed guide-
From here it retested the 30-SMA as support and remained attached to the line. A surge in bullish momentum will allow the price to break above 1.2701 to continue the uptrend. Otherwise, it might break below the SMA to retest the 1.2500 support.
Looking to trade forex now? Invest at eToro!
75% of retail investor accounts lose money when trading CFDs with this provider. You should consider whether you can afford to take the high risk of losing your money.
Important DisclaimersThe content provided on the website includes general news and publications, our personal analysis and opinions, and contents provided by third parties, which are intended for educational and research purposes only. It does not constitute, and should not be read as, any recommendation or advice to take any action whatsoever, including to make any investment or buy any product. When making any financial decision, you should perform your own due diligence checks, apply your own discretion and consult your competent advisors. The content of the website is not personally directed to you, and we does not take into account your financial situation or needs.The information contained in this website is not necessarily provided in real-time nor is it necessarily accurate. Prices provided herein may be provided by market makers and not by exchanges.Any trading or other financial decision you make shall be at your full responsibility, and you must not rely on any information provided through the website. FX Empire does not provide any warranty regarding any of the information contained in the website, and shall bear no responsibility for any trading losses you might incur as a result of using any information contained in the website.The website may include advertisements and other promotional contents, and FX Empire may receive compensation from third parties in connection with the content. FX Empire does not endorse any third party or recommends using any third party’s services, and does not assume responsibility for your use of any such third party’s website or services.FX Empire and its employees, officers, subsidiaries and associates, are not liable nor shall they be held liable for any loss or damage resulting from your use of the website or reliance on the information provided on this website.Risk DisclaimersThis website includes information about cryptocurrencies, contracts for difference (CFDs) and other financial instruments, and about brokers, exchanges and other entities trading in such instruments. Both cryptocurrencies and CFDs are complex instruments and come with a high risk of losing money. You should carefully consider whether you understand how these instruments work and whether you can afford to take the high risk of losing your money.FX Empire encourages you to perform your own research before making any investment decision, and to avoid investing in any financial instrument which you do not fully understand how it works and what are the risks involved.
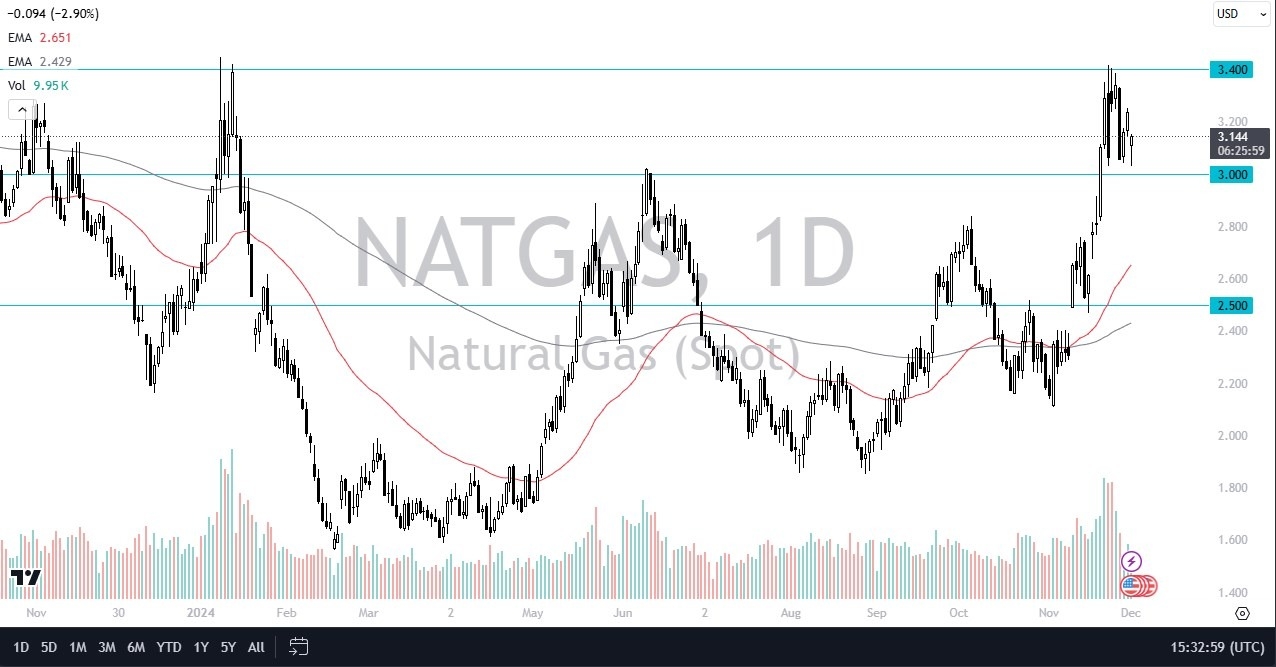
There is a cyclical trade to be had here, as it is typical for the winter months to bring in more demand for natural gas for heating. Most of the northeastern part of the United States uses natural gas for heating, or at least some type of other gas such as propane, so these markets do tend to move somewhat in tandem. Ultimately, I think you’ve got a situation where natural gas will continue to be thought of as a potential value play, at least on each and every dip.

The cycle will end sooner or later, but it is worth noting that the market participants out there will probably continue to push this market higher over the next month or 2. After a while, then you have to start looking at the futures markets that are pricing in spring temperatures, which obviously will start to warm up and therefore it makes a certain amount of sense that the market will start to fall again. This is something I do every year, and the share of course will be any different. The market had been somewhat straight up in the air for a while, so a little bit of consolidation between the $3.00 level and the $3.40 level, certainly makes a certain amount of sense. After all, the $3.40 level had been a massive barrier previously.
Ready to trade daily Forex analysis? We’ve made a list of the best commodity broker platforms worth trading with.
UK inflation surged from 1.7% to 2.3% in November, but GBPUSD remains under pressure due to the Bank of England’s gradual interest rate cut plan. The dollar’s continued strength weighs heavily on the pound, alongside recent drops in manufacturing and services PMI metrics, which have fallen below the critical 50-expansion mark. This combination creates a strong bearish outlook on broader charts. However, key support levels outlined below may influence near-term moves.
For the yen, critical levels against the dollar are once again in focus, with BOJ intervention risks rising if the yen surpasses the 157 and 160 marks. Volatility risks are anticipated with key upcoming events such as the FOMC minutes, US Core PCE, unemployment claims, GDP, and Tokyo Core CPI.
As per BOJ Governor Ueda’s remarks, policies will adjust in response to economic developments. Notably, the services producer price index has risen back to 2.9%, near its yearly high of 3%, aligning with nine-year highs. This keeps speculation alive for a potential rate hike drift. Meanwhile, Tokyo CPI dropped below 2% to 1.8% in October, its first dip since May, and further confirmation from Friday’s data will be closely watched.

Ceasefire resolutions and escalating war headlines have fluctuated for months, with painful reversals on each deal attempt. The path toward resolving conflicts involving Russia-Ukraine and Israel-Lebanon remains uncertain. This uncertainty sustains upside risk potential for oil within the $72-$76 range until feasible solutions emerge.
The upcoming OPEC meeting on Sunday is expected to leave production quotas unchanged, reflecting risk assessments for 2025 demand-supply levels and weak oil price trends.


Source: Tradingview
While headlines can spur critical oil price movements, current price action remains bound within the $72-$76 resistance range and $68-$64 support range.
2025 Sentiment
The overall chart leans bearish due to risks from US oversupply, Chinese contracting demand, and OPEC production quota adjustments. However, unless there is a decisive break and close below the $64 support, upside risk remains present.
Scenarios
Bullish: A firm close above $72 and $76 could extend the rally to $80 and $84, possibly establishing a longer-term uptrend
Bearish: A firm close below $64 could drive the bear trend, targeting $58 and $49, continuing the decline since the 2022 highs.

Source: Tradingview
The GBP/JPY pair is currently exhibiting a bearish inclination, influenced by a weakening British pound and potential intervention by the Bank of Japan (BOJ) to support the yen. The 3-month price action is leaning towards bearish dominance, with an overbought RSI retesting levels previously seen in 2007 and 1998.
The overall breakout of the GBPJPY pair from the consolidating pattern across its history leans towards a longer-term bull run, yet a pullback down towards the borders of the consolidation may be possible.
The scenarios are the following
Bearish Scenario: a close below the 183-support zone can ignite a pullback towards support levels 172 and 155
Bullish Scenario: a close above the 208 high can extend the bull run towards potential resistance levels 223 and 251
— Written by Razan Hilal, CMT – on X: @Rh_waves
SHANGHAI – Copper prices could fall towards $8 500 a metric ton within the next four months on expectations that demand will be hurt by potential trade disruptions when Donald Trump returns to the White House in January, copper industry participants said.
Benchmark three-month copper on the London Metal Exchange (LME) CMCU3 was traded at $8 915 a ton at 08:52 GMT, having shed 8% in less than 10 days since Trump won the US Presidential election.
The pressure on prices reflects heightened concerns around the impact on growth from potential trade policy from the new U.S. administration, analyst Nicholas Snowdon of Mercuria Energy Trading told the CRU World Copper Conference Asia.
Near-term prices are also being suppressed by the weight of inventory, Snowdon said, forecasting a surplus of nearly half a million tons in the first quarter of 2025 due to stock build-up during the Chinese New Year holiday starting in late January and demand weakness in the West.
“It is quite feasible that by March, we will be sitting on global cathode stocks of just over a million tons,” he said.
LME copper could fall to $8,500 by the end of the first quarter next year, most traders, producers, brokers and analysts surveyed by Reuters said during the annual copper industry gathering this week in Shanghai.
Others at the event said they expect prices to range between $9 000 to $9 500 next year, citing similar fundamentals to 2024.
A strong dollar, boosted by its safe haven status, will also make dollar-priced copper more expensive to holders of other currencies, said a broker and an analyst.
Citi analysts on Wednesday revised down their copper price forecast to $8 500 a ton within three months, from $9 500 previously, due to likely US trade tariff hikes and weaker-than-expected Chinese stimulus so far.
But prices are unlikely to fall below $8 500 because buyers would snap up copper at that level, which is more than 20% below the historic high hit in May this year of $11 104.50, a China-based analyst said.
Project Blue analyst Jonathan Barnes said LME copper prices could average between $9 300 to $9 400 over the next three months, with a near-term dip towards $8 500 possible as markets digest the implications of a Trump presidency, with 2025 prices seen averaging between $9 475 and $9 575.
In the longer-term, prices are likely to be supported by demand driven by possible Chinese stimulus moves next year, analysts said.
Copper prices are also cushioned by disruptions in mine supply, with analysts forecasting a deficit next year to range from 500,000 tons to above one-million tons, forcing smelters to cut cathode output.
CRU expects the copper price to recover to $10 000 by the end of March 2025 and potentially hit $15 000 by 2029, backed by energy transition demand and mine supply tightness.
“In the near term (there is) downside risk for price, but the structural story is not dead … and we do see that starting to prevail more through the mid-second half of next year,” Mercuria’s Snowdon said.