The main category of Forex News.
You can use the search box below to find what you need.
[wd_asp id=1]
The main category of Forex News.
You can use the search box below to find what you need.
[wd_asp id=1]
The Bank of Japan is expected to release a policy review later this month, just a day after the FOMC rate decision, and JPY-strength has started to show more prominently against most major currencies.
In USD/JPY, the US Dollar hasn’t been very weak over the past few weeks, but JPY strength has started to take on greater prominence of late. The pair set a fresh high on November 15th as USD-strength drove after the U.S. Presidential election. Resistance eventually showed at the 76.4% Fibonacci retracement of the July-September sell-off; but a week later, as USD jumped up to a fresh two-year-high in DXY, USD/JPY lagged, setting a lower-high and building within the confines of a descending triangle formation.
I looked at that formation in last week’s webinar, just ahead of the U.S. holiday, and that formation filled in later that day and continued to see bears go to work as USD/JPY drove below 151.95, 150.77 and, eventually, the 150.00 handle.
And even today, to start the week, DXY is showing a bounce up to the 106.51-106.88 zone and USD/JPY is much less decisive, showing currently as a doji on the daily. This illustrates Yen-strength against the USD.
Chart prepared by James Stanley, USD/JPY on Tradingview
From the daily chart, we can see where there’s been quite a few inflections from the July-September Fibonacci retracement. The current high shows right at the 76.4% retracement, and last week’s support for the descending triangle was right around the 61.8% marker. The 50% level from that same retracement setup was support last Wednesday and then resistance to start this week, and that also points out the 38.2% retracement level as a deeper support, plotted around the 148.13 level.
But the bigger question is whether USD/JPY is an optimal venue to seek out that Yen-strength as the US Dollar has been strong against many currencies recently, especially the Euro which is back below the 1.0500 handle.

 Chart prepared by James Stanley, USD/JPY on Tradingview
While the USD remains very near recently-established two-year-highs, it’s been a far tougher road for the Euro.
I focused in on the difference between EUR/JPY and USD/JPY a couple weeks ago and at the time, USD/JPY still had bullish scope. EUR/JPY, on the other hand, had just set a fresh lower-low and was holding resistance at a big spot on the chart. There was also a relationship with the 200-day moving average, where EUR/JPY was trading below its 200-dma while USD/JPY and even GBP/JPY held above their own.
But since then, Yen-strength has returned in a big way and now all three pairs are now operating below their 200-day moving averages. As the descending triangle in USD/JPY broke down last week, EUR/JPY had even more steam as Euro-weakness was meshed with Yen-strength. And while the trend has been clean and aggressive, the pair is now showing oversold conditions on the daily chart, which can make it difficult to chase, at this point. Support is currently showing at the trendline projection, taken from August and September swing lows.
 Chart prepared by James Stanley, EUR/JPY on Tradingview
Oversold conditions on the daily chart do not necessarily preclude bearish continuation scenarios. It does make the prospect of chasing prices lower a bit more daunting, but a look at the trend over the past couple of weeks shows healthy two-way price action, and that’s something that can be tracked for those looking to take the trend-lower.
There was a support bounce around the 158.04-158.24 zone, and that remains of note as there hasn’t yet been a resistance test at that prior support. Inside of that, a Fibonacci level plots at 157.31 and that’s similarly of note, as that’s the 76.4% retracement from a major move that showed support at the 38.2, 50 and 61.8% retracements.
That 61.8% retracement of prior support is also of interest if bulls can stretch a pullback, and that plots at 159.10. Even the 160.00 level could be of interest and as I highlighted in the video, the key there would be bears defending the prior swing high at 160.34. If they fail to hold the lows below that price, then the prospect of a larger retracement or pullback move will look more prominent and at that point, bears will likely want to re-assess.
 Chart prepared by James Stanley, EUR/JPY on Tradingview
— written by James Stanley, Senior Strategist
Following Monday’s sharp decline, GBP/USD recovered modestly on Tuesday. The pair continues to edge higher toward 1.2700 in the early European session on Wednesday.
The table below shows the percentage change of British Pound (GBP) against listed major currencies this week. British Pound was the strongest against the Australian Dollar.
| USD | EUR | GBP | JPY | CAD | AUD | NZD | CHF | |
|---|---|---|---|---|---|---|---|---|
| USD | 0.60% | 0.43% | 0.38% | 0.53% | 1.12% | 1.08% | 0.65% | |
| EUR | -0.60% | -0.21% | -0.22% | -0.06% | 0.60% | 0.48% | 0.08% | |
| GBP | -0.43% | 0.21% | -0.02% | 0.15% | 0.83% | 0.70% | 0.27% | |
| JPY | -0.38% | 0.22% | 0.02% | 0.15% | 0.77% | 0.72% | 0.22% | |
| CAD | -0.53% | 0.06% | -0.15% | -0.15% | 0.75% | 0.55% | 0.12% | |
| AUD | -1.12% | -0.60% | -0.83% | -0.77% | -0.75% | -0.13% | -0.53% | |
| NZD | -1.08% | -0.48% | -0.70% | -0.72% | -0.55% | 0.13% | -0.40% | |
| CHF | -0.65% | -0.08% | -0.27% | -0.22% | -0.12% | 0.53% | 0.40% |
The heat map shows percentage changes of major currencies against each other. The base currency is picked from the left column, while the quote currency is picked from the top row. For example, if you pick the British Pound from the left column and move along the horizontal line to the US Dollar, the percentage change displayed in the box will represent GBP (base)/USD (quote).
The data from the US showed on Tuesday that JOLTS Job Openings for October rose to 7.74 million from 7.37 million in September. This reading came in above the market expectation of 7.48 million and helped the US Dollar (USD) stay resilient against its rivals, limiting GBP/USD’s upside.
Bank of England Governor Andrew Bailey will speak at the Financial Times Live Global Boardroom at 09:00 GMT on Wednesday. Later in the day, ADP Employment Change and ISM Services PMI data for November will be featured in the US economic docket.
Investors expect the private sector employment to rise by 150,000. A positive surprise, with a reading at or above 200,000, could boost the USD with the immediate reaction. On the other hand, a print below 100,000 could revive concerns over worsening conditions in the labor market and hurt the USD.
In the American session, Federal Reserve Chairman Jerome Powell will participate in a moderated discussion at the New York Times DealBook Summit, starting at 18:45 GMT. The CME FedWatch Tool shows that markets are currently pricing in a nearly 75% probability of a 25 basis points (bps) rate cut in December. In case Powell leaves the door open for a policy hold, the USD could gather strength against its rivals and force GBP/USD to turn south.
The Relative Strength Index (RSI) indicator on the 4-hour chart holds slightly above 50 and GBP/USD managed to hold above the 100-period Simple Moving Average (SMA) after testing this level several times since Tuesday, highlighting sellers’ hesitancy.
Looking north, resistances could be spotted at 1.2700 (Fibonacci 38.2% retracement of the latest downtrend), 1.2750 (Fibonacci 50% retracement) and 1.2810-1.2800 (Fibonacci 61.8% retracement, 200-period SMA). On the downside, immediate support is located at 1.2650 (100-period SMA) before 1.2630-1.2620 (50-period SMA, Fibonacci 23.6% retracement) and 1.2600 (round level, static level).
The Pound Sterling (GBP) is the oldest currency in the world (886 AD) and the official currency of the United Kingdom. It is the fourth most traded unit for foreign exchange (FX) in the world, accounting for 12% of all transactions, averaging $630 billion a day, according to 2022 data. Its key trading pairs are GBP/USD, also known as ‘Cable’, which accounts for 11% of FX, GBP/JPY, or the ‘Dragon’ as it is known by traders (3%), and EUR/GBP (2%). The Pound Sterling is issued by the Bank of England (BoE).
The single most important factor influencing the value of the Pound Sterling is monetary policy decided by the Bank of England. The BoE bases its decisions on whether it has achieved its primary goal of “price stability” – a steady inflation rate of around 2%. Its primary tool for achieving this is the adjustment of interest rates. When inflation is too high, the BoE will try to rein it in by raising interest rates, making it more expensive for people and businesses to access credit. This is generally positive for GBP, as higher interest rates make the UK a more attractive place for global investors to park their money. When inflation falls too low it is a sign economic growth is slowing. In this scenario, the BoE will consider lowering interest rates to cheapen credit so businesses will borrow more to invest in growth-generating projects.
Data releases gauge the health of the economy and can impact the value of the Pound Sterling. Indicators such as GDP, Manufacturing and Services PMIs, and employment can all influence the direction of the GBP. A strong economy is good for Sterling. Not only does it attract more foreign investment but it may encourage the BoE to put up interest rates, which will directly strengthen GBP. Otherwise, if economic data is weak, the Pound Sterling is likely to fall.
Another significant data release for the Pound Sterling is the Trade Balance. This indicator measures the difference between what a country earns from its exports and what it spends on imports over a given period. If a country produces highly sought-after exports, its currency will benefit purely from the extra demand created from foreign buyers seeking to purchase these goods. Therefore, a positive net Trade Balance strengthens a currency and vice versa for a negative balance.
Our featured currency pair of the week is the USD/JPY. The pair fell in November even as the dollar index rose for the second consecutive month. Last week saw the dollar come under pressure, as major pairs such as the EUR/USD and GBP/USD staged a relief bounce. The yen was the biggest performer last week, underscoring expectations about a potential rate hike from the Bank of Japan, just as the world’s other central banks are now on the easing path. But now it has arrived at a key technical support area of around 150.00 ahead of critical US economic releases this week. With a jam-packed calendar including, ISM Manufacturing and Services PMIs, the closely watched JOLTS Job Openings report, and the monthly Non-Farm Payrolls report to come, traders are bracing for volatility. These data points are expected to influence the USD/JPY forecast, especially with both the Fed and BoJ policy decisions looming in December.
The yen is gaining traction as speculation mounts that the Bank of Japan might raise rates in December. This expectation isn’t just bolstering the yen against the dollar; it’s also pressuring other pairs like EUR/JPY, which recently dropped below 160.00 and is now flirting with the 157.00 zone. The euro’s struggles, tied to Europe’s ongoing economic and political issues, amplify the yen’s strength.
But it looks like speculators are trying to ride the yen rally. Last week, large speculators piled into long positions on the yen amid renewed expectations of a 25 basis point hike from the Bank of Japan this month. Notably, large speculators reduced short positions and ramped up long exposure by more than 23%, adding nearly 15K contracts to their bullish bets.
Looking ahead to this first week of December, all eyes are on pivotal US economic indicators. While ISM PMIs will provide clues about the health of the world’s largest economy, the JOLTS report could take centre stage as the Federal Reserve zeroes in on employment trends. Signs of weakness in these reports might tilt the odds toward a December rate cut, currently priced with a 65% probability.
Meanwhile, the November jobs report, due Friday, will be the headline event. After last month’s unexpectedly strong figures and the political shift from Trump’s re-election, expectations for aggressive Fed cuts in 2025 have waned. Whether the Fed decides to cut rates in its final 2024 meeting could hinge on this critical data, setting the tone for USD/JPY’s trajectory into the new year.
Here is a list of key data highlights from the US and what to expect:


Source: TradingView.com
Last week’s drop in USD/JPY underscores a possible key swing low for the yen, potentially setting the stage for further recovery in the yen. But for that to happen, the USD/JPY will need to stage a decisive break below the key 150.00 support level.
Previously a strong resistance area, this level now serves as a battleground. A rebound here could see the pair testing the 200-day moving average and targeting resistance around 151.30-152.00.
However, if support fails—marked by a decisive daily close below the 149.40-150.00 range—a sharper decline towards 147.20 or even 144.53 (the next potential support levels) may follow. This scenario would paint a more bearish-leaning technical USD/JPY forecast heading into the two central bank meetings later this month.
— Written by Fawad Razaqzada, Market Analyst
Follow Fawad on Twitter @Trader_F_R
Gold price is holding onto minor bids early Wednesday, struggling to build on the previous bounce, anticipating a fresh batch of top-tier US economic data releases and Federal Reserve (Fed) Chairman Jerome Powell’s speech.
Tuesday’s US JOLTs Job Openings data indicated a stronger-than-expected labor market after rising to 7.744 million in the reported period. Data surpassed the expected 7.48M increase. The upbeat labor data from the US briefly lifted the US Dollar (USD) across the board, capping the Gold price rebound near $2,655.
However, Gold buyers retained control as the Greenback failed to sustain the uptick. The data failed to alter the market’s expectations of a 25 basis points (bps) interest rate cut by the Fed later this month. Markets are currently pricing at a 73% probability of a Dec Fed rate reduction, the CME Group’s FedWatch Tool shows, more or less the same as a day ago.
In Wednesday’s trading so far, Gold price is struggling to extend its upside as the USD remains in demand due to a risk-averse market environment. China’s economic concerns and US-Sino trade tensions continue to dent risk sentiment. China’s Caixin Services PMI unexpectedly dropped to 51.5 in November against the expected increase to 52.5 following October’s 52.0 figure.
On Tuesday, China’s Commerce Ministry announced a ban on exports of dual-use items related to gallium, germanium, antimony and superhard materials to the US with immediate effect, in response to the latest crackdown on China’s chip sector by US President Joe Biden’s administration.
If risk-aversion intensifies, Gold price could face a tailwind effect as it is considered a traditional safety net. However, the next directional move in Gold price hinges on the US ADP Employment Change data and Fed Chair Powell’s speech. The US private sector is expected to see a job gain of 150K in November, compared to 233K in October.
A worse-than-expected labor data could revive expectations of future Fed rate cuts beyond December, fuelling a fresh advance in the non-interest-bearing Gold price. But any reaction to the US data is likely to be shorted-lived as Powell’s words are set to shape up the market expectations of the Fed’s easing trajectory, influencing Gold price action in the lead-up to Friday’s US Nonfarm Payrolls data.
It’s worth mentioning that it will be Powell’s last appearance before the Fed enters the ‘blackout period’ on December 7 ahead of the December 17-18 policy meeting.
The daily chart shows that Gold’s price extends its struggle with critical short-term 21-day Simple Moving Average (SMA), now at $2,636.
The 14-day Relative Strength Index (RSI) sits listlessly beneath the 50 level, indicating a lack of clear directional bias.
However, the previous week’s Bear Cross warrants caution for Gold buyers.
Therefore, Fed Chair Jerome Powell’s words are likely critical for the next directional move in Gold price.
Recapturing the 21-day SMA support-turned-resistance at $2,636 is critical for buyers to revive the recovery momentum.
The next relevant resistance aligns at the 50-day SMA at $2,669, above which the $2,700 level will be in sight.
On the downside, Gold sellers need to crack the $2,621 static support to challenge the previous week’s low of $2,605.
A sustained break of that level could expose the 100-day SMA at $2,579.
Jerome H. Powell took office as a member of the Board of Governors of the Federal Reserve System on May 25, 2012, to fill an unexpired term. On November 2, 2017, President Donald Trump nominated Powell to serve as the next Chairman of the Federal Reserve. Powell assumed office as Chair on February 5, 2018.
Next release: Wed Dec 04, 2024 18:45
Frequency: Irregular
Consensus: –
Previous: –
Source: Federal Reserve
EUR/USD is falling at the start of the week after strong gains last week as the US dollar rebounds and amid French political uncertainty.
France’s far-right National Party has given Prime Minister Michel Barnier until today to accept the party’s demands for concessions in the proposed Budget, which Barnier is attempting to push through the fragile coalition government.
Barnier is between a rock and a hard place. If he fails to give in, the RN threatens to call a vote of no confidence, which will almost certainly collapse the government. However, if he does give in, high spending will keep the country in an economically fragile position.
French borrowing costs have risen to the highest level against German borrowing costs since the 2012 crisis. The CAC is also falling sharply lower.
Meanwhile, eurozone manufacturing PMI data was confirmed at 45.2, deepening contraction in the sector. The downturn remains widespread, with manufacturing activity deteriorating across major economies, including Germany and France, which recorded the lowest readings.
Separately, the US dollar is rebounding on safe-haven flows after President Trump threatened BRICS countries with 100% trade tariffs should they threaten the USD’s dominance.
Attention is also on the Federal Reserve ahead of a busy week for U.S. economic data, terminating with the nonfarm payroll report on Friday. The data comes as the Fed weighs up whether to cut rates this month after two consecutive rate reductions. The market is pricing in a 66% probability of a 25 basis point rate cut in December.
In addition to data, several Fed officials are due to speak this week, including Fed Chair Jerome Powell, on Wednesday.
EUR/USD rebounded from a low of 1.0330 but failed to retake the 1.06 or 1.07 levels necessary to negate the steep downtrend from 1.12 reached at the end of September. This, combined with the RSI below 50, keeps sellers in the driving seat.
Sellers will look to break below 1.05 to retest 1.0450, the 2023 low. A break below 1.0330 is needed to create a lower low.
Buyers need to retake 1.06 to have any chance of building a base higher.
The FTSE is trading flat as investors weigh off encouraging Chinese manufacturing data, political instability in France, and disappointing UK manufacturing PMIs.
Data from China showed that manufacturing activity grew at the strongest pace in five months. The cakes in manufacturing PMI rose to 51.5 in November when I had a forecast of 50.5. Manufacturers’ new orders are growing at the fastest pace in three years, suggesting that recent stimulus efforts are already seeping into the economy.
The good news is helping to lift miners, with Anglo American and Rio Tinto trading around 1% higher.
Meanwhile, the UK manufacturing PMI was slightly more disappointing, sinking to 48 in November, down from 49.9 in October, marking a nine-month low as new orders dry up. Headwinds from a rise in employment taxes following the New Labour government’s budget, a 7% rise in the minimum wage, disruption to shipping in the Red Sea, and threats to global goods tariffs have created a challenging environment for manufacturers.
Also, keeping a lid on any gains or concerns over the political situation in France, where Barnier’s government holds on by a thread.
The FTSE continues to trade within a familiar range, capped on the upside by 8325 and 8150 on the lower side.
While the FTSE has recovered from the November low of 8000, rising above the 200 SMA and the 50 SMA, buyers will need to break out above 8325 to bring 8400 into target and 8480, the all-time high.
Immediate support is seen at 8230 the 50 SMA. Below here 8150 comes back into play, which is also the 50 SMA.

EUR/USD started the week on a bearish noted and dropped below 1.0500 on Monday. The pair holds its ground early Tuesday but shows no signs of a steady recovery.
The table below shows the percentage change of Euro (EUR) against listed major currencies this week. Euro was the weakest against the US Dollar.
| USD | EUR | GBP | JPY | CAD | AUD | NZD | CHF | |
|---|---|---|---|---|---|---|---|---|
| USD | 0.67% | 0.54% | 0.10% | 0.34% | 0.45% | 0.59% | 0.74% | |
| EUR | -0.67% | -0.17% | -0.55% | -0.32% | -0.13% | -0.07% | 0.09% | |
| GBP | -0.54% | 0.17% | -0.42% | -0.18% | 0.05% | 0.09% | 0.23% | |
| JPY | -0.10% | 0.55% | 0.42% | 0.24% | 0.37% | 0.49% | 0.56% | |
| CAD | -0.34% | 0.32% | 0.18% | -0.24% | 0.27% | 0.24% | 0.38% | |
| AUD | -0.45% | 0.13% | -0.05% | -0.37% | -0.27% | 0.05% | 0.18% | |
| NZD | -0.59% | 0.07% | -0.09% | -0.49% | -0.24% | -0.05% | 0.16% | |
| CHF | -0.74% | -0.09% | -0.23% | -0.56% | -0.38% | -0.18% | -0.16% |
The heat map shows percentage changes of major currencies against each other. The base currency is picked from the left column, while the quote currency is picked from the top row. For example, if you pick the Euro from the left column and move along the horizontal line to the US Dollar, the percentage change displayed in the box will represent EUR (base)/USD (quote).
The risk-averse market atmosphere helped the US Dollar (USD) gather strength against its rivals and weighed on EUR/USD on Monday. Additionally, political woes in France further weighed on the Euro. “The French government is all but certain to collapse later this week after far-right and left-wing parties submitted no-confidence motions on Monday against Prime Minister Michel Barnier,” Reuters reported.
Meanwhile, the potential monetary policy divergence between the Federal Reserve (Fed) and the European Central Bank (ECB) doesn’t allow the pair to gain traction.
Atlanta Fed President Bostic said late Monday that he is undecided on whether a rate cut is needed in December. On a similar note, “one could argue a case for skipping a rate cut in December, will be watching data closely to decide,” NY Fed President John Williams noted. On the flip side, ECB policymaker Martins Kazaks argued that the inflation problem will soon end and added that rate cuts must continue.
In the second half of the day, the US Bureau of Labor Statistics will publish JOLTS Job Openings data for October. A significant negative surprise, with a reading at or below 7 million, could hurt the USD with the immediate reaction and help EUR/USD edge higher.
EUR/USD dropped below 1.0520, where the Fibonacci 23.6% retracement of the latest downtrend is located. While this level holds as resistance, technical sellers could remain interested. On the downside, supports could be seen at 1.0440 (static level) and 1.0400 (end-point of the downtrend, static level).
In case EUR/USD rises above 1.0520, next hurdle is located at 1.0545 (100-period Simple Moving Average (SMA) on the 4-hour chart) ahead of 1.0600 (Fibonacci 38.2% retracement).
The Euro is the currency for the 19 European Union countries that belong to the Eurozone. It is the second most heavily traded currency in the world behind the US Dollar. In 2022, it accounted for 31% of all foreign exchange transactions, with an average daily turnover of over $2.2 trillion a day. EUR/USD is the most heavily traded currency pair in the world, accounting for an estimated 30% off all transactions, followed by EUR/JPY (4%), EUR/GBP (3%) and EUR/AUD (2%).
The European Central Bank (ECB) in Frankfurt, Germany, is the reserve bank for the Eurozone. The ECB sets interest rates and manages monetary policy. The ECB’s primary mandate is to maintain price stability, which means either controlling inflation or stimulating growth. Its primary tool is the raising or lowering of interest rates. Relatively high interest rates – or the expectation of higher rates – will usually benefit the Euro and vice versa. The ECB Governing Council makes monetary policy decisions at meetings held eight times a year. Decisions are made by heads of the Eurozone national banks and six permanent members, including the President of the ECB, Christine Lagarde.
Eurozone inflation data, measured by the Harmonized Index of Consumer Prices (HICP), is an important econometric for the Euro. If inflation rises more than expected, especially if above the ECB’s 2% target, it obliges the ECB to raise interest rates to bring it back under control. Relatively high interest rates compared to its counterparts will usually benefit the Euro, as it makes the region more attractive as a place for global investors to park their money.
Data releases gauge the health of the economy and can impact on the Euro. Indicators such as GDP, Manufacturing and Services PMIs, employment, and consumer sentiment surveys can all influence the direction of the single currency. A strong economy is good for the Euro. Not only does it attract more foreign investment but it may encourage the ECB to put up interest rates, which will directly strengthen the Euro. Otherwise, if economic data is weak, the Euro is likely to fall. Economic data for the four largest economies in the euro area (Germany, France, Italy and Spain) are especially significant, as they account for 75% of the Eurozone’s economy.
Another significant data release for the Euro is the Trade Balance. This indicator measures the difference between what a country earns from its exports and what it spends on imports over a given period. If a country produces highly sought after exports then its currency will gain in value purely from the extra demand created from foreign buyers seeking to purchase these goods. Therefore, a positive net Trade Balance strengthens a currency and vice versa for a negative balance.

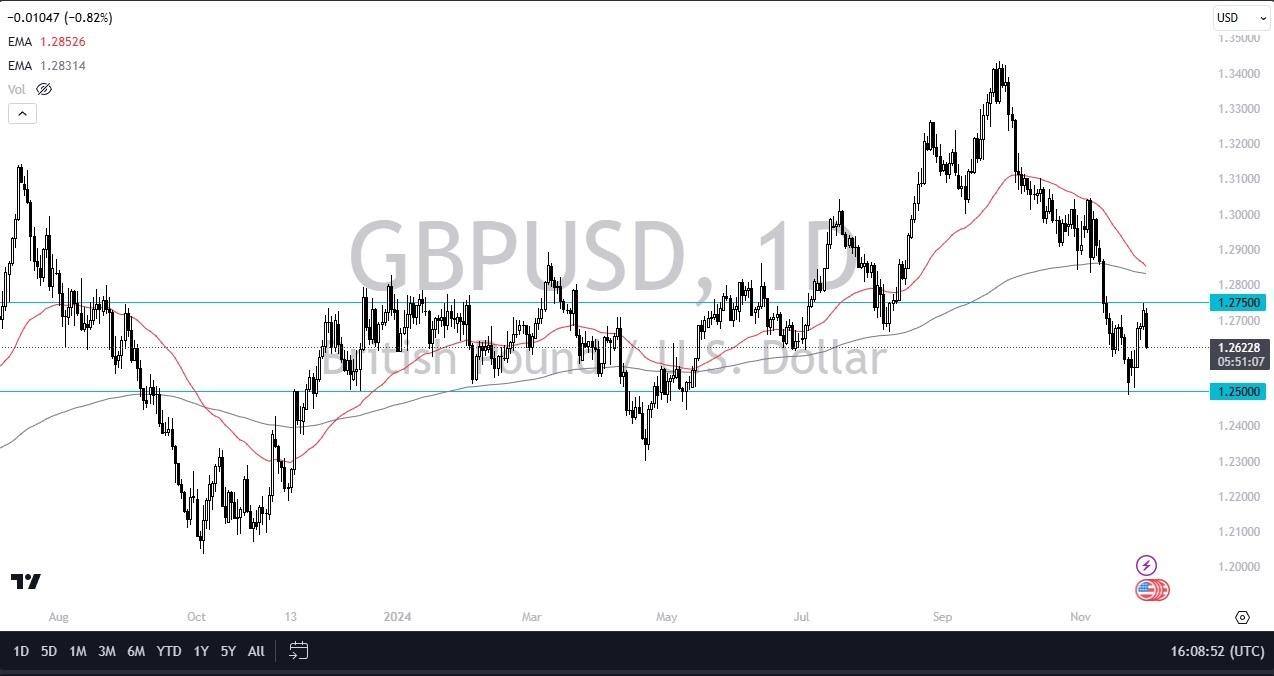
The consolidation has been somewhat obvious between the 1.25 level on the bottom, and the 1.2750 level on the top. The size of the candlestick on Monday is rather ugly, and that does suggest that a lot of people will be running to the US dollar again. Quite frankly, the downtrend has been formally ensconced, so at this point in time I don’t see any reason to think that the trend will change easily. However, like I said, if we were to break above the 1.2750 level, then I would have to reconsider some things.
If we were to break down below the 1.25 level, then it opens up the possibility of a significant drop down to the 1.23 level. Interest rates continue to be an issue for the United States, despite the fact that a lot of market participants believe that the Federal Reserve is going to be cutting interest rates by 25 basis points during the month of December. Because of this, the market is likely to be very noisy, but I do think that eventually we will have to come to some type of conclusion. The conclusion could be in either direction, but as I think we have seen recently, it’s very difficult for this market to break out to the upside. Because of this, the market is likely to continue to see a lot of volatility, but sooner or later, we could see a rather large move.
Ready to trade our free trading signals? We’ve made a list of the best UK forex brokers worth using.
The US Dollar (USD) gained upward traction during American trading hours after spending the first half of the day on the back foot amid a better market mood. XAU/USD retreats from an intraday high of $2,655.50 but retains the $2640 mark at the time of writing, as the USD benefits from a deteriorated market mood.
The market sentiment deteriorated following the release of the United States (US) Job Openings and Labor Turnover Survey (JOLTS) Job Openings report, showing the number of openings in the last business day of October stood at 7.74 million, according to the report released by the US Bureau of Labor Statistics (BLS). The reading was higher than the 7.37 million openings in September and beat the market expectation of 7.48 million.
Fresh geopolitical tensions in Asia also undermine the mood. South Korean President Yoon Suk Yeol declared martial law. The army closed the Parliament while representatives voted to block the president’s declaration. The SK Won plunged vs the USD, providing the latter with fresh impetus. News coming from France are no better. The minority government seems to be on the brink of collapse, as opposition lawmakers from the left and the far right vowed to topple Prime Minister Michel Barnier’s Cabinet, according to AP news.
Meanwhile, US indexes trade in the red. Asian and European equities advanced, limiting USD strength, but Wall Street could not follow the lead. Even further, US government bond yields are back on the rise, underpinning the American currency.
Other than that, investors await more US employment-related data scheduled throughout the week. The November ADP report on private job creation is expected to show that 150K new positions were created in the sector on Wednesday. The most relevant figures will be out on Friday when the US will release the Nonfarm Payrolls (NFP) report.
From a technical point of view, the daily chart for XAU/USD shows the pair is pretty much unchanged from its opening and still confined to familiar levels. The Momentum indicator aims higher above its 100 level, but the Relative Strength Index (RSI) indicator heads nowhere at around 48. At the same time, the XAU/USD pair barely holds above a bearish 20 Simple Moving Average (SMA) while the 100 and 200 SMAs keep advancing below the current level, losing their former strength but still aiming north.
In the near term, and according to the 4-hour chart, XAU/USD offers a neutral-to-bearish stance. The pair keeps hovering around a directionless 20 SMA while midway between also flat 100 and 200 SMAs. Finally, technical indicators turned marginally lower right below their midlines, lacking strength enough to confirm another leg lower.
Support levels: 2,626.70 2,611.35 2,598.70
Resistance levels: 2,655.50 2,671.55 2,688.65
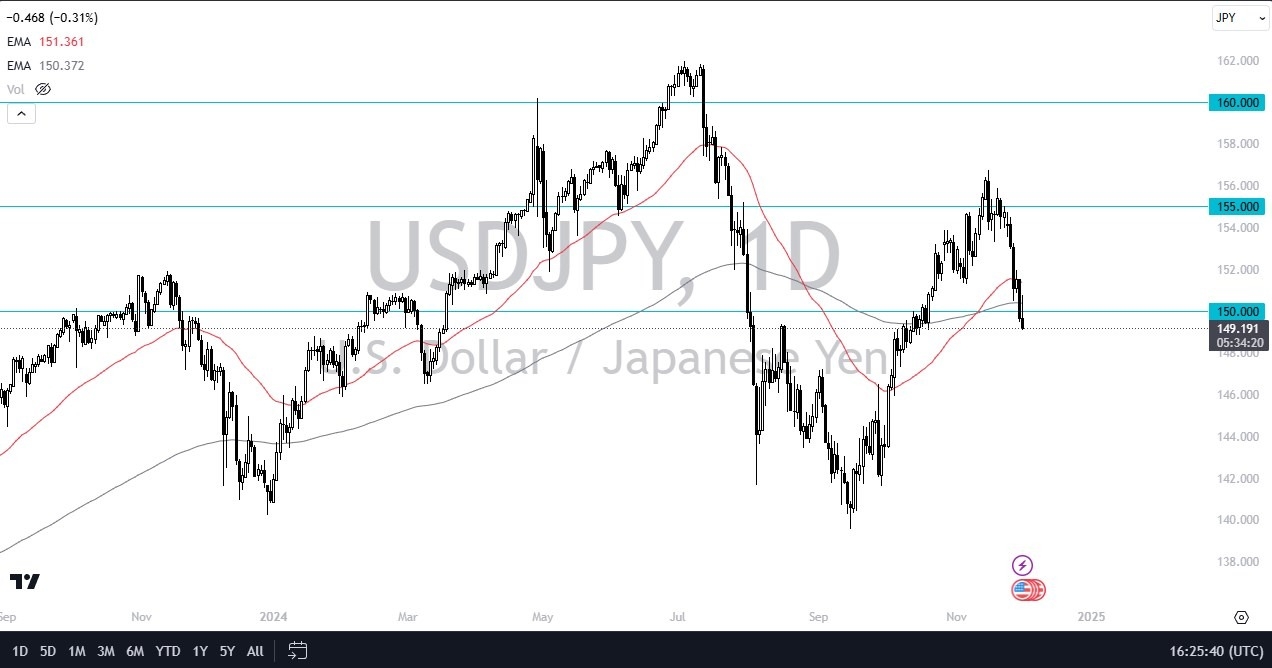
In general, this is a situation where traders continue to see concerns about the interest rate differential narrowing. Now, the bond market had a lot to say about that recently, but it looks like the bond market’s giving that up a little bit. As we are below the 150 yen level, now I think things are getting really interesting.
Whether or not we are done selling off remains to be seen, but you can still make an argument for an uptrend. This most recent swing high though, that could be an ominous sign. I suspect at this point, you’re probably better off waiting for some type of bounce to get involved. It just has the feel of a falling knife type of situation.
That doesn’t mean that the US dollar itself is going to do poorly, and I just think that in the realm of safety bid, US dollar is right up there, but it’s not the Japanese yen. If we can turn around and recapture the 50-day EMA close to the 151.33 yen level, then I think you start to look in the other direction again. I’m not necessarily looking to short this USD/JPY pair, I guess what I’m saying is, I’m just not looking to get long of it at this point in time, although over the longer-term, I will be looking to take advantage of the interest rate swap at the end of each day.
Want to trade our daily USD/JPY analysis and predictions? Here’s a list of forex brokers in Japan to check out.
EUR/USD is inching higher after steep losses in the previous session. The market is waiting cautiously for further developments in France and looks ahead to a big week for U.S. economic data.
PM Michel Barnier’s coalition government is on the brink of collapse, and he’s expected to face a vote of no confidence tomorrow, which he is unlikely to win. This could lead to further political uncertainty in the eurozone’s second-largest economy.
Political instability runs alongside a weak economic outlook. Yesterday’s PMI data showed that the region’s manufacturing sector recession continues and shows no sign of letting up.
Adding Trump’s threat of trade tariffs when he takes office in January to the mix, it’s hard to be anything but bearish towards the Euro.
EUR/USD parity wasn’t even a topic for conversation a few months ago. Now, it looks like a possibility in 2025
Separately, the US dollar is easing lower, giving back some of yesterday’s gains. The US dollar typically suffers seasonal weakness in December. However, following Donald Trump’s indication of support for a stronger dollar, that might not necessarily be the case this year.
Over the weekend, trump threatened tariffs, on BRIC members that weren’t committed to the USD as a reserve currency.
Attention today now turns to jolts job openings, which are expected to hold steady at 7.44 million.
The data comes ahead of a busy week for U.S. economic figures, including ADP payrolls, ISM services PMI, and Friday’s non-farm payroll report.
Strong data could see the market rein in fed rate cut expectations fella.
After running into resistance at 1.06, EUR/USD rebounded lower but found support at 1.0460, the 2023 low. The price trades caught between these levels. The RSI is below 50 and the 50 SMA crossed below the 200 SMA in a bearish signal.
Sellers will look to extend the 2-month bearish trend by taking out support at 1.0460 to brig 1.04 into focus ahead of 1.0330, the 2024 low.
Any recovery would need to rise above 1.06 to negate the trend and create a higher high. Above here, 1.07 comes into play.

Oil prices are rising in the European session but continued to trade in a narrow range ahead of the OPEC class policy meeting on Thursday.
The market is expecting the group of oil producers to delay its planned unwinding of production cuts beyond January 2025 in the hope of rebalancing the market and protecting prices. The outlook for supply surplus has put pressure on prices, meaning there is little option but to defer.
Yesterday, Chinese factory activity expanded, raising hopes that the oil demand outlook is improving as the recent stimulus measures seep through the economy. However, optimism over data from China is being offset by questions over the outlook for Fed rate cuts in the coming months.
Geopolitical tensions remain in focus in the Middle East after the US-brokered ceasefire deal between Israel and Hezbollah appears to be on shaky ground.
Attention now turns to US crude stockpiles which are expected to have fallen last week while gasoline and distillate inventories are forecast to have risen. API data is due today, and EIA inventory data will be released on Wednesday.
Oil continues to trade within a familiar range that it has traded within since September. The price is capped on the upside by 71.50 -72.50 and around 67 -67.50 on the downside. The RSI is neutral.
Sellers will want to wait from a break below 67.00 to enter a sell position, bringing 65.50, the 2024 low, into focus ahead of 63.50, the October 2023 low.
Should buyers rise above 72.50, bulls will look to 75.00 round number and 76.60 the 200 SMA.