The main category of Forex News.
You can use the search box below to find what you need.
[wd_asp id=1]
The main category of Forex News.
You can use the search box below to find what you need.
[wd_asp id=1]
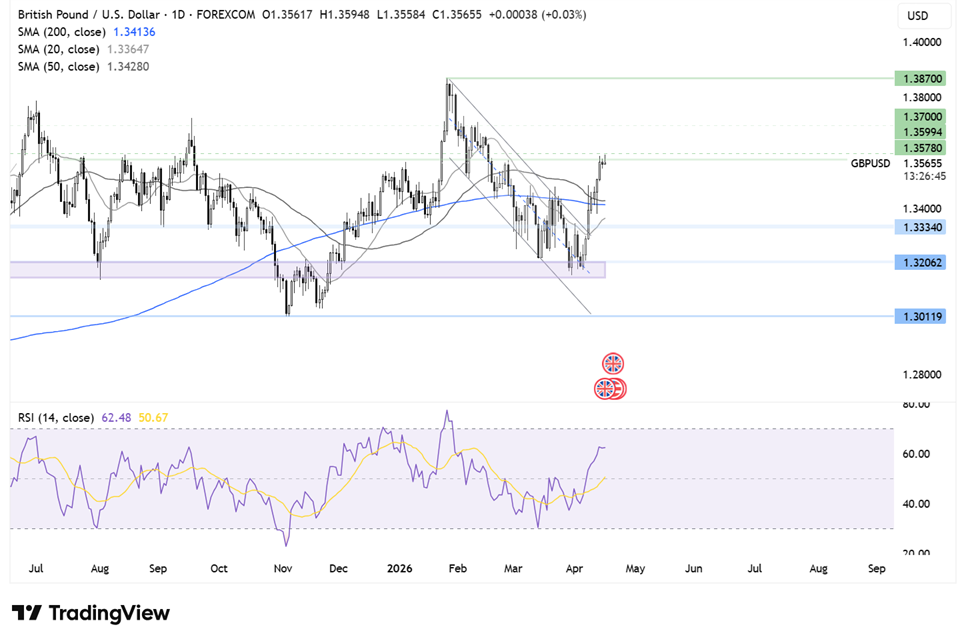
GBP/USD is edging higher, holding above 1.3550 and moving towards 1.3600, supported by US dollar weakness and stronger-than-expected UK GDP data.
The UK economy expanded by 0.5% month-on-month in February, well above the 0.1% forecast and up from an upwardly revised 0.1% in January. The data suggests the economy had solid momentum heading into the Iran conflict. The dominant services sector drove growth, marking a fourth consecutive monthly expansion, while production and construction also contributed positively.
However, further upside in sterling may be limited as the outlook has deteriorated since the onset of the Iran war. Rising energy prices and the UK’s reliance on imported energy pose downside risks. The International Monetary Fund has already downgraded UK growth to 0.8% for this year from 1.3%.
Despite potential stagflationary pressures, Andrew Bailey has indicated that the Bank of England will not rush to raise interest rates, stressing that the duration of the conflict will be a key determinant. Should the war de-escalate and oil prices stabilise, inflationary pressures may prove transitory, reducing the need for aggressive policy tightening.
Meanwhile, the US dollar remains under pressure, trading near a six-week low amid optimism over potential peace in the Middle East. President Trump has suggested that the conflict could end soon, with diplomatic efforts— including talks involving Israel and Lebanon—supporting risk sentiment.
Additionally, expectations that the Federal Reserve will keep interest rates unchanged are weighing on the dollar. US initial jobless claims are expected to edge higher to around 215,000, and attention will remain firmly on geopolitical developments.
GBP/USD found support at the 1.3150 support zone and recovered higher, rising above the falling channel and above the 200 SMA to resistance at 1.36. This, combined with the RSI above 50, keeps buyers optimistic of further upside.
A rise above 1.36 opens the door to further gains towards 1.37 before bringing 1.3870, the 2026 high, into focus.
Support is seen at 1.3420, the 200 SMA and below here at 1.3340, the January low comes into play.
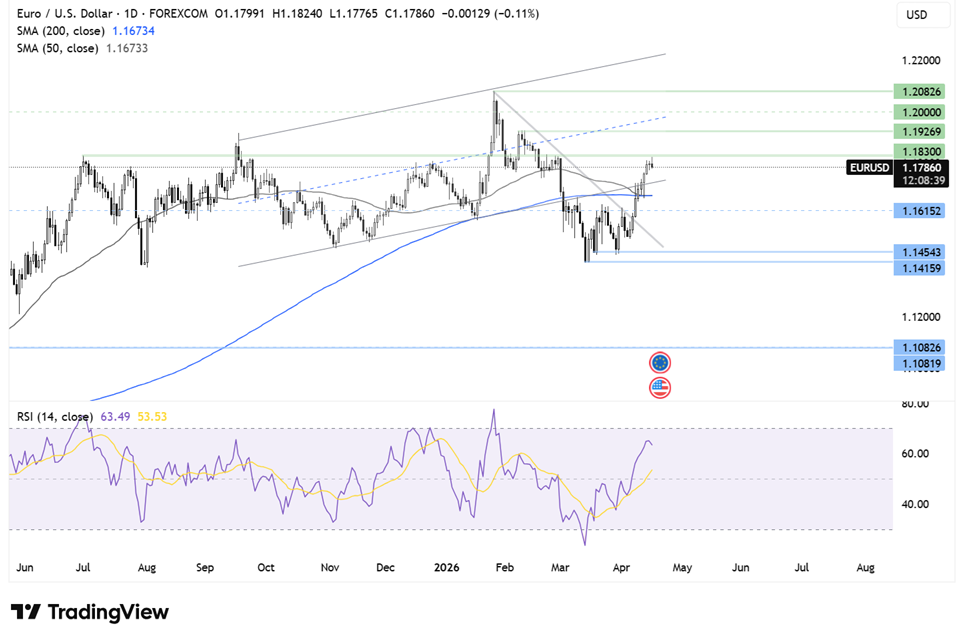
EUR/USD is holding above 1.1800 and extending gains, supported by broad US dollar weakness amid improving risk sentiment and growing optimism over a potential de-escalation in the Middle East.
The dollar has come under pressure after President Trump confirmed indirect negotiations with Iran, raising expectations that peace talks could resume in the coming days. He also suggested that Israel and Lebanon may begin direct talks soon, potentially paving the way for a more durable ceasefire.
Further weighing on the greenback, Trump has renewed his criticism of Federal Reserve Chair Jerome Powell, fuelling concerns over central bank independence.
The euro is also benefiting from improved market sentiment, with European equities moving higher and US stocks hovering near record highs, reducing demand for the safe-haven US dollar.
Attention now turns to eurozone inflation data, expected to confirm that CPI rose to 2.5% year-on-year in March. This comes ahead of the latest European Central Bank meeting minutes from March 19, where policymakers left rates unchanged but highlighted rising risks to both growth and inflation, particularly from elevated energy prices linked to the Iran conflict.
More recently, ECB officials have signalled that inflation expectations could rise faster than anticipated, strengthening the case for potential rate hikes in the coming meetings. However, policymakers continue to stress that there is no urgency to tighten policy, maintaining a cautious and data-dependent approach.
Looking ahead, developments in US–Iran relations will remain a key driver for EUR/USD, alongside incoming eurozone inflation data and ECB communication.
EUR/USD has recovered from the 1.1410 2026 low, rising above the 200 SMA and re-entering the rising channel. The price has run into resistance at 1.1825, the March high.
Buyers will look to rise above 1.1825 to extend gains to 1.1925, the February high. Above ere 1.20 comes into focus.
Support is seen at 1.1670, the 200 SMA. A break below here brings 1.16 into focus.
The EURJPY pair didn’t move anything since yesterday by its continued fluctuation near 187.45 level, affected by stochastic attempt to exit the overbought level, to increase the chances of activating the attempts of gathering the gains by targeting 186.55 and 185.85 level.
While the stability above 186.90 will allow it to provide a chance for gathering extra positive momentum, reinforcing the chances of targeting new positive stations by its rally towards 187.75 and 188.35 directly.
The expected trading range for today is between 186.90 and 187.75
Trend forecast: Fluctuated within the bullish trend.
The USD/JPY cross attracts fresh sellers following the previous day’s modest rise and drops to over a one-week low, around the 158.25 region during the Asian session on Thursday. Spot prices, however, manage to recover a few pips in the last hour and currently trade around the 158.70 area, down over 0.15% for the day.
Comments from Japan’s Finance Minister, Satsuki Katayama, saying that she discussed with Treasury Secretary Scott Bessent on foreign exchange, revived intervention fears, and boosted the Japanese Yen (JPY). Furthermore, hopes for Iran diplomacy and fading hawkish US Federal Reserve (Fed) expectations drag the US Dollar (USD) to its lowest level since late February. These turned out to be key factors exerting pressure on the USD/JPY pair.
However, economic concerns stemming from the instability in the Strait of Hormuz keep a lid on any further JPY appreciation and assist the currency pair to bounce off the 200-period Exponential Moving Average (EMA) support on the 4-hour chart. The said area also represents the lower end of a short-term trading range, and a break below will be seen as a key trigger for the USD/JPY bears, which should pave the way for deeper losses.
Meanwhile, the Moving Average Convergence Divergence (MACD) indicator has slipped into negative territory and continues to edge lower. Furthermore, the Relative Strength Index (RSI) at around 41 hovers in neutral-to-bearish ground, hinting that the momentum is softening and buyers are losing some control. This further makes it prudent to wait for a decisive breakdown of structure before placing fresh bearish bets around the USD/JPY pair.
A clear break and acceptance below the 200-period EMA on the 4-hour chart, where buyers have room to defend the recent consolidation floor, would expose bigger corrective risk. However, as long as USD/JPY holds above this moving average, the underlying bias stays modestly bullish, and any recovery attempts from current levels would likely be viewed as a continuation of the prevailing uptrend rather than the start of a sustained reversal.
(The technical analysis of this story was written with the help of an AI tool.)
The table below shows the percentage change of Japanese Yen (JPY) against listed major currencies today. Japanese Yen was the strongest against the US Dollar.
| USD | EUR | GBP | JPY | CAD | AUD | NZD | CHF | |
|---|---|---|---|---|---|---|---|---|
| USD | -0.09% | -0.11% | -0.17% | -0.16% | -0.26% | -0.01% | -0.14% | |
| EUR | 0.09% | -0.03% | -0.07% | -0.07% | -0.17% | 0.05% | -0.05% | |
| GBP | 0.11% | 0.03% | -0.04% | -0.06% | -0.15% | 0.08% | -0.03% | |
| JPY | 0.17% | 0.07% | 0.04% | -0.00% | -0.09% | 0.10% | 0.03% | |
| CAD | 0.16% | 0.07% | 0.06% | 0.00% | -0.09% | 0.13% | -0.00% | |
| AUD | 0.26% | 0.17% | 0.15% | 0.09% | 0.09% | 0.22% | 0.14% | |
| NZD | 0.00% | -0.05% | -0.08% | -0.10% | -0.13% | -0.22% | -0.10% | |
| CHF | 0.14% | 0.05% | 0.03% | -0.03% | 0.00% | -0.14% | 0.10% |
The heat map shows percentage changes of major currencies against each other. The base currency is picked from the left column, while the quote currency is picked from the top row. For example, if you pick the Japanese Yen from the left column and move along the horizontal line to the US Dollar, the percentage change displayed in the box will represent JPY (base)/USD (quote).
Silver price (XAG/USD) trades 2.2% higher to near $80.80 during the late Asian trading session on Thursday, aiming to recapture the four-week high of $81.00. The white metal trades firmly as the US Dollar (US) continues to underperform in the wake of growing optimism that the United States (US) and Iran will soon reach a permanent ceasefire.
In the Asian trade, the US Dollar Index (DXY), which tracks the Greenback’s value against six major currencies, posted a fresh over six-week low at 97.85.
Technically, a lower US Dollar makes the Silver price a favorable risk-reward bet for investors.
The US Dollar faces intense selling pressure as comments from Washington have signaled that the war with Iran is “very close” to an end. On Wednesday, White House press secretary Karoline Leavitt said that Washington is very much engaged in negotiations with Iran, and another round of talks is very likely to be scheduled in Pakistan, according to The Guardian.
In the first round of talks, the US and Iran failed to get a breakthrough as Vice President (VP) JD Vance-led team made clear that the reopening of the Strait of Hormuz and Tehran giving up its nuclear ambitions are non-negotiable.
On the monetary front, traders are confident that the Federal Reserve (Fed) will not raise interest rates this year, a sharp turnaround from two interest rate hikes projected in March, as higher oil prices boosted inflation projections globally.
In the daily chart, XAG/USD trades near the horizontal boundary of the Ascending Triangle formation at around $80.80. The white metal holds a constructive near-term bullish bias as it trades above the 20-period Exponential Moving Average (EMA) at $76.29 and maintains distance from the upward support trend line drawn from prior lows, which is now tracked near $75.81. Momentum aligns with this constructive tone, with the Relative Strength Index (14) hovering just below the overbought band around 58, hinting that buyers retain control without yet signaling extreme conditions.
On the downside, initial support is seen at the 20-period EMA at $76.29, ahead of the ascending trend-line support near $75.81. As long as XAG/USD holds above these layers of support, pullbacks are likely to be treated as corrective pauses within the broader advance, while a clear break below the trend-line region would weaken the bullish structure and open the door to a deeper retracement towards the April 7 low at $68.28.
Looking up, the Silver price could approach the March 13 high of $85.46 if it manages a decisive breakout of the horizontal boundary of the Ascending Triangle formation at around $80.80
(The technical analysis of this story was written with the help of an AI tool.)
(This story was corrected at 07:30 GMT to say in the last paragraph before the Technical Analysis section that traders are confident that the Federal Reserve (Fed) will not raise interest rates this year and not cut. Also, in the second last paragraph, the April 7 low is $68.28 and not $68.81.)
Silver is a precious metal highly traded among investors. It has been historically used as a store of value and a medium of exchange. Although less popular than Gold, traders may turn to Silver to diversify their investment portfolio, for its intrinsic value or as a potential hedge during high-inflation periods. Investors can buy physical Silver, in coins or in bars, or trade it through vehicles such as Exchange Traded Funds, which track its price on international markets.
Silver prices can move due to a wide range of factors. Geopolitical instability or fears of a deep recession can make Silver price escalate due to its safe-haven status, although to a lesser extent than Gold’s. As a yieldless asset, Silver tends to rise with lower interest rates. Its moves also depend on how the US Dollar (USD) behaves as the asset is priced in dollars (XAG/USD). A strong Dollar tends to keep the price of Silver at bay, whereas a weaker Dollar is likely to propel prices up. Other factors such as investment demand, mining supply – Silver is much more abundant than Gold – and recycling rates can also affect prices.
Silver is widely used in industry, particularly in sectors such as electronics or solar energy, as it has one of the highest electric conductivity of all metals – more than Copper and Gold. A surge in demand can increase prices, while a decline tends to lower them. Dynamics in the US, Chinese and Indian economies can also contribute to price swings: for the US and particularly China, their big industrial sectors use Silver in various processes; in India, consumers’ demand for the precious metal for jewellery also plays a key role in setting prices.
Silver prices tend to follow Gold’s moves. When Gold prices rise, Silver typically follows suit, as their status as safe-haven assets is similar. The Gold/Silver ratio, which shows the number of ounces of Silver needed to equal the value of one ounce of Gold, may help to determine the relative valuation between both metals. Some investors may consider a high ratio as an indicator that Silver is undervalued, or Gold is overvalued. On the contrary, a low ratio might suggest that Gold is undervalued relative to Silver.
The GBPJPY pair forced it to provide sideways trading by its stability near 215.50 level, affected by stochastic exit from the overbought levels, the price might be forced to provide some bearish corrective trading, however it couldn’t affect the main bullish track, depending on forming extra support level at 214.15 level.
Therefore, we will keep our main bullish scenario, to gather extra positive momentum, to ease the mission of reaching extra positive stations that might begin at 216.20 and 217.00.
The expected trading range for today is between 214.55 and 216.20
Trend forecast: Bullish
According to the latest IndexBox report on the global Coffee Roaster Machine market, the market enters 2026 with broader demand fundamentals, more disciplined procurement behavior, and a more regionally diversified supply architecture.
The global coffee roaster machine market is entering a decade of structural transformation, defined by a widening divergence between high-volume, commoditized small-scale units and high-value, engineering-intensive industrial systems. This bifurcation, forecast from 2026 to 2035, is reshaping supply chains, competitive strategies, and innovation pathways. Growth will be propelled by the relentless global expansion of specialty coffee culture, which demands precise, profile-driven roasting capabilities at both artisanal and industrial scales. Concurrently, the market faces channel consolidation, with traditional B2B distributors pressured by integrated e-commerce platforms, and intensifying price competition from Asian manufacturing hubs in entry-level segments. Innovation is pivoting from pure hardware to integrated software, IoT connectivity, and data analytics, creating new moats for brand loyalty. Sustainability and energy efficiency are evolving from marketing points to procurement necessities. This analysis provides a comprehensive outlook on demand drivers, segment dynamics, and regional shifts that will define the market landscape through 2035.
The baseline scenario for the coffee roaster machine market through 2035 projects steady expansion, underpinned by the global proliferation of coffee consumption and the premiumization trend. The market’s core trajectory is supported by the continuous growth of out-of-home coffee consumption and the embedded need for roasting capacity, both new and replacement. However, growth rates will vary significantly by segment. The industrial segment will see measured, technology-driven growth focused on efficiency gains, automation, and large-scale production for instant and mainstream retail coffee. The commercial and specialty roastery segment is expected to be the primary growth engine, fueled by café chain expansion and the rise of micro-roasteries. The prosumer and home segment will exhibit volatility, sensitive to economic cycles but benefiting from a long-term cultural shift towards coffee craftsmanship. Geographically, mature markets will focus on premiumization and replacement cycles, while emerging markets in Asia-Pacific and Latin America will drive volume growth for new installations. The overall market will remain competitive, with pressure on margins for undifferentiated products, but will offer premium opportunities for manufacturers that successfully integrate advanced control systems, energy-efficient designs, and robust service networks.
This segment represents the innovation and premiumization heart of the market. Demand is driven by the global proliferation of third-wave coffee culture, where roasters act as flavor developers and brand differentiators. Current demand centers on batch roasters (5-60kg) offering precise manual or software-assisted control over roast profiles (time, temperature, airflow) to highlight unique bean characteristics. Through 2035, the segment will evolve towards greater integration of IoT and cloud-based software for profile sharing, quality consistency across multiple locations, and remote monitoring. Key demand indicators include the number of new independent coffee shop openings, green coffee import volumes for specialty grades, and investment in barista training and certification. The driver is the consumer’s growing discernment and willingness to pay for traceable, artisanally roasted coffee, forcing cafes and roasters to invest in capable, brand-aligned equipment. Current trend: Strong Growth.
Major trends: Shift from manual to digitally-controlled profiling for repeatability and quality control, Demand for smaller, more frequent batches to offer extreme seasonal and micro-lot variety, Integration of roasting data with customer-facing storytelling and traceability platforms, and Growing emphasis on energy-efficient and low-emission roasters (e.g., air roasters) as a sustainability claim.
Representative participants: Probat, Diedrich Roasters, Loring Smart Roast, Giesen, and San Franciscan Roaster Co.
This segment serves large-scale producers of mainstream retail, private-label, and instant coffee. Current demand is for high-capacity continuous roasters (500kg/hr+) prioritizing throughput, consistency, and operational cost (energy, labor) efficiency. The focus is on robustness, integration with cooling and destoning lines, and emissions control systems. Through 2035, demand will be driven by capacity expansion in coffee-consuming emerging markets and modernization projects in mature markets aimed at reducing energy consumption and enhancing process automation. Key indicators include global soluble coffee production volumes, capital expenditure announcements by major coffee conglomerates, and green coffee price volatility which influences investment timing. Growth is tied to overall packaged coffee consumption and the economic feasibility of large-scale roasting in coffee-origin countries for export of roasted, rather than green, beans. Current trend: Steady Modernization.
Major trends: Adoption of AI-driven process optimization to maximize yield and consistency while minimizing energy use, Retrofitting older systems with advanced afterburners and emission control technologies to meet stricter regulations, Increasing demand for flexible systems capable of handling multiple bean types and roast profiles for product diversification, and Integration with factory-wide MES (Manufacturing Execution Systems) for real-time production data.
Representative participants: Probat, Bühler Group, Joper, Toper, and US Roaster Corp.
This includes large café chains, bakery-cafes, and foodservice operators that roast on-site for brand identity and freshness. Current demand is for reliable, medium-capacity batch roasters (15-120kg) that balance operational simplicity with consistent output. The primary need is for equipment that trained staff, not master roasters, can operate to a brand-standard profile. Through 2035, demand will be fueled by the continued global footprint expansion of major chains and the trend of large chains developing proprietary micro-roastery concepts. Key indicators are same-store sales growth for major chains, their annual new store opening targets, and strategic shifts towards ‘craft’ positioning. The mechanism is operational decentralization; as chains grow, they seek to reduce supply chain complexity and enhance brand storytelling by controlling more of the roasting process in regional hubs or flagship stores. Current trend: Controlled Expansion.
Major trends: Standardization on specific machine models across regions to simplify training, maintenance, and parts inventory, Growing interest in roasters with built-in connectivity for corporate performance monitoring and preventive maintenance alerts, Demand for compact, venting-compliant designs suitable for installation in urban retail environments, and Experimentation with smaller-batch, store-front roasters as a customer experience driver in flagship locations.
Representative participants: Diedrich Roasters, Genio Roasters, Coffeetek, Giesen, and Probat.
This segment encompasses hobbyists, serious enthusiasts, and very small commercial startups. Current demand spans from simple fluid-bed air roasters for home use to more advanced small drum roasters (1-5kg) for prosumers and nano-roasteries. The driver is the desire for ultimate freshness, customization, and engagement with the coffee craft. Through 2035, demand will be supported by the democratization of coffee knowledge via digital media, though it will remain sensitive to disposable income levels. Key indicators include engagement metrics on home-roasting social media communities, sales of green coffee beans through specialty channels, and economic confidence indices. The growth mechanism is educational and cultural, as more consumers transition from passive drinkers to active participants, seeking the equipment to match their evolving skills. Current trend: Volatile but Growing.
Major trends: Blurring line between high-end home roasters and entry-level commercial machines in features and price, Proliferation of app-connected roasters offering guided profiles and community-shared recipes, Design emphasis on user-friendliness, safety features, and reduced smoke emission for kitchen use, and Growth of green coffee subscription services directly paired with equipment recommendations.
Representative participants: FreshRoast, Behmor, Kaldi, Gene Cafe, Aillio Bullet R1, and Hottop.
This segment consists of dedicated facilities that roast for blending specific profiles or for export as roasted beans. Demand is for versatile, medium-to-large batch roasters capable of producing consistent base roasts for blends. The current focus is on flexibility and the ability to handle high volumes of different bean types with quick changeover. Through 2035, demand will be linked to the growth of private-label coffee programs and the strategic shift in some coffee-exporting nations towards exporting higher-value roasted beans. Key indicators include trade data for roasted coffee exports from origin countries and the market share growth of private-label coffee in retail. The driver is the economic incentive for capturing more value within the producing country’s borders and the need for blenders to have precise, reliable in-house roasting capacity to ensure blend consistency. Current trend: Niche Stability.
Major trends: Investment in roasters with precise cooling cycles to ensure uniform stopping of the roast process for blend consistency, Need for robust machines with high uptime to meet just-in-time delivery schedules for large blend contracts, Growing interest in traceability systems integrated with the roaster to track blend components from lot to final bag, and Moderate demand from origin countries as they develop local roasting industries for domestic and regional markets.
Representative participants: Probat, Toper, Joper, and US Roaster Corp.
The dominant and fastest-growing region, driven by soaring coffee consumption, café culture adoption, and major manufacturing hubs. China and Southeast Asia are epicenters for new coffee shop openings, fueling demand for commercial roasters. The region also houses key volume manufacturers, creating a dual role as both a massive consumption and production center. Growth is supported by rising incomes, urbanization, and the expansion of both international chains and local specialty brands. Direction: Rapid Growth.
A mature but innovation-led market characterized by premiumization and replacement demand. The United States is the global center for specialty coffee trends, driving demand for high-end, feature-rich roasters in micro-roasteries and serious home segments. Growth is steady, supported by the continuous evolution of third-wave coffee, café chain refurbishment cycles, and strong prosumer interest. The market is highly competitive, with a focus on technology, sustainability, and brand storytelling. Direction: Mature Growth.
A stable market with deep coffee traditions, now undergoing a modernization wave. Western and Northern Europe are hotspots for specialty coffee and stringent sustainability regulations, pushing demand for energy-efficient, low-emission roasters. Eastern Europe presents growth opportunities for new commercial installations. The market is driven by replacement of aging equipment with more efficient models and the sustained strength of the artisan roastery segment, though growth is tempered by market saturation in some countries. Direction: Stable Modernization.
A region of significant potential, balancing its role as the world’s primary green coffee producer with a growing domestic roasting industry. Demand is bifurcated: large industrial roasters for export-oriented processing and a budding specialty scene in urban centers like Brazil and Colombia. Growth is driven by efforts to capture more value domestically through local roasting and branding, as well as rising domestic consumption of higher-quality coffee. Infrastructure and financing remain key challenges. Direction: Emerging Potential.
A developing market with pockets of dynamic growth, particularly in Gulf Cooperation Council countries and major African cities. The Middle East is characterized by high out-of-home coffee consumption and the rapid influx of international café chains, driving demand for commercial roasters. Africa shows nascent growth from a low base, with potential driven by urbanization, a growing middle class, and the establishment of local roasting ventures in coffee-producing nations like Ethiopia and Kenya. Direction: Developing Growth.
In the baseline scenario, IndexBox estimates a 5.2% compound annual growth rate for the global coffee roaster machine market over 2026-2035, bringing the market index to roughly 165 by 2035 (2025=100).
Note: indexed curves are used to compare medium-term scenario trajectories when full absolute volumes are not publicly disclosed.
For full methodological details and benchmark tables, see the latest IndexBox Coffee Roaster Machine market report.
The GBPJPY pair forced it to provide sideways trading by its stability near 215.50 level, affected by stochastic exit from the overbought levels, the price might be forced to provide some bearish corrective trading, however it couldn’t affect the main bullish track, depending on forming extra support level at 214.15 level.
Therefore, we will keep our main bullish scenario, to gather extra positive momentum, to ease the mission of reaching extra positive stations that might begin at 216.20 and 217.00.
The expected trading range for today is between 214.55 and 216.20
Trend forecast: Bullish
Brent crude oil is holding lower during its recent intraday trading, under the dominance of a short-term corrective downward wave, while moving along a trendline that supports this bearish path. Negative pressure continues as the price trades below EMA50, which reduces the chances of recovery in the near term.
This comes alongside negative signals from relative strength indicators after the price managed to ease its oversold condition, which further supports the bearish outlook.
– Written by
Ben Hughes
STORY LINK Pound Sterling to Dollar Forecast: GBP Hits 2-Month Best as US Stocks Surge
The Pound to Dollar exchange rate (GBP/USD) surged to two-month highs above 1.3580, with Sterling emerging as a best buy amid a rally in global equities and improving confidence over easing Middle East tensions.
Improving risk appetite has boosted GBP demand while the dollar remains under pressure, although markets are cautious that resistance around 1.36–1.37 could limit further gains.
The Pound to Dollar (GBP/USD) exchange rate hit a 2-month peak just above 1.3580 on Tuesday before a limited correction to near 1.3550.
The Pound continued to demonstrate resilience while the dollar lost ground again as markets anticipated a resolution to the Iranian conflict with oil prices posting significant losses. A key element will be whether this optimism is justified and whether the dollar will continue to weaken.
According to UoB; “Further GBP strength would not be surprising, but given the overbought short-term conditions, the next technical target at 1.3645 may not come into view so soon.”
Scotiabank is broadly positive over the GBP/USD outlook; “We see limited resistance between current levels and the mid-Feb peaks around 1.37 and now look to support below 1.3450.”
Get better rates and lower fees on your next international money transfer.
Compare TorFX with top UK banks in seconds and see how much you could save.
There are hopes that US and Iran will hold another round of talks as pressure on Iran and the US continues to build.
IG market analyst Tony Sycamore commented; “There is a growing expectation that the standoff will soon be resolved, allowing the U.S. administration to pivot towards declaring victory, before stimulating the economy ahead of the midterms.”
ING added; “Markets have grown more confident that the Middle East crisis is moving toward a resolution, with the US and Iran arranging a second round of talks, and Tehran seemingly willing to halt shipments to avoid testing the US naval blockade.”
The bank still expressed significant caution; “Given how unsuccessful the first round of negotiations was last weekend, these dollar levels seem to embed a fair amount of premature optimism. As such, the balance of risks is increasingly skewed to the upside for USD.”
MUFG considers that underlying dollar sentiment has deteriorated; “The failure of the US dollar to advance as much as we expected since the start of the conflict and the emerging signs of increased appetite for selling is an indication of the poor fundamental backdrop for the dollar ahead of the start of the conflict.”
Underlying economic trends will also be an important element and feed into the dollar narrative.
The US NFIB small business confidence index dipped to 95.8 for March from 98.8 previously. According to the NFIB; “the dramatic spike in oil prices has spooked consumers and owners alike.”

Fed Chair nominee Warsh’s Senate confirmation hearing is scheduled for April 21st.
At this stage, markets are not pricing in a Fed rate hike with around a 30% chance of at least one cut before year-end. Comments from Warsh will be important for market pricing and a dovish stance would hurt the US currency.
International Money Transfer? Ask our resident FX expert a money transfer question or try John’s new, free, no-obligation personal service! ,where he helps every step of the way,
ensuring you get the best exchange rates on your currency requirements.
TAGS: Pound Dollar Forecasts
BitcoinWorld
Silver Price Forecast: XAG/USD Tests Critical Channel Resistance Near One-Month Highs – Crucial Technical Analysis
The silver market presents a compelling technical picture as XAG/USD tests crucial channel resistance near one-month highs on the 4-hour chart, signaling potential volatility ahead for precious metals traders. This development occurs against a complex macroeconomic backdrop that includes shifting central bank policies, industrial demand fluctuations, and geopolitical uncertainties affecting commodity markets globally. Consequently, market participants closely monitor these technical levels for directional clues about silver’s next significant move.
Currently, the XAG/USD pair demonstrates clear technical patterns on the 4-hour timeframe that professional traders analyze for strategic positioning. The price action shows silver testing the upper boundary of a well-defined ascending channel that has contained movements since early November. Moreover, this resistance zone coincides with horizontal price levels that previously acted as support during October’s consolidation phase. Therefore, this confluence of technical factors creates a critical juncture for silver’s near-term trajectory.
Market analysts observe several key technical indicators that provide context for this resistance test. First, the Relative Strength Index (RSI) approaches overbought territory near the 65-70 level, suggesting potential for a short-term pullback. Second, trading volume patterns show increased activity around these resistance levels, indicating heightened market interest. Finally, moving average alignments reveal the 50-period and 200-period averages providing dynamic support below current prices.
Examining historical price action reveals important context for understanding current resistance significance. Throughout 2024, silver faced similar technical challenges at comparable price levels, with previous resistance tests leading to varied outcomes. For instance, in September, a similar resistance test resulted in a 3.2% correction before renewed buying emerged. However, in July, a breakthrough at comparable levels triggered a sustained 8.5% rally over subsequent weeks.
The table below illustrates recent silver resistance tests and their outcomes:
| Date | Resistance Level | Outcome | Subsequent Move |
|---|---|---|---|
| September 15, 2024 | $24.85 | Rejection | -3.2% over 5 days |
| July 22, 2024 | $25.10 | Breakout | +8.5% over 3 weeks |
| May 6, 2024 | $24.60 | Consolidation | Sideways for 2 weeks |
Beyond technical patterns, fundamental factors significantly influence silver’s price dynamics as XAG/USD approaches resistance. Industrial demand remains robust, particularly from renewable energy sectors where silver serves as a critical component in solar panel manufacturing. Additionally, monetary policy expectations continue to evolve, with market participants adjusting positions based on anticipated interest rate trajectories from major central banks.
Several macroeconomic developments warrant attention for silver traders:
Furthermore, exchange-traded fund (ETF) holdings provide insight into institutional sentiment toward silver. Recent data shows modest inflows into silver-backed ETFs, suggesting cautious but growing institutional interest. Meanwhile, COMEX futures positioning indicates that managed money accounts maintain net-long positions, though at reduced levels compared to earlier in the year.
The ascending channel pattern on the 4-hour chart offers clear framework for evaluating potential price movements. This technical structure features parallel trendlines connecting successive higher lows and higher highs since early November. Currently, the upper channel line presents immediate resistance, while the lower channel line provides dynamic support approximately 3.5% below current levels.
Market technicians typically consider three primary scenarios when prices test channel boundaries:
Each scenario carries distinct trading implications and risk parameters. For instance, a successful breakout above channel resistance would target previous swing highs from October, representing approximately 4.2% upside potential. Conversely, rejection at resistance could see silver retreat toward the channel’s lower boundary, representing potential downside of 3-4%.
Professional traders emphasize the importance of confirmation signals when evaluating resistance tests. Specifically, breakout validity typically requires supporting volume expansion and momentum confirmation. Current volume analysis shows moderate increases during recent approach to resistance, though not yet at levels typically associated with decisive breakouts. Momentum indicators, including the MACD histogram, show positive but decelerating momentum as prices near resistance.
Additionally, market breadth within the precious metals complex provides contextual information. Gold’s correlation with silver remains elevated at approximately 0.82 on 30-day rolling basis, suggesting coordinated movements across precious metals. Platinum and palladium prices show mixed signals, with platinum demonstrating relative strength while palladium continues its longer-term downtrend.
As XAG/USD tests critical technical levels, prudent risk management becomes paramount for market participants. Position sizing should account for increased volatility typically associated with resistance tests, while stop-loss placement requires careful consideration of channel structure. Many technical traders utilize the channel’s opposite boundary or recent swing points for stop-loss reference levels.
Key risk management principles for current market conditions include:
Furthermore, traders should consider upcoming economic events that could influence silver prices. The Federal Reserve’s December meeting minutes release, upcoming inflation data, and manufacturing PMI reports all represent potential catalysts for precious metals markets. These events may provide fundamental justification for technical breakouts or reversals.
Historical analysis reveals that similar technical setups in silver have produced varied outcomes depending on broader market context. During 2023, silver experienced seven comparable resistance tests at channel boundaries on 4-hour charts, with four resulting in breakouts and three leading to rejections. The average magnitude of successful breakouts measured 5.8%, while rejected tests saw average declines of 3.9% before finding support.
Seasonal factors also merit consideration in silver price analysis. Historically, December and January have shown mixed seasonal tendencies for silver, with no strong directional bias. However, the first quarter often brings increased industrial demand projections as companies finalize annual budgets and production plans. This fundamental backdrop may provide underlying support even if technical resistance initially holds.
Market analysts offer varied perspectives on silver’s technical situation. Some emphasize the importance of dollar strength as primary determinant of precious metals pricing, noting that DXY index levels near 104.50 create headwinds for dollar-denominated commodities. Others highlight silver’s dual nature as both monetary metal and industrial commodity, suggesting that industrial demand fundamentals may ultimately override technical resistance.
Technical analysts at major financial institutions generally agree on the significance of current resistance levels but differ on probable outcomes. Several firms publish resistance and support clusters rather than single price levels, recognizing that markets often test zones rather than precise numbers. The current resistance zone for XAG/USD spans approximately $25.00 to $25.30, with particular attention to the $25.15 level where multiple technical factors converge.
The silver price forecast remains at critical juncture as XAG/USD tests channel resistance near one-month highs on the 4-hour chart. This technical development occurs within broader context of evolving macroeconomic conditions and shifting market sentiment toward precious metals. Traders should monitor confirmation signals including volume patterns, momentum indicators, and related market movements when evaluating potential breakout or rejection scenarios. Ultimately, the resolution of this technical test will provide important information about silver’s near-term trajectory and broader precious metals market dynamics.
Q1: What does it mean when silver tests channel resistance?
When silver tests channel resistance, the price approaches the upper boundary of a defined trading range or trend channel. This represents a potential turning point where the market may either break through to higher prices or reverse direction.
Q2: How significant are one-month highs for silver pricing?
One-month highs represent important psychological and technical levels where previous selling may have emerged. These levels often attract attention from both technical traders and institutional investors, potentially increasing volatility as prices approach them.
Q3: What time frame is most relevant for silver traders?
Silver traders typically monitor multiple time frames simultaneously. While the 4-hour chart shows intermediate-term trends, traders often reference daily charts for primary direction and hourly charts for entry timing. The 4-hour chart effectively balances noise reduction with timely signals.
Q4: How does XAG/USD differ from silver spot pricing?
XAG/USD represents the forex pair for trading silver against the US dollar, while silver spot price typically refers to the current market price for immediate delivery. In practice, they track closely, though XAG/USD may incorporate forex market dynamics and leverage availability differences.
Q5: What confirmation signals should traders watch during resistance tests?
Traders should monitor volume expansion, momentum indicator confirmation, price action on higher time frames, and movements in correlated markets like gold and the US dollar. Multiple confirming signals increase confidence in breakout validity or rejection strength.
This post Silver Price Forecast: XAG/USD Tests Critical Channel Resistance Near One-Month Highs – Crucial Technical Analysis first appeared on BitcoinWorld.


