The main category of Forex News.
You can use the search box below to find what you need.
[wd_asp id=1]
The main category of Forex News.
You can use the search box below to find what you need.
[wd_asp id=1]
Copper price began its trading by losing the bullish momentum due to stochastic attempt to end the bullish rally, to settle again near $5.9700 level, which formed strong barrier in the previous trading.
The stability above $5.9700 supports the chances of gathering the required extra positive momentum to motivate the bullish rally that might target $6.1550 and $6.2500, while the decline below it might force it to provide temporary trading, to target $5.8100 before reaching the additional positive targets.
The expected trading range for today is between $5.9100 and $6.1550
Trend forecast: Fluctuated
The Australian dollar has actually hit a fresh new high against the Japanese yen as we have cleared the 114 level. I am bullish of this pair and I do think short-term pullbacks will continue to offer buying opportunities, not only due to the interest rate differential but the fact that this is a bit of a commodity play and of course, a play on the fact that Australia is one of the few central banks around the world that has actually raised rates recently.
Ultimately, I do think that we go looking to a much higher level, perhaps 118 yen. That is a longer-term thought, that is not anything we are going to see in the next few days, but I like owning this pair.
Silver (XAG/USD) rebounds on Friday, trading around $79.40 at the time of writing and gaining 1.25% on the day. The Silver price remains close to the $79 mark as investors monitor geopolitical developments and monetary policy expectations in the United States (US).
The precious metal moves in a relatively cautious environment as markets await further details about a possible second round of negotiations between the US and Iran. Washington has indicated that talks with Tehran could resume before the expiration of the current two-week ceasefire scheduled for April 21. Investors are closely watching these developments, which could influence global risk sentiment and safe-haven flows.
US President Donald Trump recently expressed optimism that a diplomatic agreement with Iran could be close, stating that Tehran appears more willing to make concessions than in previous discussions. Reports suggest that negotiations could involve commitments related to Iran’s nuclear program and enriched uranium stockpiles.
Expectations of progress in diplomacy are contributing to persistent pressure on the US Dollar (USD). The US Dollar Index (DXY), which tracks the value of the Greenback against a basket of major currencies, is on track for a new weekly decline. A softer US currency tends to support commodities priced in USD, including Silver.
At the same time, easing tensions in the Middle East are weighing on Oil prices and moderating inflation expectations. This dynamic has encouraged traders to reinforce bets that the Federal Reserve (Fed) could adopt a more accommodative monetary policy stance in the coming months.
Lower interest rate expectations are generally supportive for non-yielding assets such as Silver. With yields potentially declining, the opportunity cost of holding precious metals decreases, which helps maintain investor demand for assets like XAG/USD in the current macroeconomic environment.
Silver is a precious metal highly traded among investors. It has been historically used as a store of value and a medium of exchange. Although less popular than Gold, traders may turn to Silver to diversify their investment portfolio, for its intrinsic value or as a potential hedge during high-inflation periods. Investors can buy physical Silver, in coins or in bars, or trade it through vehicles such as Exchange Traded Funds, which track its price on international markets.
Silver prices can move due to a wide range of factors. Geopolitical instability or fears of a deep recession can make Silver price escalate due to its safe-haven status, although to a lesser extent than Gold’s. As a yieldless asset, Silver tends to rise with lower interest rates. Its moves also depend on how the US Dollar (USD) behaves as the asset is priced in dollars (XAG/USD). A strong Dollar tends to keep the price of Silver at bay, whereas a weaker Dollar is likely to propel prices up. Other factors such as investment demand, mining supply – Silver is much more abundant than Gold – and recycling rates can also affect prices.
Silver is widely used in industry, particularly in sectors such as electronics or solar energy, as it has one of the highest electric conductivity of all metals – more than Copper and Gold. A surge in demand can increase prices, while a decline tends to lower them. Dynamics in the US, Chinese and Indian economies can also contribute to price swings: for the US and particularly China, their big industrial sectors use Silver in various processes; in India, consumers’ demand for the precious metal for jewellery also plays a key role in setting prices.
Silver prices tend to follow Gold’s moves. When Gold prices rise, Silver typically follows suit, as their status as safe-haven assets is similar. The Gold/Silver ratio, which shows the number of ounces of Silver needed to equal the value of one ounce of Gold, may help to determine the relative valuation between both metals. Some investors may consider a high ratio as an indicator that Silver is undervalued, or Gold is overvalued. On the contrary, a low ratio might suggest that Gold is undervalued relative to Silver.
Copper price began its trading by losing the bullish momentum due to stochastic attempt to end the bullish rally, to settle again near $5.9700 level, which formed strong barrier in the previous trading.
The stability above $5.9700 supports the chances of gathering the required extra positive momentum to motivate the bullish rally that might target $6.1550 and $6.2500, while the decline below it might force it to provide temporary trading, to target $5.8100 before reaching the additional positive targets.
The expected trading range for today is between $5.9100 and $6.1550
Trend forecast: Fluctuated
Domestic coffee prices
The domestic coffee market on April 17 interrupted the series of price increases, creating an additional gap with the peak set on March 24 of about 6,600 VND/kg.
According to surveys in key growing areas of the Central Highlands, coffee prices decreased from 1,200 – 1,300 VND/kg, bringing the average price level of the whole region to the threshold of 87,100 VND/kg.
In Dak Nong province (old), the recorded purchasing price was the highest in the region at 87.2 million VND/kg, down 1.2 million VND/kg.
Dak Lak and Gia Lai localities simultaneously decreased the deepest by 1,300 VND/kg, down to 87,000 VND/kg.
The lowest price offered to the market is Lam Dong province, currently listed at 86,600 VND/kg.
World coffee prices
On the international market, exchanges simultaneously reversed direction. Closing the trading session, the price of online Robusta coffee for May 2026 delivery on the London exchange decreased by 1.52% (about 54 USD/ton), to 3,474 USD/ton.
July 2026 futures contract decreased by 1.37% (equivalent to 47 USD/ton), reaching 3,347 USD/ton.
Similarly, on the New York exchange, the price of Arabica coffee for delivery in May 2026 decreased deeply by 2.55% (7.8 US cents/lb), reaching 296.45 US cents/lb. The contract for delivery in July 2026 plunged 2.62% (7.85 US cents/lb), reaching 290.40 US cents/lb.
Market outlook
Coffee prices plummeted due to pressure from a stronger USD. The USD index recovered from a 6-week low and increased again, triggering profit-taking sell-offs on the coffee futures market. However, Robusta’s decline was somewhat limited by tightened short-term supply, as Robusta inventories tracked by ICE fell to a 1.25-year low, to 3,867 lots.
Previously, Arabica coffee prices fell to a 1-month low due to expectations for a record crop in Brazil. On the supporting side, supply from Brazil is showing signs of decline. According to Cecafe, Brazil’s green coffee exports in March decreased by 10% over the same period, to 2.65 million bags. The Brazilian Ministry of Commerce also reported that exports in March decreased by 31%, to 151,000 tons.
Vietnam’s coffee exports in March 2026 recovered thanks to increased post-harvest supply and accelerated delivery activities. According to data from the Vietnam Customs Department, Vietnam’s coffee exports in March 2026 reached 222.0 thousand tons, worth 990.2 million USD, an increase of 56.0% in volume and 47.5% in value compared to February 2026, compared to March 2025, an increase of 15.6% in volume, but a decrease of 11.5% in value.
Forecast for the second quarter of 2026, coffee exports will stagnate as domestic supply decreases after the harvest season, while global inventories are high and demand from the EU and the United States recovers slowly. At the same time, supply from Brazil and Indonesia increases with the prospect of improved new crop output, which will make price competition fiercer, putting pressure on Vietnam’s exports.
The USD/JPY pair is seen building on the previous day’s goodish rebound from the 158.25 region, or over a one-week low, and gaining some follow-through positive traction on Friday. This marks the third straight day of a move up and lifts spot prices to mid-159.00s during the Asian session.
The Japanese Yen (JPY) continues with its relative underperformance in the wake of growing market concerns about the potential economic implications of the Middle East conflict. Furthermore, declining market expectations for a Bank of Japan (BoJ) rate hike in April further undermine the JPY and act as a tailwind for the USD/JPY pair.
Meanwhile, the instability in the Strait of Hormuz, due to the US naval blockade of Iranian ports, assists the US Dollar (USD) in preserving the previous day’s recovery gains from its lowest level since late February. However, hopes for Iran diplomacy and fading hawkish US Federal Reserve (Fed) bets cap the buck and the USD/JPY pair.
The overnight rebound from the 200-period Exponential Moving Average (EMA) support on the 4-hour chart, which coincides with the lower end of a short-term trading range, and the subsequent move up favor the USD/JPY bulls. Moreover, momentum metrics validate the positive outlook and back the case for a further appreciating move.
The Relative Strength Index is around 61, suggesting firm but not overstretched buying pressure. Moreover, the Moving Average Convergence Divergence (MACD) line has turned higher in positive territory. This hints at strengthening upside momentum and suggests that the path of least resistance for the USD/JPY pair remains to the upside.
In the meantime, initial support is seen at the recent price pivot near 159.47, with a deeper cushion provided by the 200-period EMA at 158.46, which should act as a key downside reference. As long as sellers fail to force a sustained break below the 200-period EMA, dips are likely to be treated as corrective within the prevailing bullish structure.
(The technical analysis of this story was written with the help of an AI tool.)
The table below shows the percentage change of Japanese Yen (JPY) against listed major currencies today. Japanese Yen was the strongest against the British Pound.
| USD | EUR | GBP | JPY | CAD | AUD | NZD | CHF | |
|---|---|---|---|---|---|---|---|---|
| USD | -0.01% | 0.03% | 0.21% | -0.14% | -0.12% | 0.03% | -0.05% | |
| EUR | 0.01% | 0.04% | 0.19% | -0.15% | -0.11% | 0.03% | -0.05% | |
| GBP | -0.03% | -0.04% | 0.15% | -0.19% | -0.15% | -0.01% | -0.08% | |
| JPY | -0.21% | -0.19% | -0.15% | -0.34% | -0.32% | -0.19% | -0.25% | |
| CAD | 0.14% | 0.15% | 0.19% | 0.34% | 0.02% | 0.16% | 0.10% | |
| AUD | 0.12% | 0.11% | 0.15% | 0.32% | -0.02% | 0.14% | 0.07% | |
| NZD | -0.03% | -0.03% | 0.01% | 0.19% | -0.16% | -0.14% | -0.07% | |
| CHF | 0.05% | 0.05% | 0.08% | 0.25% | -0.10% | -0.07% | 0.07% |
The heat map shows percentage changes of major currencies against each other. The base currency is picked from the left column, while the quote currency is picked from the top row. For example, if you pick the Japanese Yen from the left column and move along the horizontal line to the US Dollar, the percentage change displayed in the box will represent JPY (base)/USD (quote).
Brent crude prices will remain above $90 per barrel through the end of this year as the war continues to cut off supply from the Middle East, analysts at Australia-based bank ANZ said on Tuesday.
The bank raised its 2026 estimate from previous expectations of Brent averaging closer to $80 per barrel, amid mounting supply losses and increasingly distorted supply-demand balances.
“The oil market no longer needs a worst-case escalation to justify higher pricing levels,” the analysts at ANZ wrote in a research note carried by Reuters.
The tightening oil market alone is set to support Brent Crude prices around current levels even if there is no further escalation of hostilities, according to the bank.
Early on Tuesday, Brent crude traded at $98.73 per barrel, down by 0.61%, after the U.S. naval blockade of the Strait of Hormuz began at 10:00 a.m. ET on Monday.
The war has so far removed about 10 million barrels per day of crude supply. Some of this, up to 2 million bpd of the shut-ins of wells in the region, could remain offline permanently or semi-permanently due to damage to reservoirs or financial or technical constraints toward restarting, ANZ’s analysts said.
Stockpile releases could do very little to stabilize oil prices, as inventories in developed economies were already close to historically low levels before the war, according to the bank.
Even if the Strait of Hormuz opened today without any restrictions and risks, oil and gas supply from the Middle East faces recovery of several months well into the late summer, according to Wood Mackenzie.
This, of course, is contingent on an operating Strait of Hormuz.
Goldman Sachs last week warned that Brent Crude prices are set to average above $100 per barrel this year if the Strait of Hormuz remains mostly shut to tanker traffic for another month.
By Tsvetana Paraskova for Oilprice.com
BitcoinWorld
EUR/JPY Forecast: Pair’s Critical Resilience Test at 187.50 Amid Bullish 100-Day EMA Support
The EUR/JPY currency pair presents a compelling technical narrative in early 2025, as it weakens toward the 187.50 level while demonstrating notable resilience above its critical 100-day Exponential Moving Average. This price action creates a crucial juncture for traders and analysts monitoring the cross between the Euro and the Japanese Yen. Market participants globally are scrutinizing this dynamic for signals about broader risk sentiment and central bank policy divergence. Consequently, the pair’s behavior near these technical landmarks offers significant insights into potential future directional moves.
As of late March 2025, the EUR/JPY exchange rate trades cautiously around the 187.50 handle. This level represents a short-term support zone that has attracted consistent buying interest throughout the first quarter. However, the more substantial and widely watched technical feature remains the 100-day Exponential Moving Average, currently positioned several pips below the spot price. Historically, this moving average has acted as a robust dynamic support during the pair’s broader uptrend, which began in late 2024. A sustained hold above this indicator typically signals maintained bullish momentum from a medium-term perspective.
Several key technical indicators provide context for the current consolidation. The Relative Strength Index (RSI) on the daily chart has retreated from overbought territory above 70, now hovering in the mid-50s. This suggests a healthy correction within a prevailing uptrend rather than a fundamental reversal. Furthermore, trading volume profiles indicate accumulation near the 187.00-187.80 range, reinforcing the area’s importance. Market analysts often reference these confluence zones where price, volume, and moving averages intersect to gauge potential pivot points.
The fundamental backdrop for EUR/JPY involves a complex interplay between European and Japanese economic policies. On the Eurozone side, the European Central Bank’s (ECB) communicated path for interest rates remains a primary driver. Investors are closely parsing statements from ECB officials for clues on the timing and pace of any further policy normalization beyond initial rate cuts. Conversely, the Bank of Japan (BOJ) continues its nuanced exit from ultra-accommodative monetary settings, a process that markets are still calibrating. This policy divergence creates inherent volatility for the cross.
Economic data releases directly impact trader sentiment. Strong Eurozone inflation or growth figures can bolster the Euro, while signs of persistent weakness in Japan’s economic recovery may limit the Yen’s appeal. Geopolitical developments and global risk appetite also play outsized roles, as the Yen traditionally functions as a safe-haven currency. Therefore, a shift toward risk-off sentiment can trigger Yen strength, pressuring EUR/JPY lower irrespective of Euro-specific news. Analysts must therefore consider both regional and global catalysts.
Financial strategists emphasize the hierarchical structure of support levels. The immediate support rests at the recent lows near 187.30, followed by the more significant 100-day EMA, which currently approximates 186.80. A decisive daily close below this moving average would likely trigger a deeper corrective phase, potentially targeting the 185.50 region. On the upside, initial resistance is seen near 188.20, the late-February swing high. A clean break above this barrier could open the path toward the psychological 190.00 level, a target many institutional forecasts mention for Q2 2025.
Seasoned chartists also monitor candlestick patterns for reversal or continuation signals. The recent price action has formed several inside bars and doji candles near 187.50, indicating equilibrium and indecision. This often precedes a volatility expansion. The commitment of traders (COT) reports, which show positioning by large speculators, provide another layer of insight. Current data suggests that while long positions in EUR/JPY remain substantial, some profit-taking has occurred, aligning with the recent pullback from yearly highs.
Understanding EUR/JPY requires viewing it within the broader Forex landscape. The pair’s performance often correlates with global equity markets and the general appetite for carry trades, where investors borrow in low-yielding currencies like the JPY to invest in higher-yielding assets. The table below summarizes key technical levels and comparative strength against other major Yen crosses as of this analysis:
| Currency Pair | Key Level | Relation to 100-day EMA | Weekly Trend |
|---|---|---|---|
| EUR/JPY | 187.50 | Above | Bullish Consolidation |
| GBP/JPY | 192.00 | Above | Bullish |
| USD/JPY | 158.00 | At EMA | Neutral |
| AUD/JPY | 98.50 | Below | Corrective |
This comparative analysis reveals that EUR/JPY maintains relative strength among the major Yen pairs, underscoring the underlying demand for Euro exposure against the Japanese currency. The pair’s ability to hold above its primary moving average, while others test or breach theirs, is a technically positive sign. Market technicians interpret this relative performance as a clue to underlying capital flows and sector rotation within the Forex market.
The EUR/JPY forecast hinges on the pair’s interaction with the 187.50 support and the 100-day Exponential Moving Average. While short-term weakness is evident, the broader bullish structure remains intact as long as price sustains above this key dynamic level. Traders should monitor upcoming economic data from both regions and any shifts in central bank rhetoric for directional catalysts. The technical setup suggests that the current consolidation may resolve with a continuation of the prior uptrend, provided global risk sentiment remains stable. Consequently, the 100-day EMA continues to serve as the critical line in the sand for the medium-term EUR/JPY outlook.
Q1: What does the 100-day EMA indicate for EUR/JPY?
The 100-day Exponential Moving Average is a widely followed medium-term trend indicator. A price trading above it generally suggests a bullish bias, while trading below it can indicate bearish momentum. For EUR/JPY, holding above it supports the ongoing uptrend narrative.
Q2: Why is the 187.50 level significant?
The 187.50 level has acted as a recent pivot point and area of price congestion, where buying and selling interest has historically been balanced. It represents immediate short-term support, and a break below could accelerate selling toward the next major support at the 100-day EMA.
Q3: How do Bank of Japan policies affect EUR/JPY?
The Bank of Japan’s monetary policy directly influences the Yen’s value. A more hawkish BOJ (hinting at rate hikes or reducing stimulus) typically strengthens the JPY, weighing on EUR/JPY. The pace of the BOJ’s policy normalization is a key watchpoint for cross traders.
Q4: What is the main risk to the bullish forecast?
The primary risk is a sustained break below the 100-day EMA on a daily closing basis. This would technically invalidate the current bullish structure and could trigger a deeper correction, potentially driven by a surge in safe-haven Yen demand or unexpectedly dovish ECB signals.
Q5: How does global risk sentiment impact this currency pair?
EUR/JPY is considered a “risk-sensitive” cross. In periods of positive risk appetite (rising stock markets), the pair tends to rise as investors sell the safe-haven JPY. During risk-off periods, the pair often falls due to JPY buying, regardless of Euro-specific news.
This post EUR/JPY Forecast: Pair’s Critical Resilience Test at 187.50 Amid Bullish 100-Day EMA Support first appeared on BitcoinWorld.
Brent crude oil is holding lower during its recent intraday trading, under the dominance of a short-term corrective downward wave, while moving along a trendline that supports this bearish path. Negative pressure continues as the price trades below EMA50, which reduces the chances of recovery in the near term.
This comes alongside negative signals from relative strength indicators after the price managed to ease its oversold condition, which further supports the bearish outlook.
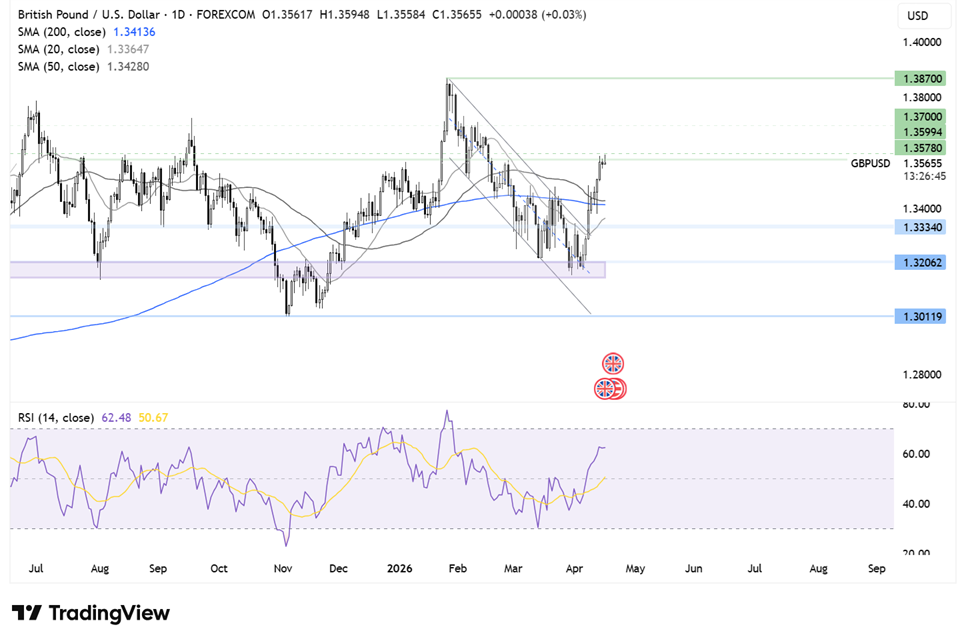
GBP/USD is edging higher, holding above 1.3550 and moving towards 1.3600, supported by US dollar weakness and stronger-than-expected UK GDP data.
The UK economy expanded by 0.5% month-on-month in February, well above the 0.1% forecast and up from an upwardly revised 0.1% in January. The data suggests the economy had solid momentum heading into the Iran conflict. The dominant services sector drove growth, marking a fourth consecutive monthly expansion, while production and construction also contributed positively.
However, further upside in sterling may be limited as the outlook has deteriorated since the onset of the Iran war. Rising energy prices and the UK’s reliance on imported energy pose downside risks. The International Monetary Fund has already downgraded UK growth to 0.8% for this year from 1.3%.
Despite potential stagflationary pressures, Andrew Bailey has indicated that the Bank of England will not rush to raise interest rates, stressing that the duration of the conflict will be a key determinant. Should the war de-escalate and oil prices stabilise, inflationary pressures may prove transitory, reducing the need for aggressive policy tightening.
Meanwhile, the US dollar remains under pressure, trading near a six-week low amid optimism over potential peace in the Middle East. President Trump has suggested that the conflict could end soon, with diplomatic efforts— including talks involving Israel and Lebanon—supporting risk sentiment.
Additionally, expectations that the Federal Reserve will keep interest rates unchanged are weighing on the dollar. US initial jobless claims are expected to edge higher to around 215,000, and attention will remain firmly on geopolitical developments.
GBP/USD found support at the 1.3150 support zone and recovered higher, rising above the falling channel and above the 200 SMA to resistance at 1.36. This, combined with the RSI above 50, keeps buyers optimistic of further upside.
A rise above 1.36 opens the door to further gains towards 1.37 before bringing 1.3870, the 2026 high, into focus.
Support is seen at 1.3420, the 200 SMA and below here at 1.3340, the January low comes into play.
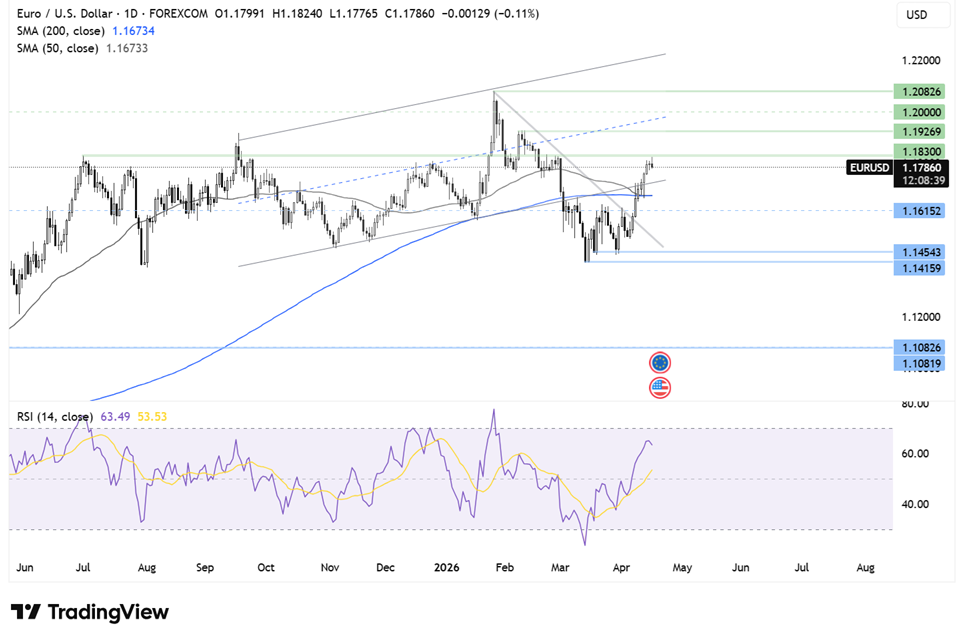
EUR/USD is holding above 1.1800 and extending gains, supported by broad US dollar weakness amid improving risk sentiment and growing optimism over a potential de-escalation in the Middle East.
The dollar has come under pressure after President Trump confirmed indirect negotiations with Iran, raising expectations that peace talks could resume in the coming days. He also suggested that Israel and Lebanon may begin direct talks soon, potentially paving the way for a more durable ceasefire.
Further weighing on the greenback, Trump has renewed his criticism of Federal Reserve Chair Jerome Powell, fuelling concerns over central bank independence.
The euro is also benefiting from improved market sentiment, with European equities moving higher and US stocks hovering near record highs, reducing demand for the safe-haven US dollar.
Attention now turns to eurozone inflation data, expected to confirm that CPI rose to 2.5% year-on-year in March. This comes ahead of the latest European Central Bank meeting minutes from March 19, where policymakers left rates unchanged but highlighted rising risks to both growth and inflation, particularly from elevated energy prices linked to the Iran conflict.
More recently, ECB officials have signalled that inflation expectations could rise faster than anticipated, strengthening the case for potential rate hikes in the coming meetings. However, policymakers continue to stress that there is no urgency to tighten policy, maintaining a cautious and data-dependent approach.
Looking ahead, developments in US–Iran relations will remain a key driver for EUR/USD, alongside incoming eurozone inflation data and ECB communication.
EUR/USD has recovered from the 1.1410 2026 low, rising above the 200 SMA and re-entering the rising channel. The price has run into resistance at 1.1825, the March high.
Buyers will look to rise above 1.1825 to extend gains to 1.1925, the February high. Above ere 1.20 comes into focus.
Support is seen at 1.1670, the 200 SMA. A break below here brings 1.16 into focus.