The main category of Forex News.
You can use the search box below to find what you need.
[wd_asp id=1]
The main category of Forex News.
You can use the search box below to find what you need.
[wd_asp id=1]
GBP/USD is trading at $1.25975, up 0.56%, as it tests the pivot point at $1.26072. Immediate resistance stands at $1.26617, with further levels at $1.27153 and $1.27714 if the pair gains bullish traction. On the downside, support is found at $1.25537, with additional cushions at $1.25061 and $1.24569.
The 50 EMA at $1.26106 aligns closely with the pivot, reinforcing its importance as a tipping point. A break above $1.26072 could drive further bullish momentum, while a failure to hold may signal a bearish reversal.
The Euro (EUR) struggled on weak economic data. German Final GDP q/q stagnated at 0.1%, while French and German PMI figures fell below forecasts.
French Manufacturing PMI hit 43.2, below the 44.6 projection, and German Services PMI dropped to 49.4, missing the 51.6 estimate.
Market focus shifts to Monday’s German Ifo Business Climate data at 86.1, down from 86.5, and ECB President Lagarde’s insights on future monetary policy.
Silver price (XAG/USD) retraces its recent gains, trading around $30.80 per troy ounce during the Asian session on Monday. This decline may be linked to a technical pullback, similar to the weakness seen in precious metal Gold. However, Silver, as a safe-haven asset, could regain its momentum due to the escalating Russia-Ukraine conflict.
On Friday, President Vladimir Putin confirmed that Russia conducted a hypersonic intermediate-range missile test in an attack on the Ukrainian city of Dnipro. The Kremlin stated that the strike was a retaliatory measure in response to Ukraine’s first assault on Russian territory using US and British-supplied weapons.
Silver prices may receive additional support from a weaker US Dollar following the announcement by US President-elect Donald Trump of his nomination of hedge fund manager Scott Bessent as the new US Treasury Secretary. Bessent, a seasoned Wall Street figure and fiscal conservative, is expected to adopt a more cautious stance on tariffs, alleviating concerns about the implementation of aggressive trade policies.
The non-interest-bearing Silver might have faced downward pressure due to the potential for a higher opportunity cost over a prolonged period. This could be attributed to the strong preliminary S&P Global US Purchasing Managers’ Index (PMI) data released on Friday, which has fueled expectations that the Federal Reserve (Fed) may slow the pace of rate cuts.
Futures traders are now assigning a 50.9% probability to the Federal Reserve cutting rates by a quarter point, down from approximately 61.9% a week earlier, according to the CME FedWatch Tool.
Silver is a precious metal highly traded among investors. It has been historically used as a store of value and a medium of exchange. Although less popular than Gold, traders may turn to Silver to diversify their investment portfolio, for its intrinsic value or as a potential hedge during high-inflation periods. Investors can buy physical Silver, in coins or in bars, or trade it through vehicles such as Exchange Traded Funds, which track its price on international markets.
Silver prices can move due to a wide range of factors. Geopolitical instability or fears of a deep recession can make Silver price escalate due to its safe-haven status, although to a lesser extent than Gold’s. As a yieldless asset, Silver tends to rise with lower interest rates. Its moves also depend on how the US Dollar (USD) behaves as the asset is priced in dollars (XAG/USD). A strong Dollar tends to keep the price of Silver at bay, whereas a weaker Dollar is likely to propel prices up. Other factors such as investment demand, mining supply – Silver is much more abundant than Gold – and recycling rates can also affect prices.
Silver is widely used in industry, particularly in sectors such as electronics or solar energy, as it has one of the highest electric conductivity of all metals – more than Copper and Gold. A surge in demand can increase prices, while a decline tends to lower them. Dynamics in the US, Chinese and Indian economies can also contribute to price swings: for the US and particularly China, their big industrial sectors use Silver in various processes; in India, consumers’ demand for the precious metal for jewellery also plays a key role in setting prices.
Silver prices tend to follow Gold’s moves. When Gold prices rise, Silver typically follows suit, as their status as safe-haven assets is similar. The Gold/Silver ratio, which shows the number of ounces of Silver needed to equal the value of one ounce of Gold, may help to determine the relative valuation between both metals. Some investors may consider a high ratio as an indicator that Silver is undervalued, or Gold is overvalued. On the contrary, a low ratio might suggest that Gold is undervalued relative to Silver.
After witnessing intense volatility in Monday’s opening hour, Gold’s price is licking its wounds near $2,700. The bright metal enjoyed good two-way trades before sellers returned to the game after five straight days.
Gold price picked up fresh bids and jumped to nearly a two-week high of $2,721 in the early dealing. The US Dollar saw a bearish opening gap in tandem with the US Treasury bond yields. Asian traders hit their desks and reacted to the weekend news that US President-elect Donald Trump named billionaire Scott Bessent as his Treasury Secretary.
Bessent’s appointment to the critical position in the Trump administration assured the US Treasury market, as he is seen as an old Wall Street hand and a fiscal conservative. This narrative triggered a sharp retracement in the benchmark US 10-year Treasury bond yields, testing the 4.30% level as of writing.
The US Dollar (USD) tracked the sell-off in the US Treasury bond yields, currently trading 0.65% lower on the day against its major currency rivals.
Despite the ongoing pullback in the USD and the Treasury bond yields, the non-yielding Gold price cannot capitalize on it, correcting sharply from higher levels.
The latest downtick in Gold price could be attributed to improving risk sentiment, courtesy of easing geopolitical tensions between Israel and Lebanon, and reducing uncertainty around the Trump administration. Citing Israeli and US officials. Axios reported that Israel and Lebanon are on the cusp of a ceasefire agreement.
Gold buyers are also cashing in ahead of Wednesday’s US inflation data amid a holiday-shortened Thanksgiving week.
All eyes remain on the geopolitical developments between Israel and Lebanon and Russia-Ukraine in the absence of any top-tier US economic data release on Monday. No speeches from US Federal Reserve (Fed) policymakers could leave Gold traders at the mercy of risk trends.
Having reclaimed all major daily Simple Moving Averages (SMA) on Friday, Gold price has paused its recovery momentum near $2,720.
The turn lower in the 14-day Relative Strength Index (RSI) could also be linked to the renewed weakness in Gold price. The leading indicator currently trades near 56 after testing the 58 level.
An impending Bear Cross continues to pose as a headwind for Gold price. The 21-day SMA is closing in to cut the 50-day SMA from above. If that happens on a daily closing basis, it will validate the bearish crossover.
These technical indicators suggest that the tide could be turning in favor of Gold sellers.
The immediate support is around $2,670, where the 21-day SMA and the 50-day SMA close in.
A sustained break below that level could initiate a fresh downtrend toward $2,600. The November 20 low of $2,619 will be tested ahead of that.
On the other hand, Gold buyers need a daily candlestick closing above the November 5 high of $2.750 to resume the uptrend toward the all-time high of $2,790.
Gold has played a key role in human’s history as it has been widely used as a store of value and medium of exchange. Currently, apart from its shine and usage for jewelry, the precious metal is widely seen as a safe-haven asset, meaning that it is considered a good investment during turbulent times. Gold is also widely seen as a hedge against inflation and against depreciating currencies as it doesn’t rely on any specific issuer or government.
Central banks are the biggest Gold holders. In their aim to support their currencies in turbulent times, central banks tend to diversify their reserves and buy Gold to improve the perceived strength of the economy and the currency. High Gold reserves can be a source of trust for a country’s solvency. Central banks added 1,136 tonnes of Gold worth around $70 billion to their reserves in 2022, according to data from the World Gold Council. This is the highest yearly purchase since records began. Central banks from emerging economies such as China, India and Turkey are quickly increasing their Gold reserves.
Gold has an inverse correlation with the US Dollar and US Treasuries, which are both major reserve and safe-haven assets. When the Dollar depreciates, Gold tends to rise, enabling investors and central banks to diversify their assets in turbulent times. Gold is also inversely correlated with risk assets. A rally in the stock market tends to weaken Gold price, while sell-offs in riskier markets tend to favor the precious metal.
The price can move due to a wide range of factors. Geopolitical instability or fears of a deep recession can quickly make Gold price escalate due to its safe-haven status. As a yield-less asset, Gold tends to rise with lower interest rates, while higher cost of money usually weighs down on the yellow metal. Still, most moves depend on how the US Dollar (USD) behaves as the asset is priced in dollars (XAU/USD). A strong Dollar tends to keep the price of Gold controlled, whereas a weaker Dollar is likely to push Gold prices up.
The Gold price (XAU/USD) jumps to around $2,720 during the early Asian session on Monday. The sell-off in the US Dollar (USD) provides some support to the USD-denominated Gold price. Additionally, rising geopolitical tensions continue to underpin safe-haven assets like yellow metal.
Investors will closely monitor the developments surrounding the Russia-Ukraine conflicts. Last week, Russian President Vladimir Putin lowered the threshold for a nuclear strike in response to a broader range of conventional attacks, days after reports said Washington DC, had allowed Ukraine to use US-made weapons to strike deep into Russian territory. This, in turn, might boost the safe-haven flows, benefiting the precious metal price.
“It’s really one main geopolitical factor that’s at play here in the gold market over the course of the last several days – the increased tensions between Ukraine and Russia is probably most notable,” noted David Meger, director of metals trading at High Ridge Futures.
On the other hand, several Federal Reserve (Fed) officials remain cautious about rate reductions, which might cap the Gold’s upside. The market is adjusting its expectations for the Fed’s cuts next year as inflation is becoming a bigger concern. Higher rates reduce the appeal of gold. According to the CME FedWatch Tool, futures traders are now pricing in 50.9% odds that the Fed will cut rates by a quarter point, down from around 69.5% a month ago.
Gold has played a key role in human’s history as it has been widely used as a store of value and medium of exchange. Currently, apart from its shine and usage for jewelry, the precious metal is widely seen as a safe-haven asset, meaning that it is considered a good investment during turbulent times. Gold is also widely seen as a hedge against inflation and against depreciating currencies as it doesn’t rely on any specific issuer or government.
Central banks are the biggest Gold holders. In their aim to support their currencies in turbulent times, central banks tend to diversify their reserves and buy Gold to improve the perceived strength of the economy and the currency. High Gold reserves can be a source of trust for a country’s solvency. Central banks added 1,136 tonnes of Gold worth around $70 billion to their reserves in 2022, according to data from the World Gold Council. This is the highest yearly purchase since records began. Central banks from emerging economies such as China, India and Turkey are quickly increasing their Gold reserves.
Gold has an inverse correlation with the US Dollar and US Treasuries, which are both major reserve and safe-haven assets. When the Dollar depreciates, Gold tends to rise, enabling investors and central banks to diversify their assets in turbulent times. Gold is also inversely correlated with risk assets. A rally in the stock market tends to weaken Gold price, while sell-offs in riskier markets tend to favor the precious metal.
The price can move due to a wide range of factors. Geopolitical instability or fears of a deep recession can quickly make Gold price escalate due to its safe-haven status. As a yield-less asset, Gold tends to rise with lower interest rates, while higher cost of money usually weighs down on the yellow metal. Still, most moves depend on how the US Dollar (USD) behaves as the asset is priced in dollars (XAU/USD). A strong Dollar tends to keep the price of Gold controlled, whereas a weaker Dollar is likely to push Gold prices up.
I wrote on 17th November that the best trade opportunities for the week were likely to be:
The weekly gain of 10.74% equals 5.37% per asset.
Last week’s key takeaways were:
Apart from the inflation data, there were no data points last week that were truly interesting to the market, and even inflation is no longer the concern it was some months ago. Markets are more interested right now in global growth and the likely appointments of the upcoming Trump administration, which will take power in January. We saw US and European stock markets gaining again last week as risk sentiment in parts of the world improved.
The coming week’s schedule is again relatively light. Still, it has some important inflation-related data (including in the USA) and central bank releases from the US Federal Reserve and the Reserve Bank of New Zealand.
I made no monthly forecast for November, as the long-term trends in the Forex market were too unclear.
I made no weekly forecast this week, as there were no unusually strong directional price movements over the past week, which is the basis of my weekly trading strategy.
Last week, the Australian Dollar was the strongest major currency, while the Euro was the weakest. Like the previous week, one-third of the most important Forex currency pairs and crosses changed in value by over 1%.
You can trade these forecasts in a real or demo Forex brokerage account.

Last week, the US Dollar Index printed a bullish candlestick that continued the recent breakout beyond the resistance level at 105.81, as well as the upper trend line of the formerly dominant consolidating triangle chart pattern, which can be seen in the price chart below. The price reached a new 2-year high. These are bullish signs, but it should be noted that the candlestick has a large upper wick, showing that the Dollar struggled to hold some of its gains. Another bearish note is hit by the price retreating from a high very close to the nearest overhead resistance level at 107.95.
The price is above its levels from three and six months ago, suggesting a long-term bullish trend in the greenback that should be exploitable.
The strong US Dollar is supported by the expectation that the new Trump / Republican control of the executive and legislature in the USA will lead to a more hawkish monetary policy. This has been evidenced by the strong increase in US Treasury Yields over recent weeks.
I have plenty of technical and fundamental reasons to be bullish on the US Dollar. However, the upside over the coming week might be limited, so long-term trades long of the USD might be more successful than short-term trades.

Bitcoin saw another week of extraordinary gains as it powered to new all-time highs, topping just below the big round number at $100,000, which has still not been reached. The price rose by almost 10% last week.
There is no reason not to be bullish except that the price is now very close to the huge six-figure round number at $100,000. If the price arrives at, or very close to, that point, we will likely see massive profit taking as there will be a 25% gain within just a few weeks, an enormous rise in value for any asset. So, this leg of the bull run, or this whole trend, may not have much further to run.
Bitcoin received a significant boost from the election victories of President Trump and Congressional Republicans in both Houses. Republicans are seen as more likely to favour lighter regulation of cryptocurrency, so their ascendancy has boosted both crypto in particular and risk sentiment in general, which also helps a risky asset like Bitcoin.
It is smart to be long of Bitcoin, but be mindful of $100,000 as a potentially strong barrier. With such momentum and strong gains, a trend or momentum trader should be interested. However, waiting for a daily (New York) close above $100,000 before entering a new long trade in Bitcoin will probably be wise.
Note that Bitcoin ETFs are not getting the full gain made by the underlying, so if you can afford it, you might want to buy Bitcoin futures instead of a Bitcoin ETF or even spot Bitcoin. There are Bitcoin micro futures available on the CME, which are only sized at 10% of the value of one Bitcoin.

Last week, the EUR/USD currency pair printed a relatively large bearish candlestick, which made the lowest weekly close seen in almost two years. The weekly candlestick closed some way from its low, with a noteworthy lower wick on the candlestick. The price is below its levels from both 3 and 6 months ago, which is my preferred metric for calling a long-term bearish trend. The US Dollar Index is also in a long-term bearish trend. A final bearish filter is that the 50-day moving average is below the 100-day moving average, which validates the trend.
There are plenty of reasons to be short here, but I am a bit concerned about Friday’s spike lower and the fairly strong bounce. However, the price feels heavy, and lower prices are likely over the coming week.
A shorter-term approach is to look for short swing trades from retests and rejections of resistance levels above the current price.


I expected the USD/JPY currency pair to have potential support at ¥153.33.
The H1 price chart below shows how the price action rejected this support level with a small hourly pin bar, marked by the up arrow within the price chart below. This rejection occurred soon after the start of the overlap of the London / Tokyo sessions, which can often be a great time for reversals in Japanese Yen currency pairs and crosses.
Note that this multi-candlestick reversal took a while to set up, but it was worth the wait for a decisive change in direction.
So far, this trade has given a maximum profit of slightly more than 1.5 to 1.
The US Dollar remains in a long-term bullish trend, and the Japanese Yen is prone to weakness, so long trade setups in this currency pair might be something to watch out for.

I expected that the USD/CHF currency pair would have potential support at $0.8805
The H1 price chart below shows how the price action rejected this support level with a strong hourly inside bar, marked by the up arrow within the price chart below. This rejection occurred soon after the start of the overlap of the London / New York sessions, which can often be a great time for reversals in the US Dollar.
So far, this trade has given an excellent maximum profit approximately 1.5 to 1.
The US Dollar is in a strong long-term bullish trend, and the Swiss Franc is relatively weak, like the Euro with which it is strongly positively correlated, so there may be more opportunities for long trades here over the coming days and weeks.

The NASDAQ 100 Index rose last week, closing right on the high of its range, which is a bullish sign. This is a healthy bullish rebound within a long-term bullish trend. The linear regression analysis applied in the price chart below also shows a consistent bullish trend over the shorter term.
The strong trend and the election victories of Trump and Congressional Republicans have provided a tailwind for higher stock market prices in the USA. Notably, many other countries are seeing their stock markets struggling, partly due to fears that the new Trump administration will impose tariffs on US imports.
The question now is whether the price will continue to rise and make a new record high above the record high it set a couple of weeks ago.
I see the NASDAQ 100 Index as a buy once it makes a new record high closing price.

My analysis of the S&P 500 Index is exactly the same as my analysis of the NASDAQ 100 Index above.

I see the best trading opportunities this week as
Ready to trade our Forex weekly forecast? Check out our list of the top 10 Forex brokers in the world worth reviewing.
If we can break through there, then I think a lot of upward momentum re-enters the market. That being said, you also have to keep in mind that traders will continue to look at the overall risk appetite. And if that picks up, that should help. We do get core retail sales out of Canada on Friday, so that might be a mover as well. This will be especially true if retail sales in Canada, much stronger than anticipated, as it could only exacerbate the move to the upside and the potential breakout.
The 50 day EMA is starting to get towards the 200 day EMA. And it looks like we are trying to get a bit of a bullish cross, which of course helps the idea of longer term traders jumping in with the so called golden cross underneath. We have support at 109 yen. As long as we can stay above that level, I really don’t see a situation where the market breaks down.
And to the upside, we could go as high as 115 yen. I do expect this to happen sooner or later. But also keep in mind that the Canadian dollar is heavily influenced by crude oil, which hasn’t really been that great as of late. So ultimately, this is a market that’s building up pressure, but it can’t break out quite yet. If and when it does, it could be quite brutal.
Want to trade our daily forex analysis and predictions? Here’s a list of forex brokers in Japan to check out.
A rally above today’s high will trigger a bullish breakout above the line before crude quickly encounters potential resistance around the 50-Day MA pivot, which is at 71.23. That is followed by the top of a declining consolidation pattern (red box) from around 73.15 to 73.27. Crude missed a chance to continue to fall following a bearish trigger on Monday.
Instead, it dropped below prior lows but then quickly reversed higher and ended the day with a bullish key reversal day. The bullish continuation of that one-day reversal has been struggling as crude is rising into a swath of potential resistance, given that it remains within a larger consolidation pattern.
Today’s advance showed strength by reclaiming the 20-Day MA (purple) above 69.97. Given where crude is trading at the time of this writing, it still has a chance to close the day above the line. If it does, that would be another minor sign of strength that needs follow-through. A breakout through a key price level in either direction that quickly reverses in a decisive fashion, is a failure of a breakout attempt. Typically, the reversal of the breakout can be accompanied by sharp moves in the opposite direction. That may still happen with crude if today’s high is exceeded. This does not mean that it will do so, it is only a possibility until further signs of strength are seen.
There is another price level representing a key pivot that also needs to be considered. Last week’s high was 70.84. Therefore, an advance above that high will trigger a bullish reversal on the weekly time frame. It would be reached shortly after a breakout above today’s high.
On the downside, a drop below today’s low of 69.16 may lead to a bearish pullback to test support around this week’s lows. Since resistance is being seen around where some signs of resistance would be expected, at the downtrend line, that scenario may yet play out.
Silver price recovered some ground on Friday and reclaimed the $31.00 a troy ounce, boosted by falling US Treasury bond yields and despite a firm US Dollar. At the time of writing, the XAG/USD trades at $31.28, a gain of over 1.62%.
The grey metal has consolidated within the $30.50-$31.50 range for the last four days, capped on the upside by the 50-day Simple Moving Average (SMA) at $31.75. If Silver extends its rally above the latter, the $32.00 psychological figure would be up next. Once cleared, further upside is seen, with the $33.00 mark up next, ahead of the October 29 peak at $34.54.
For a bearish continuation, XAG/USD first support would be $31.00. Once surpassed, the next demand zone would be $30.00, followed by the November 14 low of $29.68. On further weakness, the next stop would be the 200-day Simple Moving Average (SMA) at $28.91.
Oscillators such as the Relative Strength Index (RSI) suggest buyers are gathering steam, yet the RSI is still below its neutral line. Hence, the bias is neutral-bullish.
Silver is a precious metal highly traded among investors. It has been historically used as a store of value and a medium of exchange. Although less popular than Gold, traders may turn to Silver to diversify their investment portfolio, for its intrinsic value or as a potential hedge during high-inflation periods. Investors can buy physical Silver, in coins or in bars, or trade it through vehicles such as Exchange Traded Funds, which track its price on international markets.
Silver prices can move due to a wide range of factors. Geopolitical instability or fears of a deep recession can make Silver price escalate due to its safe-haven status, although to a lesser extent than Gold’s. As a yieldless asset, Silver tends to rise with lower interest rates. Its moves also depend on how the US Dollar (USD) behaves as the asset is priced in dollars (XAG/USD). A strong Dollar tends to keep the price of Silver at bay, whereas a weaker Dollar is likely to propel prices up. Other factors such as investment demand, mining supply – Silver is much more abundant than Gold – and recycling rates can also affect prices.
Silver is widely used in industry, particularly in sectors such as electronics or solar energy, as it has one of the highest electric conductivity of all metals – more than Copper and Gold. A surge in demand can increase prices, while a decline tends to lower them. Dynamics in the US, Chinese and Indian economies can also contribute to price swings: for the US and particularly China, their big industrial sectors use Silver in various processes; in India, consumers’ demand for the precious metal for jewellery also plays a key role in setting prices.
Silver prices tend to follow Gold’s moves. When Gold prices rise, Silver typically follows suit, as their status as safe-haven assets is similar. The Gold/Silver ratio, which shows the number of ounces of Silver needed to equal the value of one ounce of Gold, may help to determine the relative valuation between both metals. Some investors may consider a high ratio as an indicator that Silver is undervalued, or Gold is overvalued. On the contrary, a low ratio might suggest that Gold is undervalued relative to Silver.
It was an awful week for EUR/USD. In fact, the fourth quarter has been dreadful so far for the European currency. Since late September’s yearly highs, above 1.1200, the pair has closed with gains in just one week. The Fiber has retreated nearly 8% since then or more than eight cents.
The Euro has had a rough ride lately, with much of its weakness amplified by a resurgent US Dollar (USD). The Greenback has gained fresh momentum, fueled by the sudden resurgence of geopolitical tensions — particularly in the Russia-Ukraine conflict — as well as the revival of the so-called “Trump trade.” Against this backdrop, the US Dollar Index (DXY) surged to a new cycle high, climbing above the 108.00 mark for the first time since early November 2022.
Considering the same scenario, if EUR/USD lost eight big figures in nearly two months, a “meagre” three-cent drop could seem even more likely.
Aside from the current oversold condition of the single currency, there’s little to suggest a near-term rebound — let alone a sustainable recovery.
The prospects for a stronger US Dollar dominate sentiment and are only occasionally tempered by technical corrections as investors are expected to back the “Trump trade” throughout most of 2025.
On the domestic front, preliminary indicators of business activity in both Germany and the broader Euroland are far from encouraging. Adding to this, the bleak outlook for the German economy — exacerbated by visible political instability and stagnant economic activity across the bloc — doesn’t bode well for the Euro.
And that’s without even considering the performance of the US economy.
Looking ahead, the specter of renewed tariffs on European or Chinese goods under a possible Trump administration could stir up inflation in the US. If the Fed continues its cautious approach — or even tilts hawkish in response — the USD could strengthen further, keeping EUR/USD under pressure.
On the monetary policy front, the Federal Reserve (Fed) cut its benchmark interest rate by 25 basis points at its November 7 meeting, bringing the Fed Funds Target Range (FFTR) to 4.75%-5.00%. This widely expected move is part of the Fed’s ongoing effort to steer inflation closer to its 2% target. However, cracks are beginning to appear in the labour market, even as unemployment rates remain near historic lows.
Fed Chair Jerome Powell struck a cautious tone in his latest remarks, signalling that the central bank is in no rush to lower rates further. This has dampened speculation about a December rate cut while simultaneously providing additional support for the Dollar.
Other Fed officials, notably Governor Michelle Bowman, echoed Powell’s sentiment, emphasising the need for restraint when considering future rate reductions.
Meanwhile, across the Atlantic, a dovish narrative continues to dominate among European Central Bank (ECB) policymakers, despite October’s uptick in the Harmonised Index of Consumer Prices (HICP) and higher Negotiated Wage Growth in the third quarter.
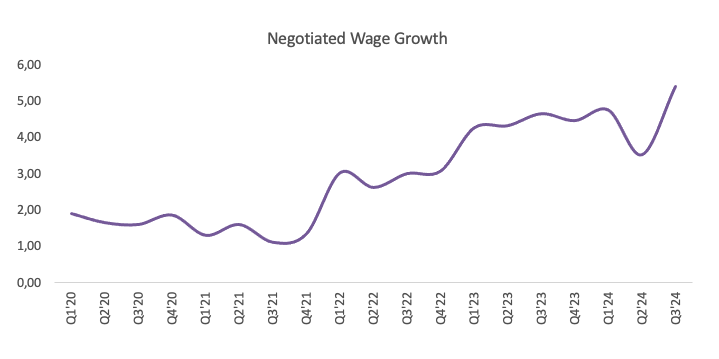
So far, markets are pricing in approximately 75 basis points of easing by the Fed over a 12-month horizon, compared to around 150 basis points of rate reductions expected from the ECB within the same period.
Further losses could push EUR/USD down to its 2024 low of 1.0331 (November 22). The breakdown of this level could open the door to a probable visit to the weekly lows of 1.0290 (November 30 2022) and 1.0222 (November 21).
On the upside, there is minor resistance at the weekly top of 1.0606 (November 18), seconded by the critical 200-day Simple Moving Average (SMA) at 1.0857.
It is worth noting that the short-term technical outlook remains bearish as long as the pair stays below the latter.
Furthermore, the daily Relative Strength Index (RSI) entered the oversold region near 16, while the Average Directional Index (ADX) at nearly 49 indicates a strong trend.
The Core Harmonized Index of Consumer Prices (HICP) measures changes in the prices of a representative basket of goods and services in the European Monetary Union. The HICP, – released by Eurostat on a monthly basis, is harmonized because the same methodology is used across all member states and their contribution is weighted. The YoY reading compares prices in the reference month to a year earlier. Core HICP excludes volatile components like food, energy, alcohol, and tobacco. The Core HICP is a key indicator to measure inflation and changes in purchasing trends. Generally, a high reading is seen as bullish for the Euro (EUR), while a low reading is seen as bearish.
Next release: Fri Nov 29, 2024 10:00 (Prel)
Frequency: Monthly
Consensus: –
Previous: 2.7%
Source: Eurostat
The European Central Bank (ECB) in Frankfurt, Germany, is the reserve bank for the Eurozone. The ECB sets interest rates and manages monetary policy for the region. The ECB primary mandate is to maintain price stability, which means keeping inflation at around 2%. Its primary tool for achieving this is by raising or lowering interest rates. Relatively high interest rates will usually result in a stronger Euro and vice versa. The ECB Governing Council makes monetary policy decisions at meetings held eight times a year. Decisions are made by heads of the Eurozone national banks and six permanent members, including the President of the ECB, Christine Lagarde.
In extreme situations, the European Central Bank can enact a policy tool called Quantitative Easing. QE is the process by which the ECB prints Euros and uses them to buy assets – usually government or corporate bonds – from banks and other financial institutions. QE usually results in a weaker Euro. QE is a last resort when simply lowering interest rates is unlikely to achieve the objective of price stability. The ECB used it during the Great Financial Crisis in 2009-11, in 2015 when inflation remained stubbornly low, as well as during the covid pandemic.
Quantitative tightening (QT) is the reverse of QE. It is undertaken after QE when an economic recovery is underway and inflation starts rising. Whilst in QE the European Central Bank (ECB) purchases government and corporate bonds from financial institutions to provide them with liquidity, in QT the ECB stops buying more bonds, and stops reinvesting the principal maturing on the bonds it already holds. It is usually positive (or bullish) for the Euro.
The table below shows the percentage change of British Pound (GBP) against listed major currencies today. British Pound was the strongest against the Swiss Franc.
| USD | EUR | GBP | JPY | CAD | AUD | NZD | CHF | |
|---|---|---|---|---|---|---|---|---|
| USD | 0.72% | 0.63% | 0.25% | 0.10% | 0.25% | 0.57% | 0.94% | |
| EUR | -0.72% | -0.08% | -0.45% | -0.61% | -0.44% | -0.14% | 0.23% | |
| GBP | -0.63% | 0.08% | -0.37% | -0.53% | -0.38% | -0.06% | 0.31% | |
| JPY | -0.25% | 0.45% | 0.37% | -0.15% | 0.00% | 0.31% | 0.69% | |
| CAD | -0.10% | 0.61% | 0.53% | 0.15% | 0.14% | 0.47% | 0.84% | |
| AUD | -0.25% | 0.44% | 0.38% | 0.00% | -0.14% | 0.33% | 0.72% | |
| NZD | -0.57% | 0.14% | 0.06% | -0.31% | -0.47% | -0.33% | 0.36% | |
| CHF | -0.94% | -0.23% | -0.31% | -0.69% | -0.84% | -0.72% | -0.36% |
The heat map shows percentage changes of major currencies against each other. The base currency is picked from the left column, while the quote currency is picked from the top row. For example, if you pick the British Pound from the left column and move along the horizontal line to the US Dollar, the percentage change displayed in the box will represent GBP (base)/USD (quote).