The main category of Forex News.
You can use the search box below to find what you need.
[wd_asp id=1]
The main category of Forex News.
You can use the search box below to find what you need.
[wd_asp id=1]
Gold price has staged a solid comeback so far this Tuesday’s trading after hitting a six-day low at $2,605 in early dealings. Gold buyers look forward to the Minutes of the US Federal Reserve’s (Fed) November meeting for the next push higher.
Gold price extended the previous day’s corrective downside and reached multi-day lows before drawing strong support from a fresh flight to safety wave, triggered by the latest post by US President-elect Donald Trump on Truth Social.
Trump pledged to announce a 25% tariff on all products from Mexico and Canada and an additional 10% tariff on goods from China once he takes over his office on January 20. In response, the Chinese ambassador to Australia warned that “US policy on trade with China and other countries will have an impact.”
Mounting concerns surrounding a looming global trade war dent risk sentiment, ramping safe-haven flows into the US Dollar (USD) and the traditional safety bet Gold price. However, the renewed USD demand and rebounding US Treasury bond yields limit Gold buyers’ enthusiasm as they await the Fed Minutes for fresh signals on the expected December interest rate cut.
CME Group’s FedWatch Tool shows that markets are currently pricing in a 61% chance that the Fed will lower rates next month.
Additionally, waning geopolitical tensions between Israel and Lebanon remain a headwind for the bright metal. A senior Israeli official told Reuters on Monday that the Israeli cabinet will convene on Tuesday to approve a Lebanon ceasefire deal. Another Israeli official told Reuters the cabinet would convene to discuss a deal that could be cemented in the coming days.
Gold price was thrown under the bus on Monday even as the USD and the US Treasury bond yields fell sharply on the news that US President-elect Donald Trump named billionaire Scott Bessent as his Treasury Secretary.
Bessent’s appointment to the critical position in the Trump administration assured the US bond market, as he is seen as an old Wall Street hand and a fiscal conservative.
At the time of writing, Gold price is consolidating the bounce near $2,625 as buyers stay cautious amid an impending Bear Cross.
The 21-day SMA is closing in to cut the 50-day SMA from above. If that happens on a daily closing basis, it will validate the bearish crossover.
Adding credence to the downside potential, the 14-day Relative Strength Index (RSI) has found a foothold below the 50 level, currently at 45.50.
The immediate support is at the intraday low of $2,605, below which a drop toward the 100-day SMA at $2,566 cannot be ruled out.
A sustained break below that level could challenge the November 14 low of $2,537.
Conversely, Gold buyers need a daily candlestick closing above the confluence of the 21-day SMA and the 50-day SMA at $2,667.
The next topside barriers are seen at the $2,700 level and Monday’s high of $2,721.
FOMC stands for The Federal Open Market Committee that organizes 8 meetings in a year and reviews economic and financial conditions, determines the appropriate stance of monetary policy and assesses the risks to its long-run goals of price stability and sustainable economic growth. FOMC Minutes are released by the Board of Governors of the Federal Reserve and are a clear guide to the future US interest rate policy.
Next release: Tue Nov 26, 2024 19:00
Frequency: Irregular
Consensus: –
Previous: –
Source: Federal Reserve
In the third article in our weekly series on precious metals, we visit the platinum market, with analysis from Metals Focus, this time supplemented with further material from Trend Intelligence.
Platinum prices traded rangebound in 2022 and 2023 and this pattern has continued in 2024, with the metal trading between the same $850 and $1,100. This behaviour has been seen since mid-2021, and persisted even as gold rallied by more than $600 to record highs this year.
Platinum’s trading range has become somewhat self-fulfilling, with investors buying at the lower end and selling at the upper. To some extent, this floor stems from its largest physical deficit since 2002 (based on JM data before 2010), while abundant above-ground stocks from surplus years between 2016 and 2022 have provided much of the cap on prices.
As an example of platinum’s rangebound trading behaviour, net managed money positions have swung between net long and net short eight times this year, while gold and palladium have remained consistently net long and net short, respectively.
CME managed money net longs peaked in January at 1.2Moz, while the lows of 1Moz net short came in March, as investors traded platinum’s range. Platinum ETPs rose 9% ytd by end-August, driven by European investors capitalising on the metal’s relative value versus gold. However, profit taking above $1,000 and selling during early August’s global equity market turbulence caused positions to fall by 6% from June’s peak of 3.58Moz (111t).
In contrast to ETPs, retail investment demand has fallen sharply. In Japan, net disinvestment resumed due to higher yen-denominated prices, while North American demand has weakened due to such drivers as the absence of a US Mint platinum Eagle.
Platinum imports into China supported prices during 2021–2023, at times even resulting in physical market tightness. However, prior stockpiling and China’s economic slowdown have led to slower imports this year. This slack has since been picked up by opportunistic investors and the physical market deficit.
“Despite this, Chinese imports remain strongly inversely correlated to price,” Metals Focus said in its annual precious metals review. “Therefore, if the platinum price falls below its current range, we expect increased interest from speculative Chinese investors.”
Platinum’s physical market balance remains in deficit for 2024, marking the second consecutive year of a shortfall. Both mined and recycled supply have stayed subdued for a third year. Mine production remains under pressure from the low basket price, which has led to cost-cutting initiatives, including shaft closures and labour retrenchments.
Autocatalyst recycling remains under pressure, as consumers keep vehicles for longer and scrapyards are hoarding material hoping for higher prices. Like supply, total platinum demand shows minimal change year-on-year. Growth in glass and a fall in chemicals demand largely balance each other out, as cyclical LCD capacity expansions offset slower Chinese paraxylene capacity growth.
The key demand sectors, automotive and jewellery, should prove more stable, according to Metals Focus, growing 1% and 6% respectively. Overall, platinum’s physical deficit is expected to reach 653koz (20.3t) in 2024, similar to the 2023 deficit. As a result, above-ground stocks are projected to fall to 9.6Moz (299t), equivalent to 15 months of demand.
Platinum has mostly traded rangebound between $850 and $1,100 since late 2021, and 2024 has been similar with a low of $869 (March) and a peak of $1,096 (May). This rangebound trend has become self-fulfilling, with investors buying in the low $900s and selling above $1,000.
“We expect this trend to persist in the short-term, while platinum’s fundamentals benefit the metal in the longer-term,” Metals Focus said.
Platinum has been supported in this trend during 2024 by the metal’s physical deficit of 653koz (20.3t), the market’s deepest deficit since 2002 (looking at JM data before 2010). Although this eases slightly in 2025, to 528koz (16.4t), the deficit will continue to support the price.
The easing deficit will be driven by increased supply, led by double-digit growth in autocatalyst scrap. Over the past three years, scrap supply was constrained by semiconductor shortages, high interest rates, and lower vehicle turnover. These constraints are expected to ease and have the potential of significantly boosting recycled supply in 2025.
However, Metals Focus believes mine supply will continue falling in 2025 due to low basket prices pressuring margins, leading to attrition from cost cutting at South African operations.
Conversely, overall platinum demand is expected to remain flat year-on-year. This is primarily due to a significant drop in cyclical capacity expansions of LCD production, which boosted platinum glass demand in 2024. However, growth in other sectors (including automotive, jewellery,
chemicals, and hydrogen) will offset this.
Automotive demand for platinum is projected to climb 3%, driven by continued substitution of palladium and higher loadings in heavy duty vehicles, despite a fall in light duty catalysed vehicle production. In contrast to the long-term bearish outlook for autocatalysts, hydrogen demand is expected to exceed 100koz for the first time in 2025.
Furthermore, the sector is experiencing strong double-digit growth, which will play a key role in supporting platinum’s positive outlook. Additionally, retail investors are expected to turn more positive to platinum with net coin and bar demand forecast to rise by 18% next year.
“Longer term, we are favourable to platinum, owing to its deficit market, and see the metal trending steadily higher,” Metals Focus said. “However, ample above-ground stocks will dampen the impact of these deficits in the short term, and platinum’s entrenched rangebound trend is likely to remain a barrier to any significant price breakout.”
Although some investors have lost faith in the metal after investing prematurely for the hydrogen narrative (which has been slower to materialise than expected), renewed hope stems from this potential. This, combined with weakening BEV sales and platinum’s undervaluation relative to gold, will offer long-term investors new optimism.
Therefore, Metals Focus forecasts an annual average price of $1,070 in 2025. This represents a 13% rise but is still within its current trading range, with potential breakout highs of $1,200. Alongside gold’s later retracement, Metals Focus expects the platinum-gold spread to narrow to $1,260 by Q4.25, down from its current all-time high of over $1,600.
Looking at the analysis of the platinum price now from Trend Intelligence, we can see some further reinforcement of the Metals Focus findings. In the first chart below we see the platinum price moving above two of Trend’s moving averages, but the averages remain organised in a fully negative configuration – the shorter average is below the median and long term averages. The platinum price is trading within the Japanese Cloud indicator as well, and its delay line has broken above the cloud. The most recent Japanese average candle is green. Overall this represents a neutral trend.

The second chart is the D* Momentum Indicator, which is positive for platinum; the negative D* line is below the positive green line.
The third chart, the R* Momentum Indicator, is negative, while the white signal line is positive. The data points are trending downwards. This looks to be another neutral indicator for platinum.
The final indicator is the M* Momentum, which is also neutral, as the fast red M* line is above the white signal line, but below the zero cut-off.
Overall, Trend Intelligence sees the long-term view for platinum as a continuation of the weak/neutral trend. This summary shows price action operating above two of the moving averages and within the Japanese Cloud. Most of the momentum indicators are producing neutral signals.
Significant and sustained short-term changes in price can positively or negatively impact the long-term trend.
Spot GOLD trades around $2,630, having shed roughly $30 after Wall Street’s opening. The bright metal has been under selling pressure since early in Asia, maintaining a sour tone as the day comes to an end. XAU/USD fell despite the broad US Dollar’s weakness, as a better market mood pushed investors away from safe-haven assets.
Investors welcomed headlines indicating a cease-fire agreement between Israel and Hezbollah is very close, according to the Israeli ambassador to the United States (US). Authorities are expected to announce on Tuesday a 60-day cease-fire, with hopes that it could be resolved in such a pause.
Demand for the Greenback increased in the last Monday’s session, helped by the solid performance of US indexes and encouraging US data. The country reported that the Chicago Fed National Activity Index was down a modest 0.4 in October, following an upwardly revised -0.27 in September. At the same time, the November Dallas Fed Manufacturing Business Index posted -2.7, slightly better than the previous -3.
The focus this week will be on the US Personal Consumption Expenditures (PCE) Price Index, the Federal Reserve’s (Fed) favourite inflation gauge, which will be published on Wednesday. The country will release alongside the second estimate of the Q3 Gross Domestic Product (GDP).
The daily chart for XAU/USD shows the risk skews to the downside. The pair accelerated south after breaking below a now bearish 20 Simple Moving Average (SMA), while technical indicators turned sharply lower within negative levels after failing to overcome their midlines. The 100 and 200 SMAs maintain their upward slopes, with the shorter one currently at around $2,563, a critical support level in the upcoming sessions.
In the near term, and according to the 4-hour chart, XAU/USD is also at risk of extending its slide. The pair fell below all its moving averages, with the 100 SMA gaining downward momentum at around $2,655. Finally, technical indicators head firmly south within negative levels without showing signs of bearish exhaustion.
Support levels: 2,626.10 2,611.35 2,598.70
Resistance levels: 2,640.40 2,655.00 2,671.55
GBP/JPY may have reversed both its short and medium-term uptrends after the last bout of weakness. If so, the pair could see more downside on the horizon since it is a principle of technical analysis that the odds favor extensions of trends.
GBP/JPY began selling off on October 31 after it peaked at 199.81 on the preceding day. Since then it has staircased down, reaching a new low in the 192.80s on November 22 – seven whole Japanese Yen (JPY) to the Pound Sterling (GBP) lower than at the end of October.
It has also broken below all three major Simple Moving Averages (SMA), the 50, 100 and 200-day SMAs on a closing basis.
The (blue) Moving Average Convergence Divergence (MACD) momentum indicator line has both crossed below the red signal line and below the zero level, and taken together these are bearish signs.
A break below the 192.80 level could open the way to further losses with the next target at around 189.56, the low of the Right-Angled triangle that formed in late September and early October.
Once Monday’s session is complete, pivots are at the day’s high of 3.46 and the low of 3.26. A decisive move through either has the potential to lead to a continuation in the same direction. Moreover, be cautious of false breakouts, either up or down, that quickly reverse back into today’s trading range. Natural gas rallied above three key pivots last week, indicating improving demand.
The series of lower swing highs are components of the upper boundary of a large symmetrical triangle pattern. At the same time, once the trend high of 3.56 was hit last Friday it led to a bearish engulfing day with natural gas closing below the prior day’s low after exceeding the prior day’s high earlier in the session.
Last week’s rally exceeded the top of a previously identified resistance zone with a high of 3.45. A decisive rally above today’s high will put natural gas in a position to possibly challenge last week’s high of 3.56. A little above that high is another potential resistance zone from 3.64 to 3.67. That zone is anchored by previous resistance at the peak for 2023 at 3.64. If natural gas can get above there, it will be trading at its highest price in around 22-months.
Alternatively, a drop below today’s low will likely see further testing of lower support levels. Given the bearish engulfing day last Friday and weak close, it wouldn’t be surprising to see another test of Friday’s low of 3.07. Also, watch the 3.15 swing high area on the way down for possible support. Other key potential support areas include the prior swing high at 3.02 and the 20-Day MA at 2.90.
For a look at all of today’s economic events, check out our economic calendar.
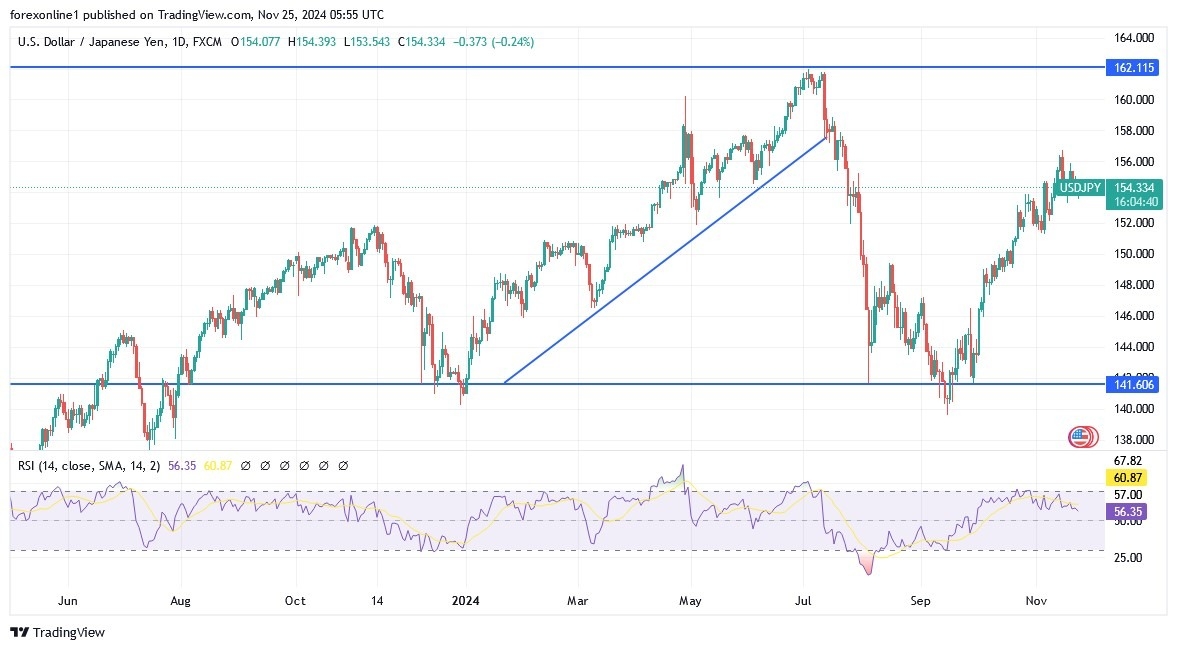
According to the Forex market trading, the price of the US dollar / Japanese yen rose by 1.79% during the trading of the current month. Moreover, the currency pair rose by 9.75% during the trading of the year 2024.
According to economic data, Japan’s core inflation rate slowed to a 9-month low of 2.3% in October, while the underlying inflation rate also fell to 2.3%, the lowest in six months, and slightly above expectations of 2.2%. On the other hand, Japan’s manufacturing sector contracted more than expected in November, despite growth in services activity.
On the monetary policy front, the Bank of Japan’s governor has indicated the possibility of raising interest rates again as early as December, citing the recent weakness in the Japanese yen. In addition, the Japanese prime minister is considering a $90 billion stimulus package to ease the impact of rising prices on households. However, the strong dollar and US Treasury yields have prevented the low-yielding Japanese yen from rising more than its recent performance.
Moreover, a Japanese survey showed that Japanese companies in China have become more pessimistic about the world’s second-largest economy, with about two-thirds saying it is getting worse and nearly half cutting or halting their investments. About 64% of Japanese companies said the Chinese economy is worse than last year, according to the latest survey by the Japan Chamber of Commerce and Industry in China.

The overall trend of the USD/JPY currency pair remains upward. The 14-period Relative Strength Index still has room to rise before moving towards oversold levels, which could happen if the bulls manage to push the pair towards the resistance levels of 155.85 and 157.00, respectively. The USD/JPY pair will remain within its current range until the return from the US holidays this week, which may affect liquidity and investor sentiment to start trading normally.
Conversely, and on the same timeframe, the upward trend of the USD/JPY currency pair will be breached if the bears return the pair towards the support level of 151.60. Otherwise, the overall trend will remain upward. We see that any downward movement of the currency pair may be an opportunity to buy. You can follow the trading signals for the USD/JPY and other free live trading signals on our website.
Want to trade our USD/JPY forex analysis and predictions? Here’s a list of forex brokers in Japan to check out.
The UK prime minister has pledged to achieve sustainable economic growth of 2.5% a year and improve living standards, a challenge for an economy that has been suffering from almost stagnant productivity since the global financial crisis of 2008-09. According to the economic calendar results, UK inflation accelerated more than expected in October to well above the Bank of England’s 2% target. UK consumer price inflation was reported to have risen by 2.3% from a year earlier after rising energy bills. Services inflation – closely watched by price makers for signs of domestic pressure – remained high at 5%.
The performance of the pound sterling against the dollar will remain under significant pressure, which is understandable given that the US economy continues to grow at a strong pace, with more growth expected in the future as Donald Trump’s pro-growth policies are awaited. Compare this to the situation in Britain, where the new government has hit businesses with huge tax increases, minimum wage hikes, and additional burdens from labour law.
Market pricing shows that investors have raised their expectations for the number of interest rate cuts that the Bank of England will make next year from two to three. Currently, the chances of a UK interest rate cut in December remain low, but a cut in February 2025 is now fully priced in.
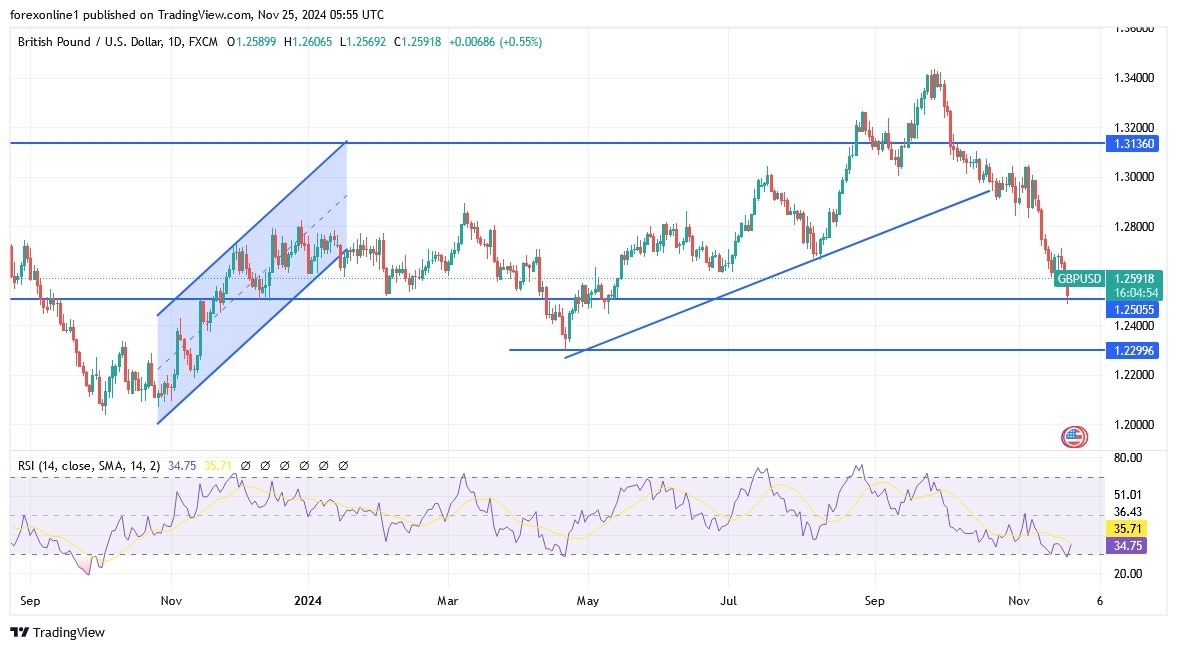
According to the daily chart performance, the overall trend of the GBP/USD currency pair remains downward. As mentioned before, moving below the 1.2500 support level will further strengthen the bears’ control of the trend. The continued strength of the current US dollar factors may push the GBP/USD pair to stronger downward levels, the closest of which are currently 1.2465, 1.2330, and 1.2200, respectively, which in turn will move all technical indicators towards oversold levels. Furthermore, any upward rebound of the GBP/USD pair will be a target for selling again for now.
You should note that the US holidays this week may negatively affect sentiment and liquidity in the markets. Therefore, it is wrong to make decisions until after the holidays and the volume of liquidity returns to avoid sudden movements that affect trading investments. Also, you can view free live trading signals for the GBP/USD pair and other distinctive trading signals on our website.
Ready to trade our GBP/USD Forex forecast? Here’s some of the best forex broker UK reviews to check out.
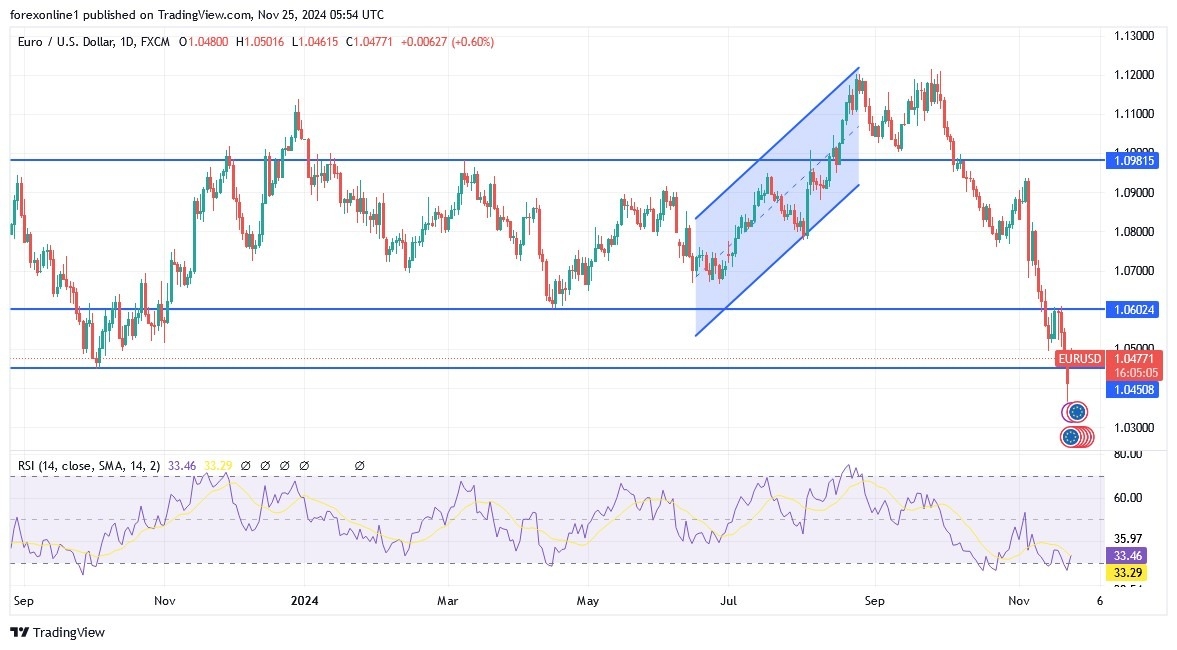
According to recent forex market trading, the Euro has declined by 4.76% against the US dollar over the past 52 weeks. Recently, the EUR/USD has declined by 4.21% since the beginning of the month. Furthermore, the Euro has declined by 5.54% against the dollar since the beginning of 2024.
Recently, investor appetite for the single European currency, the Euro, has weakened. After it was announced that business activity in the Eurozone contracted unexpectedly this month, raising concerns about the outlook for the European economy and indicating that the European Central Bank will need to be more aggressive with interest rate cuts. According to economic data results, the Purchasing Managers’ Index for service providers and manufacturers weakened. Political crises in Germany and France, as well as the threat of tariffs from the Donald Trump presidency, also affected the currency.
On another influential front, a key measure of wages in the eurozone jumped by the most since the euro was introduced for trading in 1999 – a move that complicated the European Central Bank’s plans to cut interest rates as inflation declines. As announced, negotiated wages in the third quarter rose by 5.4% year-on-year. This was higher than 3.5% in the previous three months and was largely driven by Germany.
In this regard, at the end of last week, European Central Bank President Christine Lagarde said that the European Union faces growing threats to its trade with other parts of the world and must respond by deepening capital markets to finance innovation and increase productivity. Lagarde’s concerns came as US President-elect Donald Trump wants to raise tariffs on imports from a wide range of countries.
Lagarde added, “The geopolitical environment has become less favourable, with growing threats to free trade from around the world.” Also, “As the most open of the major economies, the European Union is more exposed to these trends than others.” Added, Lagarde that with the source of growth at risk, Europe needs to move “urgently” to increase the financing available to innovative new companies that can help drive economic expansion, with many of them having to rely on funding from the United States and elsewhere.
My technical outlook for the EUR/USD currency pair remains unchanged. The overall trend remains downward, and as mentioned before, moving below the 1.0500 support level will further strengthen the bears’ control. Consequently, do not be surprised if the pair tests lower levels that may reach the currency pair’s parity level if the weakness factors from Trump’s trade and the economic slowdown in the Eurozone led by Germany continue. Currently, the closest support levels for the EUR/USD are 1.0335, 1.0280, and 1.0160, respectively. Technical indicators continue to move towards oversold levels after recent losses.
You should be cautious as the EUR/USD will remain bearish. Any attempt to rebound upwards will be a selling opportunity.
Ready to trade our EUR/USD daily forecast? We’ve shortlisted the best forex broker list for you to check out.
The GBP/USD forecast suggests further dollar strength after Trump picked Scott Bassent as the next US Treasury Secretary. Meanwhile, due to downbeat economic data, the pound remained fragile after reaching a six-month low on Friday.
–Are you interested to learn more about forex options trading? Check our detailed guide-
The greenback regained strength on Monday as bulls cheered Trump’s pick for US Treasury Secretary. After Trump’s win, Scott made remarks supporting a stronger dollar and the proposed import tariffs. Therefore, traders believe he will be bullish for the dollar.
Meanwhile, market participants are awaiting more clues for future Fed moves. On Tuesday, the US will release the FOMC meeting minutes, which might shed more light on the December meeting. The meeting came soon after Trump won the election and shifted the outlook for the US economy.
Consequently, policymakers might have assumed a more cautious tone, leading to a decline in Fed rate cut expectations. Currently, markets are pricing a 52% chance of a cut in December. Hawkish minutes might lower this likelihood below 50%, further boosting the dollar.
Meanwhile, the pound was frail after data on Friday revealed a sharper-than-expected slowdown in the UK economy. Notably, retail sales fell by 0.7%, more than the expected 0.3% decline, showing weak consumer spending.
Meanwhile, PMI data showed an unexpected decline in business activity in the manufacturing and services sectors. The manufacturing PMI came in at 48.6, compared to estimates of 50.0. The services PMI was 50.0, below forecasts of 51.9. The downbeat economic data might pressure the Bank of England to cut interest rates.
Market participants do not expect any key reports from the UK or the US today. Therefore, they will continue to absorb US political developments.

On the technical side, the GBP/USD price is collapsing after retesting the 30-SMA resistance. At the same time, the RSI is falling far below the 50 mark, indicating stronger bearish momentum. Initially, the downtrend paused at the 1.2500 support level, where the RSI made a bullish divergence.
–Are you interested in learning more about scalping forex brokers? Check our detailed guide-
The price gapped up as it revisited the 1.2600 resistance and the SMA. After that, bears took back control with a solid candle. Given the strong bearish bias, the price might soon retest the 1.2500 support level and likely break below.
Looking to trade forex now? Invest at eToro!
67% of retail investor accounts lose money when trading CFDs with this provider. You should consider whether you can afford to take the high risk of losing your money.
EUR/USD lost more than 1% for the third consecutive week but opened with a bullish gap on Monday. The pair, however, retreats slightly after testing 1.0500 and the technical outlook shows a lack of bullish momentum.
The table below shows the percentage change of Euro (EUR) against listed major currencies today. Euro was the strongest against the US Dollar.
| USD | EUR | GBP | JPY | CAD | AUD | NZD | CHF | |
|---|---|---|---|---|---|---|---|---|
| USD | -0.30% | -0.36% | 0.29% | 0.08% | -0.05% | 0.17% | -0.05% | |
| EUR | 0.30% | -0.23% | -0.02% | -0.21% | 0.17% | -0.12% | -0.33% | |
| GBP | 0.36% | 0.23% | 0.21% | 0.02% | 0.42% | 0.12% | -0.10% | |
| JPY | -0.29% | 0.02% | -0.21% | -0.20% | 0.09% | -0.05% | -0.15% | |
| CAD | -0.08% | 0.21% | -0.02% | 0.20% | 0.02% | 0.10% | -0.16% | |
| AUD | 0.05% | -0.17% | -0.42% | -0.09% | -0.02% | -0.28% | -0.50% | |
| NZD | -0.17% | 0.12% | -0.12% | 0.05% | -0.10% | 0.28% | -0.22% | |
| CHF | 0.05% | 0.33% | 0.10% | 0.15% | 0.16% | 0.50% | 0.22% |
The heat map shows percentage changes of major currencies against each other. The base currency is picked from the left column, while the quote currency is picked from the top row. For example, if you pick the Euro from the left column and move along the horizontal line to the US Dollar, the percentage change displayed in the box will represent EUR (base)/USD (quote).
News of president-elect Donald Trump nominating fund manager Scott Bessent as the US Treasury Secretary caused US Treasury bond yields to decline sharply at the weekly opening, making it difficult for the USD to find demand.
Assessing Bessent’s nomination, “Bessent, a hedge fund CEO, is known to be a fiscal hawk, so this should ease some of the more extreme deficit fears as he has advocated a 3% deficit by 2028,” said Deutsche Bank analysts. “In practise that will be extremely tough but for now the market can be a bit relieved. He is also thought to be less extreme on trade policy than some of his rivals for the job.”
In the meantime, US stock index futures are up about 0.5% in the European morning on Monday, highlighting a positive shift in risk mood. In case risk flows continue to dominate the action in financial markets after Wall Street’s opening bell, the USD could come under renewed selling pressure and help EUR/USD extend its recovery.
The European economic docket will feature IFO – Current Assessment and IFO – Business Climate figures for November. A significant decline in these business sentiment data could limit the Euro’s gains with the immediate reaction.
EUR/USD remains within a descending regression channel and the Relative Strength Index (RSI) indicator on the 4-hour chart stays below 50 despite the bullish opening to the week. On the downside, 1.0450 (mid-point of the descending channel) aligns as immediate support before 1.0400 (round level) and 1.0360 (lower limit of the descending channel).
Looking north, first resistance could be spotted at 1.0500 (round level, static level) ahead of 1.0535 (50-period Simple Moving Average (SMA), upper limit of the ascending channel) and 1.0600 (round level, static level).
The Euro is the currency for the 19 European Union countries that belong to the Eurozone. It is the second most heavily traded currency in the world behind the US Dollar. In 2022, it accounted for 31% of all foreign exchange transactions, with an average daily turnover of over $2.2 trillion a day. EUR/USD is the most heavily traded currency pair in the world, accounting for an estimated 30% off all transactions, followed by EUR/JPY (4%), EUR/GBP (3%) and EUR/AUD (2%).
The European Central Bank (ECB) in Frankfurt, Germany, is the reserve bank for the Eurozone. The ECB sets interest rates and manages monetary policy. The ECB’s primary mandate is to maintain price stability, which means either controlling inflation or stimulating growth. Its primary tool is the raising or lowering of interest rates. Relatively high interest rates – or the expectation of higher rates – will usually benefit the Euro and vice versa. The ECB Governing Council makes monetary policy decisions at meetings held eight times a year. Decisions are made by heads of the Eurozone national banks and six permanent members, including the President of the ECB, Christine Lagarde.
Eurozone inflation data, measured by the Harmonized Index of Consumer Prices (HICP), is an important econometric for the Euro. If inflation rises more than expected, especially if above the ECB’s 2% target, it obliges the ECB to raise interest rates to bring it back under control. Relatively high interest rates compared to its counterparts will usually benefit the Euro, as it makes the region more attractive as a place for global investors to park their money.
Data releases gauge the health of the economy and can impact on the Euro. Indicators such as GDP, Manufacturing and Services PMIs, employment, and consumer sentiment surveys can all influence the direction of the single currency. A strong economy is good for the Euro. Not only does it attract more foreign investment but it may encourage the ECB to put up interest rates, which will directly strengthen the Euro. Otherwise, if economic data is weak, the Euro is likely to fall. Economic data for the four largest economies in the euro area (Germany, France, Italy and Spain) are especially significant, as they account for 75% of the Eurozone’s economy.
Another significant data release for the Euro is the Trade Balance. This indicator measures the difference between what a country earns from its exports and what it spends on imports over a given period. If a country produces highly sought after exports then its currency will gain in value purely from the extra demand created from foreign buyers seeking to purchase these goods. Therefore, a positive net Trade Balance strengthens a currency and vice versa for a negative balance.