The main category of Forex News.
You can use the search box below to find what you need.
[wd_asp id=1]
The main category of Forex News.
You can use the search box below to find what you need.
[wd_asp id=1]
The Gold price (XAU/USD) rebounds to near $2,570, snapping the six-day losing streak during the early Asian trading hours on Monday. However, the strength of the US Dollar (USD) might cap the upside for the precious metal.
The Greenback rally in the wake of Donald Trump’s election win could exert some selling pressure on the USD-denominated Gold price. The expectations of higher inflation next year due to Donald Trump’s policies have led to fewer expected rate cuts.
Furthermore, traders pared back expectations for lower rates in December after Fed Chair Jerome Powell said that the US central bank would be in no rush to cut, citing the “remarkably good” performance of the economy. Higher interest rates generally drag the Gold price lower, as it makes holding non-yielding assets like gold less appealing.
On the other hand, the rising geopolitical tensions in the Middle East and the ongoing conflict between Ukraine and Russia could boost the safe-haven flows, benefiting the yellow metal. President Joe Biden’s administration has allowed Ukraine to use US arms to strike inside Russia in a significant reversal of Washington’s policy in the Ukraine-Russia conflict, per Reuters.
Gold has played a key role in human’s history as it has been widely used as a store of value and medium of exchange. Currently, apart from its shine and usage for jewelry, the precious metal is widely seen as a safe-haven asset, meaning that it is considered a good investment during turbulent times. Gold is also widely seen as a hedge against inflation and against depreciating currencies as it doesn’t rely on any specific issuer or government.
Central banks are the biggest Gold holders. In their aim to support their currencies in turbulent times, central banks tend to diversify their reserves and buy Gold to improve the perceived strength of the economy and the currency. High Gold reserves can be a source of trust for a country’s solvency. Central banks added 1,136 tonnes of Gold worth around $70 billion to their reserves in 2022, according to data from the World Gold Council. This is the highest yearly purchase since records began. Central banks from emerging economies such as China, India and Turkey are quickly increasing their Gold reserves.
Gold has an inverse correlation with the US Dollar and US Treasuries, which are both major reserve and safe-haven assets. When the Dollar depreciates, Gold tends to rise, enabling investors and central banks to diversify their assets in turbulent times. Gold is also inversely correlated with risk assets. A rally in the stock market tends to weaken Gold price, while sell-offs in riskier markets tend to favor the precious metal.
The price can move due to a wide range of factors. Geopolitical instability or fears of a deep recession can quickly make Gold price escalate due to its safe-haven status. As a yield-less asset, Gold tends to rise with lower interest rates, while higher cost of money usually weighs down on the yellow metal. Still, most moves depend on how the US Dollar (USD) behaves as the asset is priced in dollars (XAU/USD). A strong Dollar tends to keep the price of Gold controlled, whereas a weaker Dollar is likely to push Gold prices up.
(MENAFN– Daily Forex) Fundamental Analysis & market Sentiment
I wrote on 10th November that the best trade opportunities for the week were likely to be:
Long of bitcoin in USD terms. Bitcoin has risen by 12.55% over the past week.
Long of the S&P 500 index . The Index fell by 2.30% over the past week.
Long of the nasdaq 100 Index . The Index fell by 3.51% over the past week.
The weekly gain of 6.74% equals 2.25% per asset.Last week’s key takeaways were:
US CPI (inflation) – all the inflation metrics were exactly as forecasted, and the annualized rate rose to 2.6% .
US PPI – as expected, reinforcing no news on inflation.
US Retail Sales – slightly stronger than expected, at a month-on-month increase of 0.4% compared to the forecasted 0.3%. This may increase the chance of a rate hike by the Fed at its December policy meeting.
UK GDP – considerably worse than expected, showing a month-on-month contraction of 0.1% when an increase of 0.2% was expected. This increases the chance of a rate cut and has helped make the Pound the weakest of all major currencies right now.
Australian Wage Price Index – a fraction lower than expected at a quarterly increase of 0.8%. In a very small way, this may increase the case for a further rate cut.
New Zealand Inflation Expectations = 2.12%.
UK Claimant Count Change (Unemployment Claims) – more or less as expected.
Australian Unemployment Rate – as expected at 4.1%.Last week, the most important factors driving the market were not so much economic data but a growing digestion of what the Trump / Republican victory in the USA will mean economically and for markets generally. The strong slump in stock markets towards the end of the week, especially in the USA, should be cause for concern, as the major indices have almost retreated back to where they were when news of Trump’s victory began to emerge Week Ahead: 18th – 22nd NovemberThe coming week’s schedule is lighter, with the most important scheduled events likely to be inflation data releases in the UK and Canada.
UK CPI (inflation)
Canada CPI (inflation)
UK Monetary Policy Report Hearings
US Unemployment Claims
UK Retail Sales
Canada Retail Sales
US, German, UK, French Services & Manufacturing PMIMonthly Forecast November 2024 I made no monthly forecast for November, as the long-term trends in the Forex market were too unclear Forecast 17th November 2024I made no weekly forecast this week, as there were no unusually strong directional price movements over the past week, which is the basis of my weekly trading strategy.Last week, the US Dollar was the strongest major currency, while the British Pound was the weakest. One third of the most important Forex currency pairs and crosses changed in value by over 1%.You can trade these forecasts in a real or demo Forex brokerage account .Key Support/Resistance Levels for Popular Pairs Top Forex Brokers1 Get Started 74% of retail CFD accounts lose money Technical AnalysisUS Dollar IndexLast week, the US Dollar Index printed a large bullish candlestick that broke out beyond the resistance level at 105.81, as well as the upper trend line of the formerly dominant consolidating triangle chart pattern , which can be seen in the price chart below. These are bullish signs, but it should be noted that the candlestick has a large upper wick, showing that the Dollar struggled to hold some of its earlier gains as it consolidated towards the end of last week.The price is now above its levels from both three months ago and six months ago, suggesting a long-term bullish trend in the greenback, which should be exploitable.The strong US Dollar is supported by the expectation that the new Trump / Republican control of the executive and legislature in the USA will lead to a more hawkish monetary policy. This has been evidenced by the strong increase in US Treasury Yields over recent weeks.I have plenty of technical and fundamental reasons to be bullish on the US Dollar. The only bearish note comes from the price not clearing the 1-year+ high at 107.00, which was previously a major bearish inflection point, so I would be more bullish above 107.00 if the price gets established up there.
EUR/USDLast week, the EUR/USD currency pair printed a relatively large bearish candlestick, which made the lowest weekly close seen in one year. The weekly candlestick closed not far from its low, although there is enough of a lower wick on the candlestick for it to be worth noting. The price is below its levels from both 3 and 6 months ago, which is my preferred metric for calling a long-term bearish trend. The US Dollar Index is also in a long-term bearish trend. A final bearish signal is that the 50-day moving average has crossed below the 100-day moving average, which validates the trend.So, there are plenty of reasons to go short here, but I remain concerned that the price area being reached was a bullish inflection point when it was last tested, around the $1.0500 area, and there may still be demand here. This concern is strengthened by the fact that for almost 2 years, the price has ranged approximately between $1.0500 and $1.1250.The best approach here is to look for short swing trades from retests and rejections of resistance levels above the current price. GBP/USDLast week, the GBP/USD currency pair printed a large bearish candlestick, making the lowest weekly close seen in 6 months. It was the largest bearish candlestick range in several months, suggesting strong bearish momentum. The weekly candlestick closed near its low, and the British Pound was the weakest of all major currencies last week. The price is below its levels from both 3 and 6 months ago, which is my preferred metric for calling a long-term bearish trend. The US Dollar Index is also in a long-term bearish trend.There are several bearish technical signs. Turning to fundamentals, one of the reasons the Pound is weak is that the Bank of England may be forced to cut rates more quickly after last week’s very poor UK GDP data, which showed a contraction of economic activity over the month. The weakening British economy may require a faster rate cut, which will help sink the Pound.The US Dollar also remained strong following the Republican victory in the US general election, so the price could continue falling for several reasons. However, I don’t want to be short here until the trend is established for longer – I like to see the 50-day moving average below the 100-day moving average before going short. Day traders may be interested in this pair on the short side. USD/JPYThe USD/JPY currency pair gained last week in line with the general rise in the US Dollar but gave up most of its gains by the end of the week, as can be seen by the large upper wick on the most recent weekly candlestick shown within the price chart below.The moving average positions still need to be fully bullish for the long term, so I do not see this pair as fully trending. Additionally, the price is above its level of 3 months ago but still needs to reach its level of 6 months ago, reinforcing the lack of true trend. European currencies like the Euro are considerably weaker than the Yen.So, although there are reasons not to trade this pair for trend or momentum, what it does have – in conjunction with almost all the Yen crosses – is a high level of volatility, making this an interesting currency pair for Forex day traders to focus on. USD/CADThe USD/CAD currency pair made a strong gain last week, as it made a bullish breakout to a new 4-year high price, which is a significant long-term high price.The weekly close was located quite near the top of the weekly range, which is another bullish sign.The technical picture could hardly be more bullish and is supported by the fundamental picture, which sees a strong US Dollar boosted by the upcoming Trump presidency and Republican Congress, and also a weak Canadian Dollar, which is being driven lower by the global decline in the price of crude oil – WTI Crude Oil closed last week at its lowest weekly closing price in 18 months.There are many reasons to think about going long here, but remember that this currency pair typically trends little as the American and Canadian economies are so intertwined. However, there are periods in which this is not true. As we have seen some divergence between the Federal Reserve and the Bank of Canada on monetary policy in recent months, this may be such a period now. BitcoinBitcoin saw another week of extraordinary gains as it powered to new all-time highs, topping to date above $93,000. The price rose by more than 10% over the week.There is no reason not to be bullish except that the price is now not far from the huge six-figure round number at $100,000. If the price arrives at, or very close to, that point, we will likely see massive profit taking as there will be a 25% gain within just a few weeks, an enormous rise in value for any asset. So, this leg of the bull run, or maybe this whole trend, maybe does not have much further to run.Bitcoin received a significant boost from the election victories of President Trump and Congressional Republicans in both Houses. Republicans are seen as more likely to favour lighter regulation of cryptocurrency, so their ascendancy has boosted both crypto in particular and risk sentiment in general, which also helps a risky asset like Bitcoin.I think it is smart to be long of Bitcoin, just be mindful of $100,000 as a potentially strong barrier. With such momentum and strong gains, a trend or momentum trader should be interested.Note that Bitcoin ETFs are not getting the full gain made by the underlying, not in some way, so if you can afford it, you might want to buy Bitcoin futures instead of a Bitcoin ETF or even spot Bitcoin. There are Bitcoin micro futures available on the CME, which are only sized at 10% of the value of one Bitcoin. NASDAQ 100 IndexThe NASDAQ 100 Index fell last week, especially on Friday, when it made its strongest daily fall since September. The daily chart below shows that after making a new record high recently following the Trump/Republican victory in the US election, the price printed classing topping price action triggered the big drop at the end of the week.The price is now almost where it was when it became clear Trump had won the Presidency, which is an ominous sign for the market. It was expected Trump would boost stocks quite strongly, but if the price falls just a bit further, we will be in negative Trump territory.There is a long-term bullish trend here, so there are still plenty of reasons to expect the price to turn bullish again.The price is now approaching a critical technical area just below the big round number at 20,000 – there is a confluence here of an obvious horizontal area of support and the lower trend line of the linear regression channel, which I have drawn to cover the recent bullish leg of the price action. If the price continues to fall and gets established below 19,800, it might quickly fall considerably.I do not see the NASDAQ 100 Index as a buy for now, especially below 19,800. Bottom LineI see the best trading opportunities this week as
Long of Bitcoin in USD terms.
Short of the EUR/USD currency pair.
Ready to trade our weekly Forex analysis ? Check out our list of the best Forex brokers worth checking out.
MENAFN17112024000131011023ID1108894781
November 17, 2024 – Written by Frank Davies
STORY LINK Pound US Dollar (GBP/USD) Exchange Rate Slides as Republicans Gain Control of Congress
The Pound to US Dollar (GBP/USD) exchange rate dropped to a new multi-month low on Thursday as investor demand for the USD remained strong.
At the time of writing, GBP/USD was trading around $1.2644, down approximately 0.5% from Thursday’s opening levels.
The US Dollar (USD) climbed on Thursday, continuing its upward trend following Donald Trump’s election win.
The recent boost in USD came as Republicans secured a majority in the House of Representatives, granting the party control of all branches of the US government.
With Trump now poised to advance his economic policies more easily, USD exchange rates rose as investors anticipate his tax cuts and tariffs may fuel inflation, potentially leading the Federal Reserve to keep US interest rates elevated for longer.
The Pound (GBP) struggled to gain traction against the US Dollar on Thursday, as GBP investors remained cautious ahead of a speech from Bank of England (BoE) Governor Andrew Bailey.
Bailey’s comments will follow recent remarks by BoE official Catherine Mann, who discussed the risks of rising inflation in the UK and suggested rates might need to remain high.

If Bailey echoes this sentiment, it could dampen market expectations of a BoE rate cut in December and help the GBP/USD exchange rate recover from its current lows.
Looking toward the end of the week, the Pound to US Dollar (GBP/USD) exchange rate may face further headwinds with the release of the UK’s latest GDP figures.
Preliminary data for the third quarter is expected to show that UK economic growth slowed from 0.5% to just 0.2%, raising concerns about the country’s economic outlook and likely weighing on Sterling.
Meanwhile, the release of US retail sales data could limit the US Dollar’s recent gains if the figures indicate a slowdown in consumer spending last month.
International Money Transfer? Ask our resident FX expert a money transfer question or try John’s new, free, no-obligation personal service! ,where he helps every step of the way,
ensuring you get the best exchange rates on your currency requirements.
TAGS: Pound Dollar Forecasts
The gold price continued its post-US election correction this week, sinking to nearly US$2,540 per ounce.
Although it recovered to end the period at around US$2,560, the yellow metal hasn’t been at these levels for about two months. Market watchers see US dollar strength and higher bond yields weighing on its performance.
The US Dollar Index has moved higher since Donald Trump’s victory in the American election, supported by expectations that the president-elect will follow through on enacting tariffs and tightening immigration — these are policies that could boost inflation and in doing so potentially slow the US Federal Reserve’s interest rate cuts.
While gold tends to fare better when rates are low, the opposite is true for the dollar.
Yields for the 10 Year Treasury have moved higher since voting day too, although they’ve seen some bumpiness.
It’s also worth noting that the latest US consumer price index (CPI) data came out on Wednesday (November 13). CPI rose 0.2 percent month-on-month and was up 2.6 percent year-on-year. Meanwhile, core CPI, which excludes the more volatile food and energy categories, was up 0.3 percent from September and 3.3 percent from a year ago.
The numbers were in line with forecasts across the board, bolstering expectations that the Fed will reduce rates by another 25 basis points at its December meeting. However, those expectations took a hit on Thursday (November 14), when Fed Chair Jerome Powell said that the economy isn’t sending signals that rates need to come down quickly.
“The economy is not sending any signals that we need to be in a hurry to lower rates. The strength we are currently seeing in the economy gives us the ability to approach our decisions carefully,” he commented.
What’s next for the gold price in this environment? The Investing News Network will be attending the New Orleans Investment Conference next week, and we’ll be asking experts like Rick Rule, David Morgan, Lobo Tiggre and more for their thoughts. Please send an email to cmcleod@investingnews.com to let us know what questions you’d like answered.
Bullet briefing — Citigroup cuts copper forecast, Friedland plans iron ore IPO
Citigroup (NYSE:C) is cutting its short-term copper price forecast by 11 percent in the wake of the US election.
“Former President Donald Trump’s election for a second term marks a clear turning point in global trade tariff policy. And China’s lack of easing to date has surprised us,” the firm said this week in a note.
Citigroup is expecting prices to drop to US$8,500 per metric ton over the next three months, down from its previous call of US$9,500. Citigroup also sees China’s weaker-than-expected stimulus measures weighing on the metal.
Although the Asian nation recently announced a debt relief package worth US$1.4 trillion, members of the copper industry don’t see it having much impact on demand.
“The latest stimulus is to refinance local government debts, so that’s not going to boost physical (copper) demand much” — Ni Hongyan, Eagle Metal International
Robert Friedland reportedly plans to list iron ore company Ivanhoe Atlantic on the ASX before June 2025.
Formerly known as High Powered Exploration, Ivanhoe Atlantic’s main asset is the Nimba iron ore project in Guinea. However, funds raised by the company will also be used to make acquisitions in the critical minerals sector.
Friedland is currently best known for Ivanhoe Mines (TSX:IVN,OTCQX:IVPAF), whose operations include the Kamoa-Kakula copper complex in the Democratic Republic of Congo, but he is also involved in various other companies and projects.
Want more YouTube content? Check out our expert market commentary playlist, which features interviews with key figures in the resource space. If there’s someone you’d like to see us interview, please send an email to cmcleod@investingnews.com.
And don’t forget to follow us @INN_Resource for real-time updates!
Securities Disclosure: I, Charlotte McLeod, hold no direct investment interest in any company mentioned in this article.
Editorial Disclosure: The Investing News Network does not guarantee the accuracy or thoroughness of the information reported in the interviews it conducts. The opinions expressed in these interviews do not reflect the opinions of the Investing News Network and do not constitute investment advice. All readers are encouraged to perform their own due diligence.
From Your Site Articles
Related Articles Around the Web
The GBP/USD weekly forecast is bleak as the pound collapses against a strong dollar amid the Trump trade weaker UK GDP.
The GBP/USD pair had a very bearish week as the Trump trade boosted the dollar and weighed on the pound. Despite various economic reports from the UK and the US, markets were focused on the looming shift in policies in the US.
–Are you interested in learning more about Canadian forex brokers? Check our detailed guide-
Trump’s policies will likely boost economic growth and inflation. Therefore, the Fed might be forced to keep rates at a restrictive level longer. High interest rates boost Treasury yields and the greenback.
Meanwhile, US inflation data aligned with expectations, leaving rate-cut bets mostly unchanged. However, Powell’s remarks that there was no hurry to cut rates slashed bets to below 50%. On the other hand, the UK economy unexpectedly contracted, further weighing on the pound.
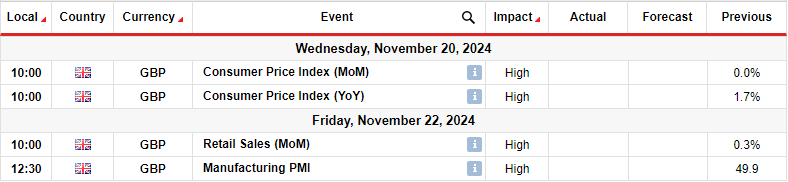
Next week, market participants will focus on key economic reports from the UK, including consumer inflation, retail sales, and business activity. Inflation in the UK recently dropped below the Bank of England’s target to hit 1.7%. The decline was initially a big motivator for the central bank to lower borrowing costs.
However, policymakers remained cautious, noting that the economy might perform better than expected in the medium term. Therefore, inflation might rebound. A better-than-expected CPI reading will lower rate-cut expectations and boost the pound. Meanwhile, a downbeat report will weigh on the currency.
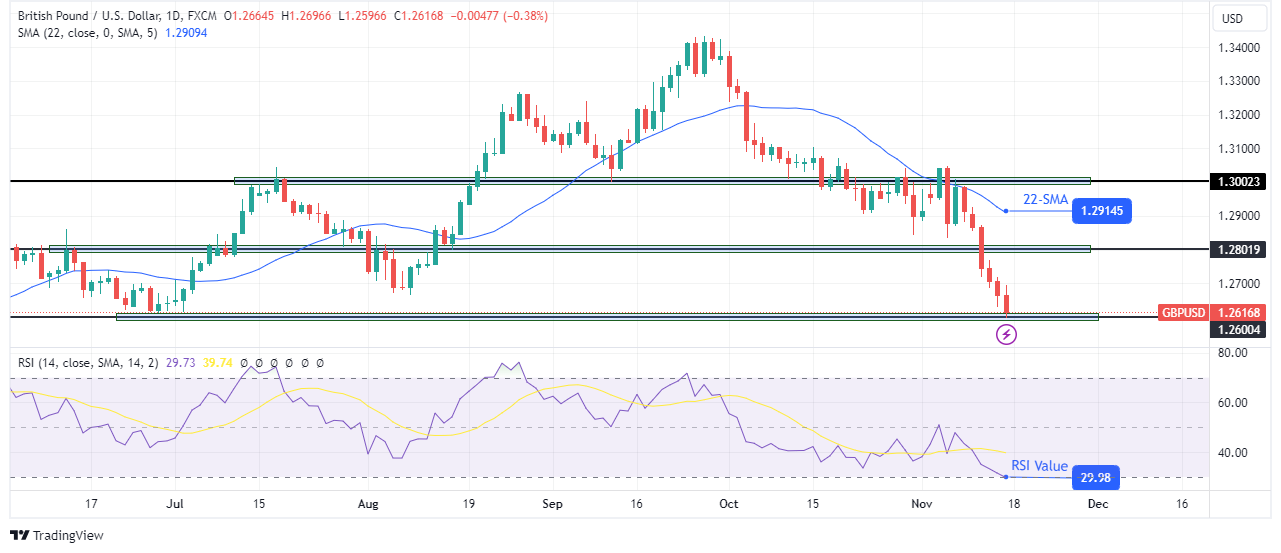
On the technical side, the GBP/USD price has plunged to the 1.2600 support level. The new swing long has put the price well below the 22-SMA, showing bears are in the lead. At the same time, the RSI has reached the oversold region, suggesting solid bearish momentum.
–Are you interested in learning more about high leveraged brokers? Check our detailed guide-
This week, the GBP/USD price only made bearish candles, showing a strong bias. The decline started after the price broke below and retested the 1.3002 key level. At the same time, the price was retesting the 22-SMA as resistance. It bounced lower, breaching the 1.2801 support before pausing at the 1.2600 level. However, after such a steep decline, the price might need a pause next week before it continues lower.
Looking to trade forex now? Invest at eToro!
68% of retail investor accounts lose money when trading CFDs with this provider. You should consider whether you can afford to take the high risk of losing your money
Crude oil futures edged higher on Thursday, though the U.S. benchmark closed below $69 per barrel, as a large surplus is expected in 2025.
Global crude supplies are expected to outstrip demand by more than 1 million barrels per day next year led by robust growth in the U.S., according to the International Energy Agency’s monthly market report.
Here are Thursday’s closing energy prices:
UBS slashed its price forecast for global benchmark Brent to $80 per barrel from $87 previously on weakening demand in China, the world’s largest crude importer.
OPEC on Tuesday cut its demand growth forecast for the fourth month in a row earlier this week.
Oil prices have fallen more than 4% since Donald Trump won the U.S. presidential election as the dollar has surged. A stronger greenback can depress oil demand among buyers that hold other currencies.
The Pound Sterling (GBP) booked the seventh straight weekly loss against the US Dollar (USD), with the GBP/USD pair falling as low as 1.2630 during the week.
The USD rode the Trump trades optimism wave higher following US President-elect Donald Trump’s victory, clinching the highest level in a year against its major currency rivals. Markets build on the narrative that Trump’s tax cuts and trade tariff policies will likely rekindle inflationary pressures, calling for higher interest rates and eventually supporting the Greenback, US stocks and US Treasury bond yields.
The buying interest around the USD remained unabated, slamming the GBP/USD pair to the lowest level since July at 1.2630. The Greenback received an added boost from fading expectations that the US Federal Reserve (Fed) will continue its easing trajectory after the US election outcome.
Fed Chair Jerome Powell echoed his colleagues’ caution on inflation and that the Fed could remain patient with its policy approach. Powell said in his speech on Thursday that there was no need to rush rate cuts with the economy still growing and the job market solid, despite inflation still above the 2.0% target, tempering expectations for a rate cut next month, per Reuters.
The sticky US Consumer Price Index (CPI) and hot Producer Price Index (PPI) data for October also backed the hawkish shift in the Fed’s policy stance. US CPI rose 2.6% annually in October, coming in higher than the 2.4% growth in September while meeting the forecast. The annual core CPI inflation steadied at 3.3% in the same period vs. 3.3% expected.
Meanwhile, the annual headline factory-gate inflation rose to 2.4% in October after increasing 1.9% in September, indicating that disinflation is losing momentum. Markets now price in a less than 60% chance of a 25 basis points (Fed) rate reduction next month, the CME Group’s Fed Watch Tool showed, down from 82.5% in the prior session.
The bullish undertone in the Greenback hindered the Pound Sterling from capitalizing on prudent remarks from the Bank of England (BoE) policymakers concerning the bank’s path forward on interest rates. BoE Chief Economist, Huw Pill, said that the latest “labor data shows pay growth still at high levels,” adding that “further rate cuts is likely to be a gradual process.”
Meanwhile, his colleague Catherine Mann, the hawkish dissenter, noted that “central banks must ensure these inflation pressures do not get embedded. I do not think high interest rates are bad for high productivity.”
Heading into the weekend, Pound Sterling sellers took a breather as they awaited the US Retail Sales report for October for further incentives in trading the GBP/USD pair.
The US Dollar gained some pips following upbeat data, as Retail Sales rose by 0.4% MoM in October, better than the 0.3% anticipated by market players. Additionally, the September reading was upwardly revised from 0.4% to 0.8%.
After a busy second half of the last week, the early part of this week seems to be quiet data-wise from both sides of the Atlantic until the release of the UK CPI inflation report on Wednesday.
In the meantime, the appearances by the BoE and Fed policymakers and mid-tier US housing data will keep traders entertained.
Wednesday’s UK CPI data will hold the key to influencing the market expectations of future rate cuts by the BoE as policymakers assess the impact of the Autumn Budget on the economy and inflation prospects.
BoE official Dave Ramsden is due to speak about monetary policy at the University of Leeds later on Wednesday.
Central bankers’ speeches will dominate on Thursday amid the weekly US Jobless Claims data release.
S&P Global preliminary Purchasing Managers’ Index (PMI) data from the UK and the US will wrap a relatively data-quiet week.
The daily technical setup for the GBP/USD pair suggests that sellers will continue jumping on any recovery attempts as the 14-day Relative Strength Index (RSI) remains in negative territory.
With the previous week’s dual Bear Crosses in play, the downside risks remain intact for the pair.
The Pound Sterling needs a weekly candlestick closing below the August 8 low of 1.2665 to stretch the downside momentum.
If the selling pressure intensifies, sellers could attack the 1.2550 psychological barrier. On a failure to defend that level, the May 9 low of 1.2446 will be challenged.
However, the pair could see a brief upside correction before the next leg down kicks in.
Recapturing the 200-day Simple Moving Average (SMA) at 1.2819 is critical to initiating any meaningful recovery in the near term.
The next topside barrier aligns at the 21-day SMA at 1.2908.
(MENAFN– Daily Forex)
The US dollar initially rallied a bit during the course of the trading session on Thursday as we reached the 156 level and peaked above there but have since pulled back ever so slightly.
At this point, I think this remains a buy on the dip market.
This has been the pay for some time, and I think it will continue to be going into the future at this point. The interest rate differential has been a great way to pad your account for some time.
So, you need to keep that in mind, but we are a little stretched. So, it’s not a huge surprise to see a little bit of give back in the middle of the day. Regardless, there’s almost no way you can short this pair because the interest rate differential alone will destroy your account. The interest rates in. The United States continue to climb. And until that changes, there’s really no hope for the Japanese in as the Bank of Japan has no recourse for tightening monetary policy.Top Forex Brokers1 Get Started 74% of retail CFD accounts lose money The Debt of Japan is the Real Issue Here Quite frankly, it’s obvious to all involved that the Japanese economy is so far in debt, there’s no way it can hang on to that debt and pay a reasonable interest rate. So, with that being said, the Bank of Japan can’t get too aggressive with tight monetary policy. short term pullbacks, I think will continue to attract a lot of attention. And therefore, I like the idea of buying dips. We’ve recently had the so-called golden cross. That’s when the 50 day EMA breaks above the 200 day EMA. So, some longer term traders probably got involved as well. Nonetheless, I do think we’re going to go looking to the 160 yen level eventually. It probably will take some time to get there, but I do think that is our destination.Ready to trade our
daily forex forecast ? Here are
Japan’s Best Forex Brokers
to choose from.
MENAFN15112024000131011023ID1108892058

Legal Disclaimer:
MENAFN provides the information “as is” without warranty of any kind. We do not accept any responsibility or liability for the accuracy, content, images, videos, licenses, completeness, legality, or reliability of the information contained in this article. If you have any complaints or copyright issues related to this article, kindly contact the provider above.
Silver’s price fell over 0.70% beneath $30.30 after robust US Retail Sales data suggested the Federal Reserve could gradually ease policy. At the time of writing, the XAG/USD trades at $30.21 after hitting a daily peak of $30.81.
Silver price remains subdued at around the 100-day Simple Moving Average (SMA) at $30.34. Nevertheless, the mid-term bias is tilted to the downside, and once bears push prices below August’s 26 high turned support at $30.18, they will test the psychological $30.00 mark. A breach of the latter will expose the 200-day SMA at $28.63, followed by the September 6 swing low of $27.69.
If Silver moves back above $31.00, this could pave the way for challenging the 50-day SMA at $31.51. Once surpassed, XAG/USD’s next resistance would be $32.00.
Oscillators like the Relative Strength Index (RSI) hint that further XAG/USD’s downside is seen, as RSI remains shy of being oversold.
Silver is a precious metal highly traded among investors. It has been historically used as a store of value and a medium of exchange. Although less popular than Gold, traders may turn to Silver to diversify their investment portfolio, for its intrinsic value or as a potential hedge during high-inflation periods. Investors can buy physical Silver, in coins or in bars, or trade it through vehicles such as Exchange Traded Funds, which track its price on international markets.
Silver prices can move due to a wide range of factors. Geopolitical instability or fears of a deep recession can make Silver price escalate due to its safe-haven status, although to a lesser extent than Gold’s. As a yieldless asset, Silver tends to rise with lower interest rates. Its moves also depend on how the US Dollar (USD) behaves as the asset is priced in dollars (XAG/USD). A strong Dollar tends to keep the price of Silver at bay, whereas a weaker Dollar is likely to propel prices up. Other factors such as investment demand, mining supply – Silver is much more abundant than Gold – and recycling rates can also affect prices.
Silver is widely used in industry, particularly in sectors such as electronics or solar energy, as it has one of the highest electric conductivity of all metals – more than Copper and Gold. A surge in demand can increase prices, while a decline tends to lower them. Dynamics in the US, Chinese and Indian economies can also contribute to price swings: for the US and particularly China, their big industrial sectors use Silver in various processes; in India, consumers’ demand for the precious metal for jewellery also plays a key role in setting prices.
Silver prices tend to follow Gold’s moves. When Gold prices rise, Silver typically follows suit, as their status as safe-haven assets is similar. The Gold/Silver ratio, which shows the number of ounces of Silver needed to equal the value of one ounce of Gold, may help to determine the relative valuation between both metals. Some investors may consider a high ratio as an indicator that Silver is undervalued, or Gold is overvalued. On the contrary, a low ratio might suggest that Gold is undervalued relative to Silver.
Today’s price action shows a successful retest of support around the 20-Day MA, which followed the first successful test on November 4. It potentially clears the way for a possible new breakout attempt about the 3.02 high (B). The last attempt failed attempt occurred on Wednesday. It remains to be seen whether that high retains resistance or whether a sustainable bullish breakout triggers. A daily close above 3.02 would confirm a breakout and put natural gas in a position to test higher potential targets.
The first target would be the swing high from August at 3.16. But that level should be easily surpassed given the potential for a strong market response. There are two patterns that would be triggered. A sustained rally above 3.02 would trigger a breakout of a large symmetrical triangle pattern, as well as a continuation of the rising trend that began from the August swing low.
If the 3.16 high can be exceeded, the completion of a small rising ABCD pattern (purple) point to 3.22. But that is a relatively easy target to hit and possibly surpass. A more significant target range looks to be from 3.35 to 3.45, which is where there is a confluence of targets from Fibonacci projections and price structure.
Regardless of the potential for higher targets to be reached as indicated by the analysis, how the price of natural gas behaves following a breakout should provide clues as to the strength or weakness of demand. There is always the possibility of a failed breakout. In general, the breakout of a trendline may not be as reliable as a break above a horizontal price level. This is why a break above a prior swing high in natural gas, especially if it makes up part of the triangle structure can be an important confirmation of strength.
For a look at all of today’s economic events, check out our economic calendar.