The main category of Forex News.
You can use the search box below to find what you need.
[wd_asp id=1]
The main category of Forex News.
You can use the search box below to find what you need.
[wd_asp id=1]
Today’s price action shows a successful retest of support around the 20-Day MA, which followed the first successful test on November 4. It potentially clears the way for a possible new breakout attempt about the 3.02 high (B). The last attempt failed attempt occurred on Wednesday. It remains to be seen whether that high retains resistance or whether a sustainable bullish breakout triggers. A daily close above 3.02 would confirm a breakout and put natural gas in a position to test higher potential targets.
The first target would be the swing high from August at 3.16. But that level should be easily surpassed given the potential for a strong market response. There are two patterns that would be triggered. A sustained rally above 3.02 would trigger a breakout of a large symmetrical triangle pattern, as well as a continuation of the rising trend that began from the August swing low.
If the 3.16 high can be exceeded, the completion of a small rising ABCD pattern (purple) point to 3.22. But that is a relatively easy target to hit and possibly surpass. A more significant target range looks to be from 3.35 to 3.45, which is where there is a confluence of targets from Fibonacci projections and price structure.
Regardless of the potential for higher targets to be reached as indicated by the analysis, how the price of natural gas behaves following a breakout should provide clues as to the strength or weakness of demand. There is always the possibility of a failed breakout. In general, the breakout of a trendline may not be as reliable as a break above a horizontal price level. This is why a break above a prior swing high in natural gas, especially if it makes up part of the triangle structure can be an important confirmation of strength.
For a look at all of today’s economic events, check out our economic calendar.
The EUR/USD pair has recently been on a bearish trajectory, with multiple economic and geopolitical factors pointing to continued downward pressure over the coming months. As inflation concerns ease, central banks have made dovish rate decisions and softening U.S. jobs data influences the bearish sentiment for this pair. Forex traders are now closely watching for signals on how to capitalize on the pair’s declining exchange rate.
This EUR/USD forecast summarizes Benzinga’s technical and fundamental analysis for the currency pair, highlighting key support and resistance levels and potential influences from upcoming economic indicators and events. With a generally bearish outlook and more losses expected for EUR/USD, understanding these dynamics can present strategic opportunities for forex traders following this trend. Read on for our in-depth market forecast, providing actionable insights into trading the EUR/USD currency pair.
Disclosure: CFDs are complex instruments and come with a high risk of losing money rapidly due to leverage. 74% to 76% of retail investor accounts lose money when trading CFDs with this provider. You should consider whether you understand how CFDs work, and whether you can afford to take the high risk of losing your money.
The products and services available to you at FOREX.com will depend on your location and on which of its regulated entities holds your account
The EUR/USD currency pair has experienced a notable decline recently. Some of the key factors influencing the forex market’s bearish move in this currency pair include:
These factors contributed to recent downward pressure on the EUR/USD pair, with the exchange rate hitting fresh lows below the 1.0600 psychological support point.
The EUR/USD pair is in a bearish trend, with key support levels at 1.0595/1.0602, 1.0484, 1.0449 and 1.0294. Resistance levels are noted at 1.0683/1.0685, 1.0762/1.0778 and 1.0936/1.0937.
Furthermore, the 14-day Relative Strength Index (RSI) is approaching oversold levels at 32.60, while the exchange rate lies significantly below its 200-day Moving Average (MA), now sitting at 1.0867 with a negative slope.
Overall, our technical analysis suggests that the EUR/USD may be nearing a potential short-term reversal to correct its oversold condition, but the overall medium-term trend remains bearish.
Let’s breakdown the fundamental analysis of EUR/USD by examining recent economic indicators, political events, trade relations and other global factors to yield an overall fundamental outlook:
Economic Indicators
Eurozone: The Eurozone’s GDP growth has been relatively weak. The European Central Bank (ECB) projects that economic growth will remain subdued in the near term but should improve with rising household incomes, a resilient labor market and stronger foreign demand.
United States: The U.S. economy expanded at an annual rate of 2.8% in the third quarter of 2024, down from 3.0% in the second quarter. The GDP growth is expected to be around 2.7% for the full year of 2024.
Eurozone: Inflation in the eurozone has been falling. The ECB projects inflation to increase slightly in the fourth quarter of 2024 but returns to target by the end of 2025 as cost pressures ease. The EU inflation rate was 2.10% in September 2024, down from 2.40% in August 2024 and it is expected to fall further as the year progresses.
United States: The annual inflation rate for the 12 months ending September 2024 was 2.4%, down from 2.5% in August 2024. The Federal Reserve forecasts core PCE inflation to drop to 2.4% in 2024 and 2.2% in 2025.
Eurozone: The ECB has been cautious with interest rates, recently cutting the Deposit Facility Rate to 3.25% and the Main Refinancing Operations Rate to 3.4%.
United States: The Federal Reserve Bank in the U.S. has also been cutting its benchmark interest rates, with the current Fed Funds rate at 4.75% after a recent 25 basis point cut in November.
The recent U.S. election had a significant negative impact on the EUR/USD pair, as the USD strengthened in its wake. The forex market is currently assessing the impact of Donald Trump’s return as President positively. Trump’s protectionist stance on trade and his promise of potential tax cuts could lead to higher inflation and interest rates, thereby boosting the USD in the long term.
Trade relations between the U.S. and its major trading partners, including the eurozone, have been tense. Newly elected U.S. President Donald Trump’s harsh policies on tariffs and trade could lead to higher inflation in the U.S. and negatively impact eurozone exports, thereby strengthening the USD versus the EUR over time.
Global factors such as geopolitical tensions, supply chain disruptions and economic policies in other major economies also play a role in the dynamics of the EUR/USD exchange rate. The ongoing geopolitical tensions in the Middle East and the US-China trade dispute, which seems likely to worsen given Trump’s victory, have increased risk aversion, thereby boosting the USD as a safe-haven currency versus the EUR.
Economic indicators, political events, trade relations and global factors influence the exchange rate of the EUR/USD currency pair. The recent U.S. election and the Federal Reserve’s dovish interest rate decisions are the most significant current drivers of the currency pair’s movements. The Eurozone’s economic recovery and inflation trends will also play a key role in the future direction of EUR/USD, which seems likely to decline over the coming months.
Overall, the EUR/USD pair is currently in a downtrend, which was strongly influenced by the 2024 U.S. election results and the Federal Reserve’s decision to cut its benchmark Fed Funds rate by 25 bps in November. Going forward, the Eurozone’s ongoing economic recovery and inflation trends should be monitored closely since those factors can play a major role in the future direction of EUR/USD.
Given the current bearish outlook for the EUR/USD pair following the 2024 U.S. election, here’s a short and long-term forecast for the currency pair:
The following factors could potentially affect upcoming movements in the EUR/USD exchange rate:
Possible Bearish Factors
Possible Bullish Factors
You can use Benzinga’s forecast bearish movements in the EUR/USD exchange rate by signing up with a trusted online forex broker like FOREX.com. As an industry leader, FOREX.com provides access to advanced trading tools, competitive dealing spreads and fast, reliable trade executions to help you capitalize on currency market trends and volatility. The broker’s real-time data, powerful charting options and useful risk management features empower you to implement your currency market views as you learn to trade forex and profit from current trends.
Important DisclaimersThe content provided on the website includes general news and publications, our personal analysis and opinions, and contents provided by third parties, which are intended for educational and research purposes only. It does not constitute, and should not be read as, any recommendation or advice to take any action whatsoever, including to make any investment or buy any product. When making any financial decision, you should perform your own due diligence checks, apply your own discretion and consult your competent advisors. The content of the website is not personally directed to you, and we does not take into account your financial situation or needs.The information contained in this website is not necessarily provided in real-time nor is it necessarily accurate. Prices provided herein may be provided by market makers and not by exchanges.Any trading or other financial decision you make shall be at your full responsibility, and you must not rely on any information provided through the website. FX Empire does not provide any warranty regarding any of the information contained in the website, and shall bear no responsibility for any trading losses you might incur as a result of using any information contained in the website.The website may include advertisements and other promotional contents, and FX Empire may receive compensation from third parties in connection with the content. FX Empire does not endorse any third party or recommends using any third party’s services, and does not assume responsibility for your use of any such third party’s website or services.FX Empire and its employees, officers, subsidiaries and associates, are not liable nor shall they be held liable for any loss or damage resulting from your use of the website or reliance on the information provided on this website.Risk DisclaimersThis website includes information about cryptocurrencies, contracts for difference (CFDs) and other financial instruments, and about brokers, exchanges and other entities trading in such instruments. Both cryptocurrencies and CFDs are complex instruments and come with a high risk of losing money. You should carefully consider whether you understand how these instruments work and whether you can afford to take the high risk of losing your money.FX Empire encourages you to perform your own research before making any investment decision, and to avoid investing in any financial instrument which you do not fully understand how it works and what are the risks involved.
The table below shows the percentage change of British Pound (GBP) against listed major currencies today. British Pound was the strongest against the Canadian Dollar.
| USD | EUR | GBP | JPY | CAD | AUD | NZD | CHF | |
|---|---|---|---|---|---|---|---|---|
| USD | -0.25% | 0.16% | -0.98% | 0.11% | -0.22% | -0.35% | -0.35% | |
| EUR | 0.25% | 0.40% | -0.75% | 0.36% | 0.03% | -0.10% | -0.10% | |
| GBP | -0.16% | -0.40% | -1.15% | -0.03% | -0.37% | -0.50% | -0.50% | |
| JPY | 0.98% | 0.75% | 1.15% | 1.10% | 0.75% | 0.61% | 0.62% | |
| CAD | -0.11% | -0.36% | 0.03% | -1.10% | -0.35% | -0.47% | -0.47% | |
| AUD | 0.22% | -0.03% | 0.37% | -0.75% | 0.35% | -0.14% | -0.15% | |
| NZD | 0.35% | 0.10% | 0.50% | -0.61% | 0.47% | 0.14% | -0.01% | |
| CHF | 0.35% | 0.10% | 0.50% | -0.62% | 0.47% | 0.15% | 0.00% |
The heat map shows percentage changes of major currencies against each other. The base currency is picked from the left column, while the quote currency is picked from the top row. For example, if you pick the British Pound from the left column and move along the horizontal line to the US Dollar, the percentage change displayed in the box will represent GBP (base)/USD (quote).
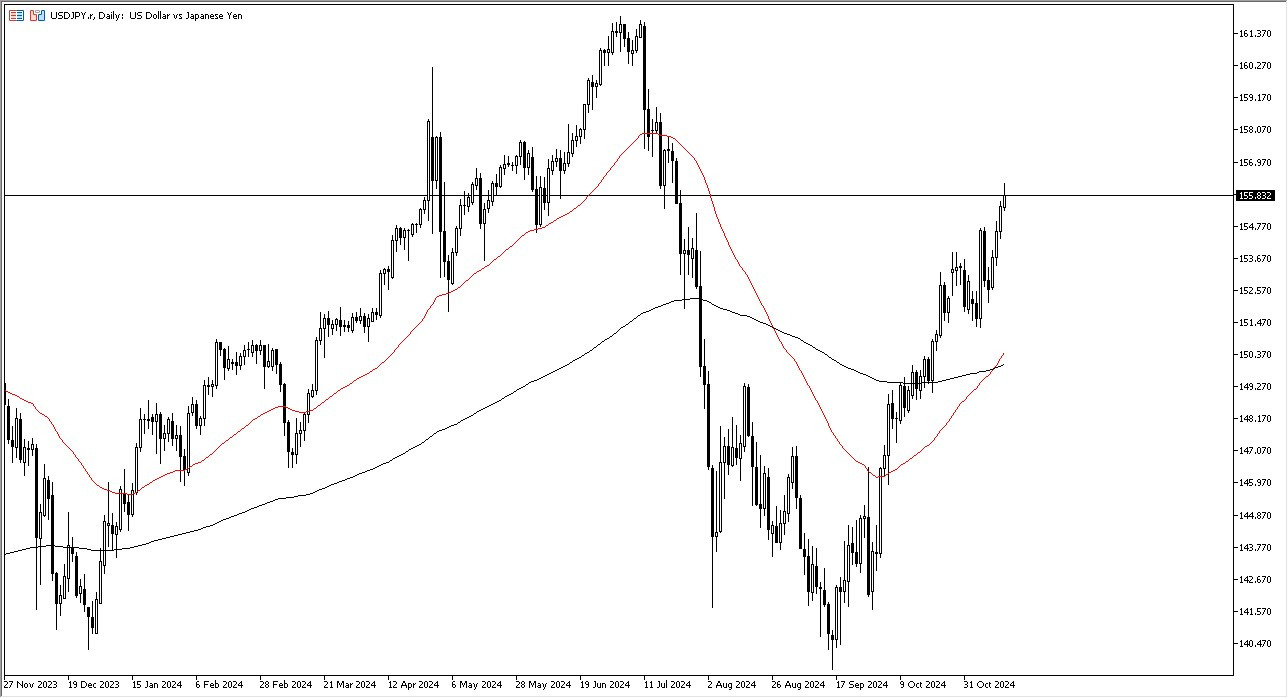
So, you need to keep that in mind, but we are a little stretched. So, it’s not a huge surprise to see a little bit of give back in the middle of the day. Regardless, there’s almost no way you can short this pair because the interest rate differential alone will destroy your account. The interest rates in. The United States continue to climb. And until that changes, there’s really no hope for the Japanese in as the Bank of Japan has no recourse for tightening monetary policy.

Quite frankly, it’s obvious to all involved that the Japanese economy is so far in debt, there’s no way it can hang on to that debt and pay a reasonable interest rate. So, with that being said, the Bank of Japan can’t get too aggressive with tight monetary policy. short term pullbacks, I think will continue to attract a lot of attention. And therefore, I like the idea of buying dips. We’ve recently had the so-called golden cross. That’s when the 50 day EMA breaks above the 200 day EMA. So, some longer term traders probably got involved as well. Nonetheless, I do think we’re going to go looking to the 160 yen level eventually. It probably will take some time to get there, but I do think that is our destination.
Ready to trade our daily forex forecast? Here are Japan’s Best Forex Brokers to choose from.
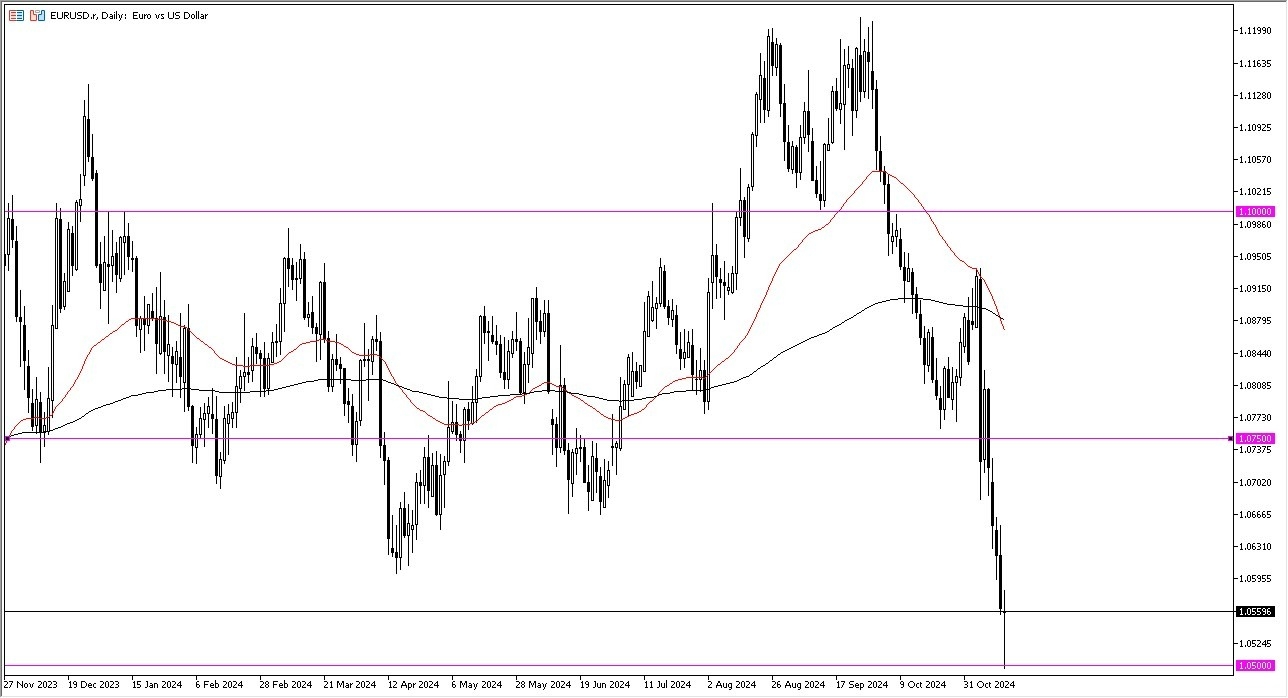
Regardless, it’s obvious that the euro is oversold against the greenback, and I can make an argument that the greenback is overbought against almost everything else as well. With that being said, the market is likely to continue to see a lot of US dollar strengthen over the longer term, but in the short term I do think that little bit of a bounce makes quite a bit of sense. In fact, we could bounce all the way to the 1.0750 level without changing much in this pair.
Interest rates in America continue to skyrocket, and that of course makes the US dollar much stronger. Furthermore, there are a lot of questions to be asked about the US economy, but with a new pro-business administration taking the reins of power in a clean sweep of not only the White House, but also the House of Representatives, Senate, and still holding the Supreme Court, it’s very likely that we will see a potential revival of the 1980s, which had seen the American economy take off quite drastically.
All things being equal, most things American have performed quite well over the last several weeks, culminating with a bit of euphoria after the election. Nonetheless, nothing goes in the same direction forever and I think that’s what we are seeing here. Would I be bullish of the euro overall against the US dollar? No, not at all. However, I do think that we had gotten so far ahead of ourselves that a bounce was almost necessary.
Ready to start trading the EUR/USD daily analysis? Get our top rated Forex brokers list here.
Silver price (XAG/USD) trades in negative territory around $30.35 on Friday during the early European session. The white metal remains vulnerable amid the stronger US Dollar (USD). Traders await the release of the US October Retail Sales report on Friday for fresh impetus. The Fedspeak will be closely monitored as it might offer some hints about the US interest rate outlook.
Donald Trump’s victory in last week’s US presidential election sparked expectations of potentially inflationary tariffs and other measures by his incoming administration, boosting the Greenback. Meanwhile, the US Dollar Index (DXY), a measure of the value of the USD against a basket of six currencies, currently trades near 106.80 after hitting a fresh year-to-date high near 107.05 in the previous session. The 10-year US Treasury bond hit the highest since start of July at 4.48%. The renewed USD demand could undermine the USD-denominated Silver as it makes the white metal more expensive in other currencies, dampening demand.
China’s National People’s Congress (NPC) meeting last week failed to deliver the immediate fiscal stimulus that investors were expecting. The concerns about sluggish demand could weigh on the Silver price as China is the world’s major importer of silver.
On the other hand, record-high industrial demand for silver might support the white metal in the near term. According to the Silver Institute and consultancy Metals Focus, demand for silver across industrial applications is expected to increase 7% YoY in 2024, reaching 700 million ounces (Moz). Additionally, analysts expect the global silver market to show a physical deficit of around 182 million ounces in 2024, marking the fourth consecutive year of shortfall.
Silver is a precious metal highly traded among investors. It has been historically used as a store of value and a medium of exchange. Although less popular than Gold, traders may turn to Silver to diversify their investment portfolio, for its intrinsic value or as a potential hedge during high-inflation periods. Investors can buy physical Silver, in coins or in bars, or trade it through vehicles such as Exchange Traded Funds, which track its price on international markets.
Silver prices can move due to a wide range of factors. Geopolitical instability or fears of a deep recession can make Silver price escalate due to its safe-haven status, although to a lesser extent than Gold’s. As a yieldless asset, Silver tends to rise with lower interest rates. Its moves also depend on how the US Dollar (USD) behaves as the asset is priced in dollars (XAG/USD). A strong Dollar tends to keep the price of Silver at bay, whereas a weaker Dollar is likely to propel prices up. Other factors such as investment demand, mining supply – Silver is much more abundant than Gold – and recycling rates can also affect prices.
Silver is widely used in industry, particularly in sectors such as electronics or solar energy, as it has one of the highest electric conductivity of all metals – more than Copper and Gold. A surge in demand can increase prices, while a decline tends to lower them. Dynamics in the US, Chinese and Indian economies can also contribute to price swings: for the US and particularly China, their big industrial sectors use Silver in various processes; in India, consumers’ demand for the precious metal for jewellery also plays a key role in setting prices.
Silver prices tend to follow Gold’s moves. When Gold prices rise, Silver typically follows suit, as their status as safe-haven assets is similar. The Gold/Silver ratio, which shows the number of ounces of Silver needed to equal the value of one ounce of Gold, may help to determine the relative valuation between both metals. Some investors may consider a high ratio as an indicator that Silver is undervalued, or Gold is overvalued. On the contrary, a low ratio might suggest that Gold is undervalued relative to Silver.
Gold price is looking to build on the previous rebound early Friday in search of a fresh impetus amid persistent US Dollar (USD) buying and mixed activity data from China.
Even though China’s Retail Sales data jumped by 4.8% in October, Industrial Production disappointed markets with a 5.3% growth in the same period. The Fixed Asset Investment stayed unchanged at 3.4% in the year through October.
The mixed Chinese data dump amplified economic concerns as markets remain wary over the country’s stimulus efforts to ramp up growth. Asian stocks are a mixed bag so far this Friday, with the sentiment undermined by the decline in Chinese indices.
The uncertainty around the future interest rate cuts by the US Federal Reserve (Fed) also remains a drag on the markets, especially after Fed Chair Jerome Powell said late Thursday that there was no need to rush rate cuts with the economy still growing, the job market solid and inflation still above the 2% target, tempering expectations for a rate cut next month, per Reuters.
The US Dollar saw a fresh leg higher as the short-end US Treasury bond yields rallied hard on Powell’s hawkish shit, sending non-yielding Gold price as low as $2,537. However, bargain hunting crept in and allowed Gold price to recover some ground.
The focus now shifts toward a fresh batch of US economic data releases, including the top-tier Retail Sales report, for a fresh direction impetus. Meanwhile, more speeches from Fed policymakers will also entertain traders as they guage whether the Fed will continue its easing trajectory beyond December.
According to Reuters, “Fed fund futures for next year slumped with December off seven ticks and imply just 71 basis points of rate cuts by end-2025. A rate cut next month is no longer a high-probability event, with just 61% priced in, down from 82.5% in the prior session.”
The hawkish turn in the Fed’s policy stance was also backed by the US Producer Price Index (PPI) data for October, which was released on Thursday. The annual headline PPI increased 2.4% in October after rising 1.9% in September, adding signs of the economy losing disinflationary momentum.
The short-term technical outlook for Gold price remains more or less the same, with any recovery attempts likely to be short-lived as long as the 14-day Relative Strength Index (RSI) stays bearish.
As of writing, the leading indicator rebounds slightly to near 34 after prodding the oversold threshold a day ago.
This RSI movement correlates to the Gold price recovery from the critical support of $2,545, the confluence of the 100-day Simple Moving Average (SMA) and the September 18 low.
Gold buyers need to recapture the $2,580 demand area on a daily closing basis to extend the turnaround above $2,600.
Further up, the November 13 high of $2,619 will test the bearish commitments.
On the flip side, the immediate support is seen at the abovementioned strong support of $2,545.
A sustained break below the last will initiate a fresh downtrend toward the $2,500 threshold, with the next bearish target seen at the September 4 low of $2,472.
Gold has played a key role in human’s history as it has been widely used as a store of value and medium of exchange. Currently, apart from its shine and usage for jewelry, the precious metal is widely seen as a safe-haven asset, meaning that it is considered a good investment during turbulent times. Gold is also widely seen as a hedge against inflation and against depreciating currencies as it doesn’t rely on any specific issuer or government.
Central banks are the biggest Gold holders. In their aim to support their currencies in turbulent times, central banks tend to diversify their reserves and buy Gold to improve the perceived strength of the economy and the currency. High Gold reserves can be a source of trust for a country’s solvency. Central banks added 1,136 tonnes of Gold worth around $70 billion to their reserves in 2022, according to data from the World Gold Council. This is the highest yearly purchase since records began. Central banks from emerging economies such as China, India and Turkey are quickly increasing their Gold reserves.
Gold has an inverse correlation with the US Dollar and US Treasuries, which are both major reserve and safe-haven assets. When the Dollar depreciates, Gold tends to rise, enabling investors and central banks to diversify their assets in turbulent times. Gold is also inversely correlated with risk assets. A rally in the stock market tends to weaken Gold price, while sell-offs in riskier markets tend to favor the precious metal.
The price can move due to a wide range of factors. Geopolitical instability or fears of a deep recession can quickly make Gold price escalate due to its safe-haven status. As a yield-less asset, Gold tends to rise with lower interest rates, while higher cost of money usually weighs down on the yellow metal. Still, most moves depend on how the US Dollar (USD) behaves as the asset is priced in dollars (XAU/USD). A strong Dollar tends to keep the price of Gold controlled, whereas a weaker Dollar is likely to push Gold prices up.
Investing.com — UBS has raised its forecast for the in a note Thursday, expecting significant fluctuations in the exchange rate over the coming year.
The bank now projects the currency pair to reach 155 by December 2024, followed by 152 in March 2025, 150 in June, and 147 in September.
By year-end 2025, UBS targets 145, a revision from its earlier predictions of 147, 143, 140, and 138, respectively.
According to UBS, a near-term surge to 158-160 remains possible, especially if U.S. 10-year yields rise another 30-40 basis points, potentially hitting 4.8%.
“Based on sensitivity analysis over the past three years, a 10bp widening of the US-Japan 10-year yield differential coincides with a one-yen rise in the USDJPY exchange rate,” UBS explained.
If U.S. bond yields indeed spike to 4.8%, the bank says USD/JPY could temporarily reach 160, though they view this level as “unsustainable” and likely to invite Japanese intervention, as observed during similar peaks earlier in 2024.
UBS analysts believe the USD/JPY will face downward pressure in 2025, driven by several factors. A key factor is the anticipated Fed rate-cutting cycle, which UBS expects will lead to lower U.S. yields.
“We think current USDJPY levels are higher than justified by yield differentials,” UBS notes, estimating that the currency pair should trend toward 145-146.
Additionally, trade tensions and a potential Trump-led administration’s focus on a stronger yen may reinforce this trend.
For investors, UBS suggests that any near-term spike toward 160 could be an opportunity to “tactically sell USDJPY.” Over the long term, UBS sees multiple forces supporting a downtrend, with USD/JPY likely to end 2025 at 145.
Given the strong bearish momentum seen in today’s wide range red candle, it looks like natural gas may have a plan to test support again around the 20-Day MA, which is currently at 2.64. It is now lined up with a minor swing low, also at 2.64. Together, they indicate stronger potential support than if they were alone. A little lower is the 50-Day MA at 2.59, followed by a prior swing low at 2.51. Either price area may see signs of support.
Nonetheless, since there is only one more trading day for the week, if downward pressure remains on Friday, there is a chance natural gas will complete the week with a bearish shooting star candlestick pattern. That would provide a potentially bearish weekly setup heading into next week. Once one side of a consolidation pattern is tested as either support or resistance, there is the potential to eventually test the other side of the pattern.
Natural gas found resistance this week around the top boundary line of a large symmetrical triangle pattern. A bullish breakout of the triangle would occur on a sustained rally above the prior sein high at 3.02. But since resistance was seen leading to today’s selloff, there is the potential to test support eventually near the bottom of the pattern. This doesn’t mean it will do so, but it does indicate selling pressure and that could provide a surprise to the downside.
Nevertheless, until there is a decisive decline below the 50-Day MA, the likelihood of finding support that leads to a bullish reversal at or above the 50-Day line is the dominant thesis. A drop sustained decline below the 50-Day line would possibly lead to a retest of support around the 200-Day MA, currently at 2.24.
For a look at all of today’s economic events, check out our economic calendar.