The main category of Forex News.
You can use the search box below to find what you need.
[wd_asp id=1]
The main category of Forex News.
You can use the search box below to find what you need.
[wd_asp id=1]
Given the strong bearish momentum seen in today’s wide range red candle, it looks like natural gas may have a plan to test support again around the 20-Day MA, which is currently at 2.64. It is now lined up with a minor swing low, also at 2.64. Together, they indicate stronger potential support than if they were alone. A little lower is the 50-Day MA at 2.59, followed by a prior swing low at 2.51. Either price area may see signs of support.
Nonetheless, since there is only one more trading day for the week, if downward pressure remains on Friday, there is a chance natural gas will complete the week with a bearish shooting star candlestick pattern. That would provide a potentially bearish weekly setup heading into next week. Once one side of a consolidation pattern is tested as either support or resistance, there is the potential to eventually test the other side of the pattern.
Natural gas found resistance this week around the top boundary line of a large symmetrical triangle pattern. A bullish breakout of the triangle would occur on a sustained rally above the prior sein high at 3.02. But since resistance was seen leading to today’s selloff, there is the potential to test support eventually near the bottom of the pattern. This doesn’t mean it will do so, but it does indicate selling pressure and that could provide a surprise to the downside.
Nevertheless, until there is a decisive decline below the 50-Day MA, the likelihood of finding support that leads to a bullish reversal at or above the 50-Day line is the dominant thesis. A drop sustained decline below the 50-Day line would possibly lead to a retest of support around the 200-Day MA, currently at 2.24.
For a look at all of today’s economic events, check out our economic calendar.
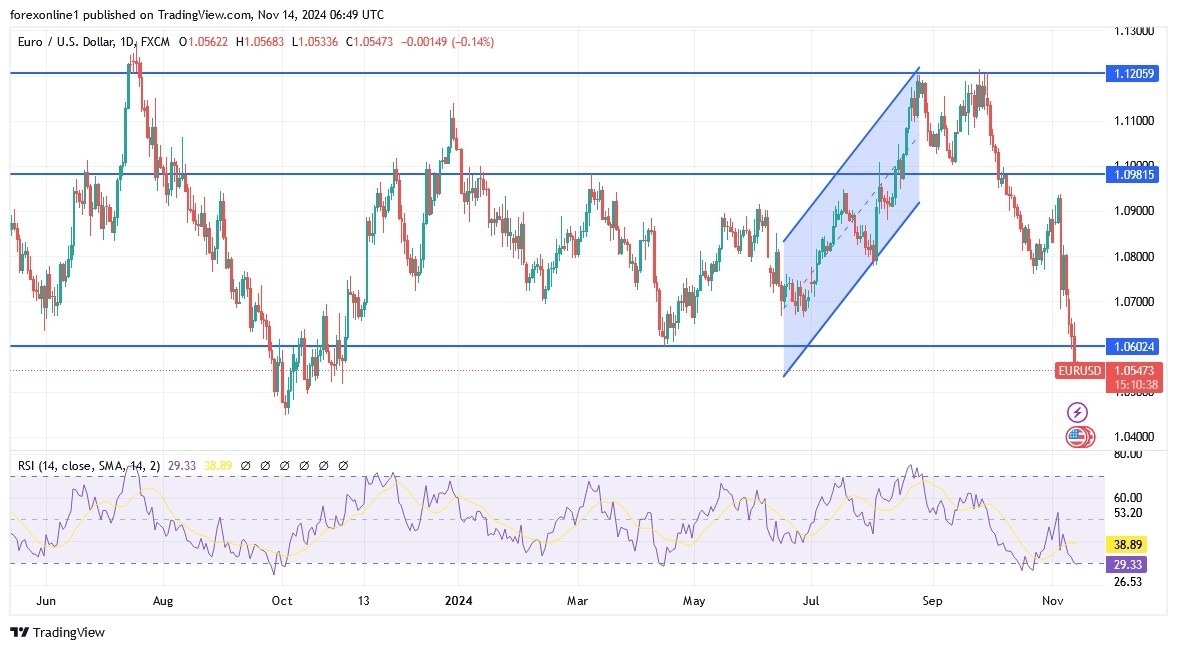
Undoubtedly, the rise in US inflation rates has eased the pace of monetary policy easing by the US Federal Reserve, which is positive for the US dollar against other major currencies. Conversely, the European Central Bank is adopting an easing path. The US dollar has gained in the forex market following the rise in the main US consumer price index by 0.2% on a monthly basis in October, bringing the annual rate to 2.6% from 2.4% in September. Generally, the strength of the US dollar reflects the fading expectations of future US interest rate cuts, especially as investors are prepared for inflation to remain above the Federal Reserve’s target of 2.0% for a long time.

There has been increasing talk about the possibility of the EUR/USD moving to parity at 1.1. According to reliable trading platforms, the EUR/USD pair has entered a downward trend in October, with selling intensifying after the unexpectedly strong performance of Donald Trump and the Republicans in the US presidential election vote. Expectations for further collapse of the euro against the dollar have increased as Trump wants to raise tariffs on US imports, which will affect the economies of exporters such as the eurozone. As is known, the United States is the main market for exporting manufactured goods in the eurozone, while any economic blow to China from tariffs will also affect another critical market.
Meanwhile, the ruling coalition in Germany has collapsed, and Europe’s largest economy is now facing a winter of political uncertainty ahead of the February elections.
The overall downward trend of the EUR/USD is gaining strength with the breaking of a key support level of 1.0600. As mentioned in previous technical analyses of the currency pair that this could give bears more strength. Therefore, dear reader, you should expect more downward pressure on the euro against the dollar daily as the picture becomes clearer for the upcoming Trump policies. At the same time, the eurozone, led by Germany, is going through political and economic turbulence.
Investing.com — UBS has raised its forecast for the in a note Thursday, expecting significant fluctuations in the exchange rate over the coming year.
The bank now projects the currency pair to reach 155 by December 2024, followed by 152 in March 2025, 150 in June, and 147 in September.
By year-end 2025, UBS targets 145, a revision from its earlier predictions of 147, 143, 140, and 138, respectively.
According to UBS, a near-term surge to 158-160 remains possible, especially if U.S. 10-year yields rise another 30-40 basis points, potentially hitting 4.8%.
“Based on sensitivity analysis over the past three years, a 10bp widening of the US-Japan 10-year yield differential coincides with a one-yen rise in the USDJPY exchange rate,” UBS explained.
If U.S. bond yields indeed spike to 4.8%, the bank says USD/JPY could temporarily reach 160, though they view this level as “unsustainable” and likely to invite Japanese intervention, as observed during similar peaks earlier in 2024.
UBS analysts believe the USD/JPY will face downward pressure in 2025, driven by several factors. A key factor is the anticipated Fed rate-cutting cycle, which UBS expects will lead to lower U.S. yields.
“We think current USDJPY levels are higher than justified by yield differentials,” UBS notes, estimating that the currency pair should trend toward 145-146.
Additionally, trade tensions and a potential Trump-led administration’s focus on a stronger yen may reinforce this trend.
For investors, UBS suggests that any near-term spike toward 160 could be an opportunity to “tactically sell USDJPY.” Over the long term, UBS sees multiple forces supporting a downtrend, with USD/JPY likely to end 2025 at 145.
Spot Gold trades around $2,575 a troy ounce, recovering from a fresh multi-week low of $2,536.68 posted during European trading hours. The US Dollar maintained its positive momentum until Wall Street’s opening, reaching once again fresh highs across the FX board.
United States (US) data came in mixed, as the country reported that Initial Jobless Claims shrank to 217K in the week ended November 8, better than the 223K anticipated. However, the October Producer Price Index (PPI) rose by more than expected, reviving inflation-related concerns. Wholesale inflation was up by 0.2% in the month and 2.4% from a year earlier. The core annual reading printed at 3.1%, above the 3% forecast and the previous 2.9%. The latter was upwardly revised from a previous estimate of 2.8%.
Meanwhile, different Federal Reserve (Fed) officials have been on the wires. So far, comments have added nothing new to what the market already knew about monetary policy. Later in the day, the focus will be on Chairman Jerome Powell, due to participate in a panel discussion titled “Global Perspectives” at an event hosted by the Federal Reserve Bank of Dallas. Comments on monetary policy may be limited, but questions about how the upcoming Donald Trump government will affect the central bank’s decision will be at the top of the list.
European Central Bank (ECB) President Christine Lagarde and Bank of England (BoE) Governor Andrew Bailey are also expected to share their thoughts.
The daily chart for XAU/USD shows that it bounced from a bullish 100 Simple Moving Average (SMA) and that the pair develops far below a bearish 20 SMA. At the same time, technical indicators keep heading south near oversold readings, albeit losing their downward strength.
In the near term, and according to the 4-hour chart, the ongoing upward correction seems poised to continue. Technical indicators aim sharply north, albeit still below their midlines. At the same time, the 20 SMA heads firmly lower, currently providing dynamic resistance at around $2,594.20. Finally, the 100 SMA gains downward traction above the 200 SMA, approaching the longer one, usually hinting at a long-lasting bearish trend.
Support levels: 2,548.70 2,536.60 2,522.40
Resistance levels: 2,581.35 2,594.20 2,611.05
The table below shows the percentage change of British Pound (GBP) against listed major currencies today. British Pound was the strongest against the Swiss Franc.
| USD | EUR | GBP | JPY | CAD | AUD | NZD | CHF | |
|---|---|---|---|---|---|---|---|---|
| USD | 0.08% | 0.10% | 0.14% | 0.17% | 0.13% | 0.08% | 0.20% | |
| EUR | -0.08% | 0.02% | 0.07% | 0.09% | 0.04% | -0.00% | 0.12% | |
| GBP | -0.10% | -0.02% | 0.06% | 0.08% | 0.03% | -0.02% | 0.10% | |
| JPY | -0.14% | -0.07% | -0.06% | 0.04% | -0.01% | -0.09% | 0.07% | |
| CAD | -0.17% | -0.09% | -0.08% | -0.04% | -0.04% | -0.09% | 0.03% | |
| AUD | -0.13% | -0.04% | -0.03% | 0.00% | 0.04% | -0.04% | 0.08% | |
| NZD | -0.08% | 0.00% | 0.02% | 0.09% | 0.09% | 0.04% | 0.11% | |
| CHF | -0.20% | -0.12% | -0.10% | -0.07% | -0.03% | -0.08% | -0.11% |
The heat map shows percentage changes of major currencies against each other. The base currency is picked from the left column, while the quote currency is picked from the top row. For example, if you pick the British Pound from the left column and move along the horizontal line to the US Dollar, the percentage change displayed in the box will represent GBP (base)/USD (quote).
Silver price (XAG/USD) discovers a temporary support near $29.70 in Thursday’s North American session. The white metal finds cushion as the US Dollar (USD) gives up some intraday gains after posting a fresh annual high. The rally in the US Dollar index (DXY), which gauges Greenback’s value against six major currencies, pauses for a while after jumping to near 107.00.
The Greenback faces mild pressure after the release of the US Initial Jobless Claims for the week ending November 8 and the Producer Price Index (PPI) data for October even though the data was USD-positive. Individuals claiming jobless benefits for the first time came in surprisingly lower at 217K than the prior release of 221K, which was expected at 223K.
The headline producer inflation data accelerated to 2.4%, faster than estimates of 2.3% and the September reading of 1.9%. In the same period, the core PPI – which strips off volatile food and energy prices rose by 3.1% than estimates of 3% and the former release of 2.9%. Historically, signs of acceleration in price pressures weigh on market expectations for Federal Reserve (Fed) interest rate cuts, however, the impact is expected to negligible as officials are more worried about stabilizing job market.
For more interest rate cues, investors await Fed Chair Jerome Powell’s speech, which is scheduled at 20:00 GMT.
Meanwhile, the outlook of the Silver price is expected to remain vulnerable as policies of President-elected Donald Trump could limit the Fed’s potential of cutting interest rates aggressively.
Silver price stays on track toward the upward-sloping trendline around $29.00, plotted from the February 28 low of $22.30. The white metal weakened after the breakdown of the horizontal support plotted from the May 21 high of $32.50.
The near-term trend of the Silver price has weakened as the 20-day Exponential Moving Average (EMA) starts declining, which trades around $32.00.
The 14-day Relative Strength Index (RSI) slides to near 40.00. A bearish momentum will trigger if the RSI (14) sustains below the same.
Silver is a precious metal highly traded among investors. It has been historically used as a store of value and a medium of exchange. Although less popular than Gold, traders may turn to Silver to diversify their investment portfolio, for its intrinsic value or as a potential hedge during high-inflation periods. Investors can buy physical Silver, in coins or in bars, or trade it through vehicles such as Exchange Traded Funds, which track its price on international markets.
Silver prices can move due to a wide range of factors. Geopolitical instability or fears of a deep recession can make Silver price escalate due to its safe-haven status, although to a lesser extent than Gold’s. As a yieldless asset, Silver tends to rise with lower interest rates. Its moves also depend on how the US Dollar (USD) behaves as the asset is priced in dollars (XAG/USD). A strong Dollar tends to keep the price of Silver at bay, whereas a weaker Dollar is likely to propel prices up. Other factors such as investment demand, mining supply – Silver is much more abundant than Gold – and recycling rates can also affect prices.
Silver is widely used in industry, particularly in sectors such as electronics or solar energy, as it has one of the highest electric conductivity of all metals – more than Copper and Gold. A surge in demand can increase prices, while a decline tends to lower them. Dynamics in the US, Chinese and Indian economies can also contribute to price swings: for the US and particularly China, their big industrial sectors use Silver in various processes; in India, consumers’ demand for the precious metal for jewellery also plays a key role in setting prices.
Silver prices tend to follow Gold’s moves. When Gold prices rise, Silver typically follows suit, as their status as safe-haven assets is similar. The Gold/Silver ratio, which shows the number of ounces of Silver needed to equal the value of one ounce of Gold, may help to determine the relative valuation between both metals. Some investors may consider a high ratio as an indicator that Silver is undervalued, or Gold is overvalued. On the contrary, a low ratio might suggest that Gold is undervalued relative to Silver.
Investing.com — UBS has raised its forecast for the in a note Thursday, expecting significant fluctuations in the exchange rate over the coming year.
The bank now projects the currency pair to reach 155 by December 2024, followed by 152 in March 2025, 150 in June, and 147 in September.
By year-end 2025, UBS targets 145, a revision from its earlier predictions of 147, 143, 140, and 138, respectively.
According to UBS, a near-term surge to 158-160 remains possible, especially if U.S. 10-year yields rise another 30-40 basis points, potentially hitting 4.8%.
“Based on sensitivity analysis over the past three years, a 10bp widening of the US-Japan 10-year yield differential coincides with a one-yen rise in the USDJPY exchange rate,” UBS explained.
If U.S. bond yields indeed spike to 4.8%, the bank says USD/JPY could temporarily reach 160, though they view this level as “unsustainable” and likely to invite Japanese intervention, as observed during similar peaks earlier in 2024.
UBS analysts believe the USD/JPY will face downward pressure in 2025, driven by several factors. A key factor is the anticipated Fed rate-cutting cycle, which UBS expects will lead to lower U.S. yields.
“We think current USDJPY levels are higher than justified by yield differentials,” UBS notes, estimating that the currency pair should trend toward 145-146.
Additionally, trade tensions and a potential Trump-led administration’s focus on a stronger yen may reinforce this trend.
For investors, UBS suggests that any near-term spike toward 160 could be an opportunity to “tactically sell USDJPY.” Over the long term, UBS sees multiple forces supporting a downtrend, with USD/JPY likely to end 2025 at 145.
The GBP/USD forecast shows the dollar at new peaks as the Trump trade overshadows recent inflation figures. As a result, the pound remained weak against the greenback despite hawkish remarks from policymakers.
–Are you interested to learn more about low spread forex brokers? Check our detailed guide-
On Wednesday, the US released its CPI report, which aligned with expectations. Consumer prices increased by 0.2% in October, while core prices increased by 0.3%. Meanwhile, the annual figure rose by 2.6%. Since the increase in inflation was expected, the Fed will likely lower borrowing costs in December.
The dollar initially retreated before climbing as market participants shifted their focus to Trump’s win. Traders expect Trump’s policies to drive inflation and pause or significantly slow Fed rate cuts.
The next significant reports will include wholesale inflation and retail sales. Producer prices are a leading indicator of future consumer prices. Therefore, rate-cut bets might ease if producer prices are higher than expected. The opposite is also true. Meanwhile, retail sales will show consumers’ financial health. High sales will show robust consumer spending, reducing rate-cut bets. On the other hand, low sales will indicate weak consumer spending, solidifying bets for a December rate cut.
Meanwhile, in the UK, Bank of England policymaker Catherine Mann noted that inflation might be higher than expected in the medium term. Mann is the only policymaker who voted against a rate cut at the last BoE meeting. Market bets for rate cuts in the UK have dropped since the reading of the new government budget. The BoE might only cut rates twice next year.
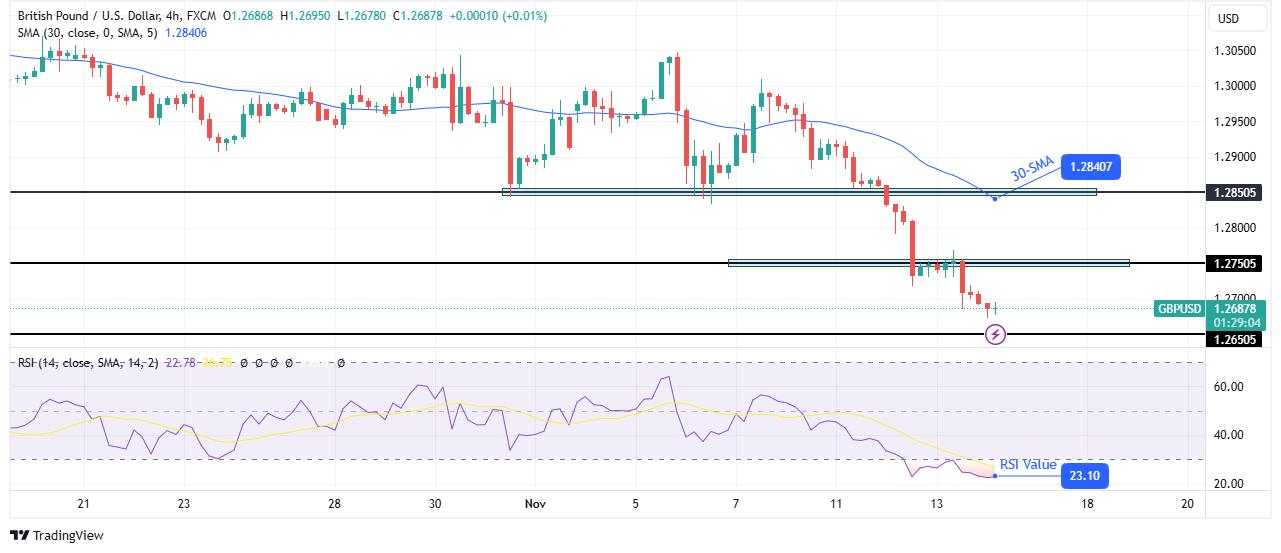
On the technical side, the GBP/USD price has broken below the 1.2750 key support to make a new low in the downtrend. Moreover, the price trades well below the 30-SMA, showing bears have a strong lead. At the same time, the RSI is in the oversold region, indicating solid bearish momentum.
–Are you interested in learning more about AI trading brokers? Check our detailed guide-
The next target for the pair is at the 1.2650 support level. However, after such a steep collapse, bulls might be preparing to return for a pullback to the 1.2750 level or the 30-SMA.
Looking to trade forex now? Invest at eToro!
67% of retail investor accounts lose money when trading CFDs with this provider. You should consider whether you can afford to take the high risk of losing your money.
The USD/JPY outlook shows sharp declines in the yen as the dollar scales new peaks due to optimism about Trump’s election win. Meanwhile, top officials in Japan are getting concerned about a weak yen, with some urging the BoJ to hike rates.
–Are you interested to learn more about low spread forex brokers? Check our detailed guide-
According to data from the Bank of Japan, the yen has lost around 30% of its value against the dollar since 2020. This decline has come from low interest rates in Japan, which has created a wide rate differential with the US. However, the BoJ recently shifted to rate hikes before pausing amid concerns about market volatility.
Meanwhile, US Treasury yields and the dollar have risen since Trump won the election. At the same time, Fed rate cut expectations have dropped. Therefore, the hope of quickly shrinking the rate gap is fading.
On Thursday, a top opposition leader said that the Bank of Japan should raise rates to 1% to support the weak yen. Moreover, he added that the central bank should be vocal about its plans.
Meanwhile, data on Wednesday revealed that US consumer inflation rose as expected in October. On a monthly basis, it increased by 0.2%, while annually, it rose by 2.6%. Therefore, the Fed will likely lower borrowing costs by 25-bps in December.
However, the outlook for rate cuts in 2025 has changed with Trump as the new president. His policies on taxes and trade will likely be inflationary. Therefore, the Fed might have to pause or cut rates more slowly than expected.
Elsewhere, the US will release wholesale inflation and retail sales figures, which will continue to shape bets on a December Fed rate cut. Moreover, market participants will pay attention to Powell’s speech.

On the technical side, the USD/JPY price has reached a new peak near the 156.02 key level. The price trades well above the 30-SMA, indicating a strong bullish move. Moreover, bullish momentum is strong, with the RSI in the overbought region.
–Are you interested in learning more about AI trading brokers? Check our detailed guide-
Initially, the price had struggled to breach the 154.00 resistance level. However, when it did, bulls confirmed a continuation of the previous bullish trend.
Looking to trade forex now? Invest at eToro!
67% of retail investor accounts lose money when trading CFDs with this provider. You should consider whether you can afford to take the high risk of losing your money.
Silver price (XAG/USD) extends its losses to two-month lows, trading around $29.90 per troy ounce during the European hours on Thursday. This downside of the safe-haven Silver is attributed to improving risk sentiment since Donald Trump’s election victory last week.
The US Dollar (USD), equities, and cryptocurrencies are advancing as markets anticipate strong growth and higher inflation under the incoming Trump administration. The proposed policies could drive increased investment, spending, and labor demand, raising inflation risks.
The dollar-denominated Silver faces challenges due to solid US Dollar (USD). The US Dollar Index (DXY), which measures the value of the US Dollar against its six major peers, holds steady around 106.60, its highest level since November 2023.
The US Dollar also gains support from rising US Treasury yields, with the 2-year and 10-year yields standing at 4.29% and 4.46%, respectively, at the time of writing. Additionally, these higher yields are exerting downward pressure on non-yielding assets like Silver.
The non-interest-bearing assets like Silver might have received downward pressure from less dovish remarks by Federal Reserve (Fed) officials on Wednesday. St. Louis Fed President Alberto Musalem remarked that ongoing inflationary pressures make it challenging for the Fed to maintain a course of rate cuts. Musalem shifted focus to the robustness of the US labor market, aiming to ease concerns about inflation’s resistance to the Fed’s efforts to reduce it.
Federal Reserve Bank of Kansas City President Jeffrey Schmid highlighted potential challenges in the journey toward lowering interest rates. Schmid also criticized market participants who continue to hold out hope for a return to near-zero rates, calling their expectations unrealistic.
Silver is a precious metal highly traded among investors. It has been historically used as a store of value and a medium of exchange. Although less popular than Gold, traders may turn to Silver to diversify their investment portfolio, for its intrinsic value or as a potential hedge during high-inflation periods. Investors can buy physical Silver, in coins or in bars, or trade it through vehicles such as Exchange Traded Funds, which track its price on international markets.
Silver prices can move due to a wide range of factors. Geopolitical instability or fears of a deep recession can make Silver price escalate due to its safe-haven status, although to a lesser extent than Gold’s. As a yieldless asset, Silver tends to rise with lower interest rates. Its moves also depend on how the US Dollar (USD) behaves as the asset is priced in dollars (XAG/USD). A strong Dollar tends to keep the price of Silver at bay, whereas a weaker Dollar is likely to propel prices up. Other factors such as investment demand, mining supply – Silver is much more abundant than Gold – and recycling rates can also affect prices.
Silver is widely used in industry, particularly in sectors such as electronics or solar energy, as it has one of the highest electric conductivity of all metals – more than Copper and Gold. A surge in demand can increase prices, while a decline tends to lower them. Dynamics in the US, Chinese and Indian economies can also contribute to price swings: for the US and particularly China, their big industrial sectors use Silver in various processes; in India, consumers’ demand for the precious metal for jewellery also plays a key role in setting prices.
Silver prices tend to follow Gold’s moves. When Gold prices rise, Silver typically follows suit, as their status as safe-haven assets is similar. The Gold/Silver ratio, which shows the number of ounces of Silver needed to equal the value of one ounce of Gold, may help to determine the relative valuation between both metals. Some investors may consider a high ratio as an indicator that Silver is undervalued, or Gold is overvalued. On the contrary, a low ratio might suggest that Gold is undervalued relative to Silver.