The main category of Forex News.
You can use the search box below to find what you need.
[wd_asp id=1]
The main category of Forex News.
You can use the search box below to find what you need.
[wd_asp id=1]
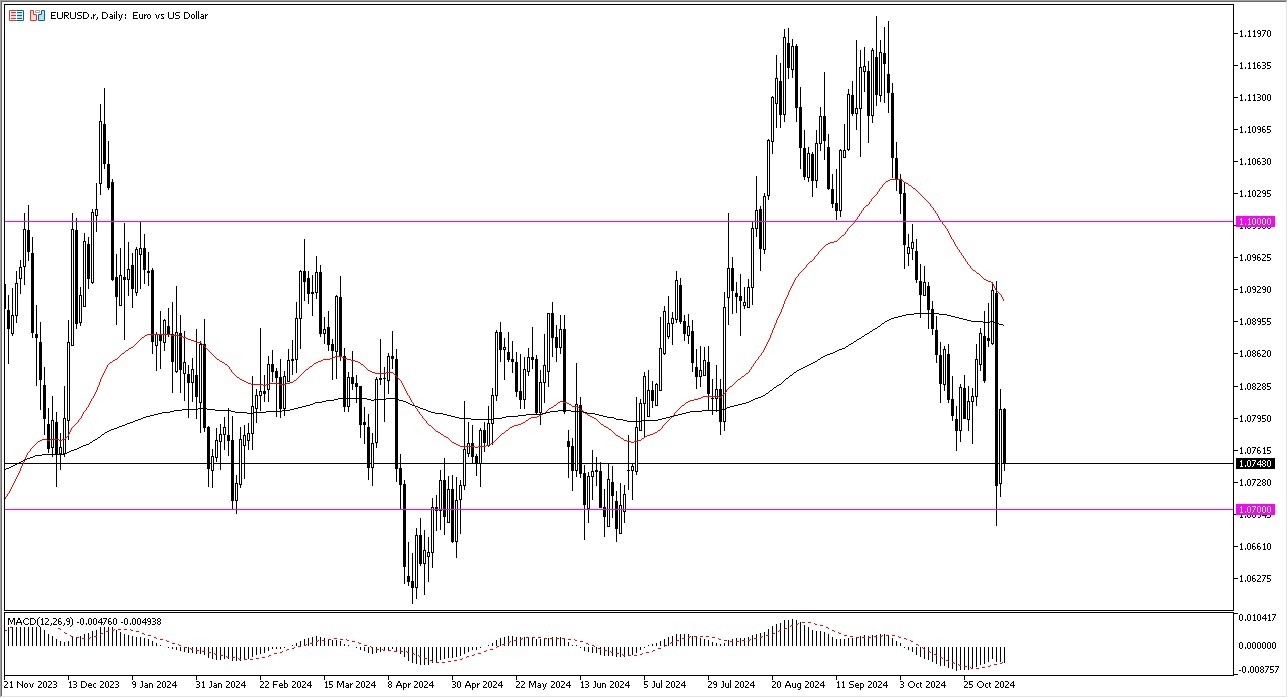
Longer-term traders probably need to see a little bit more convincing price action. So right now, we’ll have to see how this closes out, but it certainly looks like a market that is seeing a lot of support near the 1.07 level. And then again, probably at the 1.06 level, if we do in fact continue to fall. This would be a major area of support and trouble, and therefore we will have to pay close attention to it.

All things being equal, EUR/USD is a market that is moving based on interest rates in America going higher, despite the fact that the Fed continues to cut rates. This shows that the bond market is starting to get out of control a little bit. And perhaps that’s part of what’s going on. Remember, the US dollar is considered to be a safety currency, so that is something that you need to take into account anytime you trade this market.
Nonetheless, this is one that I think you favor short-term bounces and fading signs of exhaustion on the upside. I’m not aggressive in this market at all. And most of the time I just use it as an indicator as to how to trade the US dollar against almost everything else. As in general, if you get the US dollar right in the Forex world, you get most things right.
Ready to trade our EUR/USD Forex forecast? Here’s a list of some of the top forex brokers in Europe to check out.
I wrote on 3rd November that the best trade opportunities for the week were likely to be:
The weekly gain of 1.12% equals 0.56% per asset.
Last week’s key takeaways were:
The coming week’s schedule is shorter but includes two items that have the potential to make a very big impact: data from the USA on CPI (inflation) and PPI (purchasing power index), which will give big clues about the future timing of the Fed’s rate hikes.
I made no monthly forecast for November, as the long-term trends in the Forex market are too unclear.
I made no weekly forecast this week, as there were no unusually strong directional price movements over the past week, which is the basis of my weekly trading strategy.
Last week, the Japanese Yen was the strongest major currency, while the Euro was the weakest. However, the number was relatively low, so this is probably not a meaningful statistic.
You can trade these forecasts in a real or demo Forex brokerage account.

Last week, the US Dollar Index printed a bullish engulfing candlestick that successfully broke out beyond the resistance level at 104.15. This is a bullish sign, but it should be noted that the candlestick has a large upper wick, showing that the Dollar struggled to hold some of its earlier gains.
The price is above its level from three months ago but below its level from six months ago, suggesting a long-term mixed trend in the greenback, which indicates uncertainty.
It is also worth noting that despite the recent bullish momentum, the price is trading not far from the middle of a consolidating triangle chart pattern. This is suggestive of ultimately ranging behaviour.
This week’s outlook for the US Dollar remains unclear despite President Trump’s election and the near certainty that the Republicans will control both Houses of Congress, which should have strengthened the US Dollar. The Dollar has strengthened, but not as much as we expected. This may be a sign that the Dollar is not going to rise much more.
Be very careful in trading the US Dollar long this week. If the price can establish itself above the triangle pattern’s upper trend line and the horizontal level at 105.81, that would be a decisive bullish sign to respect.

Last week, the US dollar strengthened due to the decisive Republican victory in the US general election. The Euro has been one of the weakest major currencies. These two factors gave us one of the strongest directional price movements in the Forex market last week in the EUR/USD currency pair. The weekly candlestick closed near its low, and the price reached its lowest level in over 4 months. The price is below its levels from both 3 and 6 months ago, which is my preferred metric for calling a long-term bearish trend.
So, it seems there are plenty of reasons to go short here, but I still see a few reasons to remain cautious:

I expected the USD/JPY currency pair to have potential support at ¥151.29.
The H1 price chart below shows how the price action rejected this support level with a large outside bar / engulfing candlestick, marked by the up arrow within the price chart below. This rejection occurred right at the start of the Tokyo session last Wednesday, which can often be a great time to find powerful reversals in the Japanese Yen.
This trade reached a floating profit approximately as large as the risk if the stop was placed just below the swing low, which was the low of the week.
I am not sure that this currency pair is respecting technical factors much right now. It seems to be pushed around by macro factors rather than its own parameters, so it is probably not a good currency pair for technical traders now. However, there is volatility left in it, so day traders could find catching swings here an interesting project.

Bitcoin, even in US Dollar terms, gained strongly over the past week, getting a significant boost from the election victories of President Trump and Congressional Republicans in both Houses. Republicans are seen as more likely to favour lighter regulation of cryptocurrency, so their ascendancy has boosted both crypto in particular and risk sentiment in general, which also helps a risky asset like Bitcoin.
Bitcoin traded over the weekend, and on Saturday and Sunday, it continued rising to new record highs. The screenshot below was taken on Sunday, and we can see there is hardly any upper wick on this candlestick, which is a very bullish sign, especially as the price is trading firmly within blue sky and the candlestick is relatively large.
There is every reason to be bullish on Bitcoin right now, and I am long of Bitcoin. However, I noticed that Bitcoin ETFs do not seem to be getting the full gain made by the underlying, not in some way, so if you can afford it, you might want to buy Bitcoin futures instead of a Bitcoin ETF or even spot Bitcoin itself if you can. There are Bitcoin micro futures available on the CME, which are only sized at 10% of the value of one Bitcoin.

US stock markets have been in bullish territory for quite a while, but the NASDAQ 100 Index has been mostly consolidating for a few months after making a record high early in the year on the back of strong gains. In recent years, it has been excellent for many major tech stocks that are members of this index.
The bullish breakout led to new record highs after the Republican clean sweep in the US general election. In 2016, when President Trump was first elected, the rally in the broader stock market triggered by his election was bigger than the rally seen in the tech sector. However, that may be different now as Trump is seen as having become friendlier to the tech sector—this might also be connected to the fact that Elon Musk is going to play a role in the new administration.
There is almost no upper wick on the weekly candlestick here, and the candlestick is of a relatively large size, so there seems to be every reason to be long of this Index.
I see the NASDAQ 100 Index as a buy.

I wrote last week that this major, broad US stock market Index would likely make a bullish breakout to new record high prices if Trump won the US Presidential election. This was a good, accurate call.
The election of a new President has historically triggered quite large rallies in the US stock market. President Trump is famously pro-business, and Republicans look extremely likely to have captured both Houses of Congress, so we may be in for a renewed rally in this Index. Undoubtedly, the election results pushed the price strongly into blue sky.
Interestingly, the NASDAQ 100 Index rose slightly more than the broader S&P 500 Index. This suggests that a big rally might be more skewed towards tech stocks, but it is also true the NASDAQ 100 is just more volatile, so this differential might not be very significant.
There is almost no upper wick on the weekly candlestick here, and the candlestick is of a relatively large size, so there seems to be every reason to be long of this Index.
I see the S&P 500 Index as a buy.

I see the best trading opportunities this week as
Ready to trade our Forex weekly analysis? Check out our list of the top 10 Forex brokers in the world.
The GBP/USD pair weakens to near 1.2910 during the early European session on Monday. The stronger US Dollar (USD) following Donald Trump’s election win continues to undermine the major pair as traders expect the inflationary impulses will keep the US Federal Reserve (Fed) from cutting rates as much as they otherwise would have.
On the other hand, the Bank of England (BoE) reiterated that “a gradual approach to removing policy restraint remains appropriate. Monetary policy will need to continue to remain restrictive for sufficiently long.” Less dovish remarks from the UK central bank could help limit the INR’s losses in the near term.
According to the daily chart, GBP/USD keeps the bearish vibe unchanged on the daily timeframe, with the price holding below the key 100-day Exponential Moving Average (EMA). Furthermore, the downward momentum is reinforced by the 14-day Relative Strength Index (RSI), which is located below the midline around 43.85, indicating the path of least resistance is to the downside.
The initial support level for GBP/USD emerges at 1.2875, the low of November 7. Further south, the next contention level is located in the 1.2850-1.2840 zone, representing the lower limit of the Bollinger Band and the low of October 31.
On the bright side, the 100-day EMA at 1.2983 acts as an immediate resistance level for the major pair. The crucial upside barrier is seen at the 1.3000 psychological level. A decisive break above this level could see a rally to 1.3048, the high of November 6.
The Pound Sterling (GBP) is the oldest currency in the world (886 AD) and the official currency of the United Kingdom. It is the fourth most traded unit for foreign exchange (FX) in the world, accounting for 12% of all transactions, averaging $630 billion a day, according to 2022 data. Its key trading pairs are GBP/USD, also known as ‘Cable’, which accounts for 11% of FX, GBP/JPY, or the ‘Dragon’ as it is known by traders (3%), and EUR/GBP (2%). The Pound Sterling is issued by the Bank of England (BoE).
The single most important factor influencing the value of the Pound Sterling is monetary policy decided by the Bank of England. The BoE bases its decisions on whether it has achieved its primary goal of “price stability” – a steady inflation rate of around 2%. Its primary tool for achieving this is the adjustment of interest rates. When inflation is too high, the BoE will try to rein it in by raising interest rates, making it more expensive for people and businesses to access credit. This is generally positive for GBP, as higher interest rates make the UK a more attractive place for global investors to park their money. When inflation falls too low it is a sign economic growth is slowing. In this scenario, the BoE will consider lowering interest rates to cheapen credit so businesses will borrow more to invest in growth-generating projects.
Data releases gauge the health of the economy and can impact the value of the Pound Sterling. Indicators such as GDP, Manufacturing and Services PMIs, and employment can all influence the direction of the GBP. A strong economy is good for Sterling. Not only does it attract more foreign investment but it may encourage the BoE to put up interest rates, which will directly strengthen GBP. Otherwise, if economic data is weak, the Pound Sterling is likely to fall.
Another significant data release for the Pound Sterling is the Trade Balance. This indicator measures the difference between what a country earns from its exports and what it spends on imports over a given period. If a country produces highly sought-after exports, its currency will benefit purely from the extra demand created from foreign buyers seeking to purchase these goods. Therefore, a positive net Trade Balance strengthens a currency and vice versa for a negative balance.
Gold price has opened a new week on the back foot below $2,700, looking to extend its three-week losing streak. Rebounding US Treasury bond yields and China’s economic concerns offset a pause in the US Dollar( USD) upsurge, exerting additional downside pressure on Gold price.
US Treasury bond yields stage a comeback in Asian trading on Monday after a dovish US Federal Reserve (Fed) interest-rate cut decision-led retracement late last week.
Meanwhile, the market’s disappointment with China’s 10 trillion yuan ($1.4 trillion) debt package and softening inflation raised concerns over the dragon nation’s economic prospects, rendering negative for Gold price. China is the world’s biggest Gold consumer.
China’s CPI rose 0.3% last month from a year earlier, slowing from September’s 0.4% rise and the lowest since June, data from the National Bureau of Statistics (NBS) showed on Saturday, missing a 0.4% increase estimated.
Further, investors remain wary of the more profound economic consequences of potential tariffs that US President-elect Donald Trump will impose once he returns to office in January of next year. This nervousness remains a drag on the bright metal even as USD buyers take a breather following the previous week’s relentless rise.
Gold traders also resort to position adjustments heading into the all-important US Consumer Price Index (CPI) inflation data due for release on Wednesday. However, a Veterans Day holiday in the US could exaggerate the Gold price action in the upcoming sessions.
Looking ahead, the broader market sentiment will play a pivotal role in influencing the value of the USD and the Gold price amid holiday-thinned trading conditions.
As observed on the daily chart, Gold price breached support at $2,673, the 61.8% Fibonacci Retracement (Fibo) level of the latest record rally from the October 10 low of $2,604 to the new all-time high of $2,790, as it witnessed a fresh leg down.
If the downside momentum gathers traction, sellers will attack $2,641 strong support again, which is the confluence of the 50-day Simple Moving Average (SMA) and the 78.6% Fibo level of the same advance.
The 14-day Relative Strength Index (RSI) points lower below the 50 level, having pierced that level from above on Friday. The leading indicator, therefore, suggests that more pain remains in the offing for Gold price.
On finding a solid foothold below the abovementioned critical support at $2,641, Gold sellers could flex their muscles toward the October 10 low of $2,604.
Conversely, Gold buyers need acceptance above the $2,700 barrier to test the healthy resistance at $2,718, where the 38.2% Fibo level and 21-day SMA converge.
A fresh uptrend would be initiated above that level as buyers aim for the previous static resistance near $2,745, where the 23.6% Fibo aligns.
Gold has played a key role in human’s history as it has been widely used as a store of value and medium of exchange. Currently, apart from its shine and usage for jewelry, the precious metal is widely seen as a safe-haven asset, meaning that it is considered a good investment during turbulent times. Gold is also widely seen as a hedge against inflation and against depreciating currencies as it doesn’t rely on any specific issuer or government.
Central banks are the biggest Gold holders. In their aim to support their currencies in turbulent times, central banks tend to diversify their reserves and buy Gold to improve the perceived strength of the economy and the currency. High Gold reserves can be a source of trust for a country’s solvency. Central banks added 1,136 tonnes of Gold worth around $70 billion to their reserves in 2022, according to data from the World Gold Council. This is the highest yearly purchase since records began. Central banks from emerging economies such as China, India and Turkey are quickly increasing their Gold reserves.
Gold has an inverse correlation with the US Dollar and US Treasuries, which are both major reserve and safe-haven assets. When the Dollar depreciates, Gold tends to rise, enabling investors and central banks to diversify their assets in turbulent times. Gold is also inversely correlated with risk assets. A rally in the stock market tends to weaken Gold price, while sell-offs in riskier markets tend to favor the precious metal.
The price can move due to a wide range of factors. Geopolitical instability or fears of a deep recession can quickly make Gold price escalate due to its safe-haven status. As a yield-less asset, Gold tends to rise with lower interest rates, while higher cost of money usually weighs down on the yellow metal. Still, most moves depend on how the US Dollar (USD) behaves as the asset is priced in dollars (XAU/USD). A strong Dollar tends to keep the price of Gold controlled, whereas a weaker Dollar is likely to push Gold prices up.
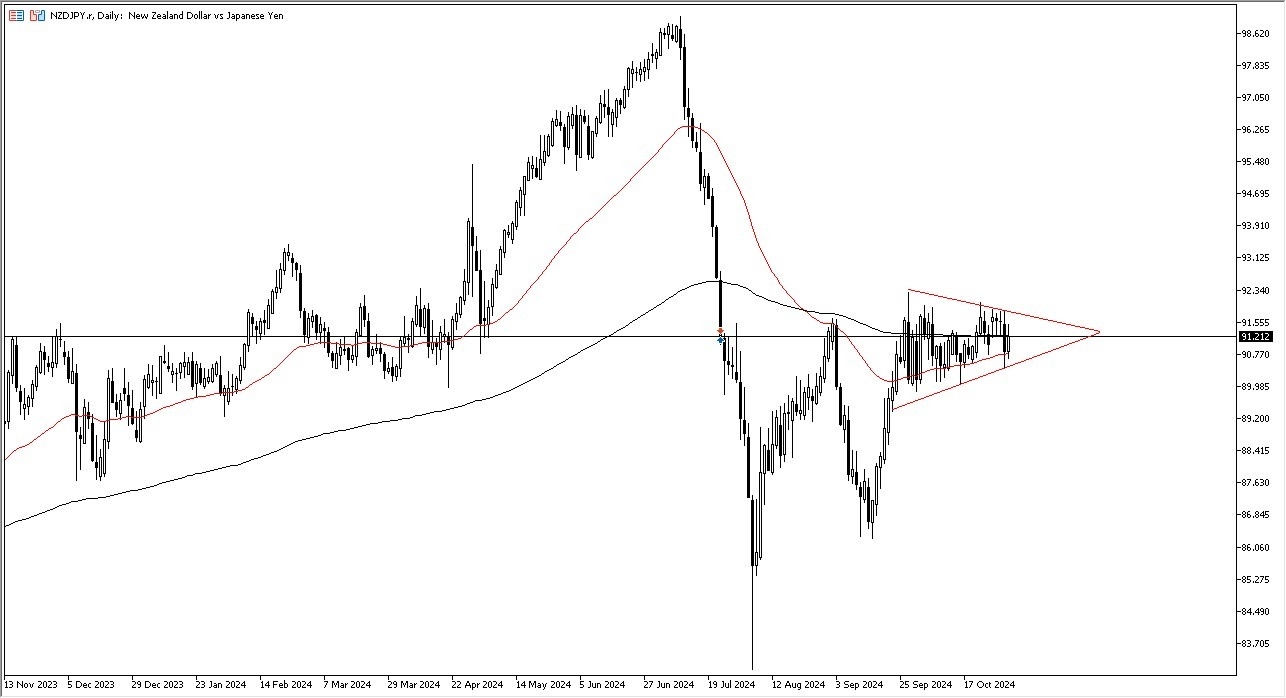
Further adding interest to this pair is the fact that we are in the midst of a symmetrical triangle, so we are almost certainly going to see some type of explosion in one direction or the other.
If we break to the upside, that could see a move to the ¥95 level, as the Japanese yen itself would probably be in trouble around the world.
On the other hand, if we were to break down from here, we could drop to the ¥89 level where we might be able to find some support. Either way, the fact that we are compressing the way we are does suggest that we are probably going to see some problems as far as volatility is concerned sooner rather than later.
The NZD/JPY currency pair is going to be very sensitive to risk appetite as the New Zealand dollar is considered to be a “risk on currency”, and of course the Japanese yen is considered to be a major “safety currency.” With this being the case, think you have to look at it through the prism of what the rest of the market is doing, because quite frankly if we see traders suddenly pick one direction or the other as far as whether or not risk appetite is picking up, then we could see an explosive move here.
All things being equal, keep in mind that you get paid at the end of every day to hold onto this pair, so I do favor the upside, but that of course assumes that we get some type of momentum play as well. In the short term, there are a lot of people out there taking advantage of the carry trade.
Not sure which broker to choose? We’ve made a list of the best forex brokers for you.
Gold price (XAU/USD) trades in negative territory near $2,680 during the early Asian session on Monday. The downtick of the precious metal is pressured by a stronger US Dollar (USD) due to Donald Trump’s victory.
Meanwhile, the US Dollar Index (DXY), an index of the value of the USD measured against a basket of six world currencies, extends its upside to around 105.00, the four-month high.
Trump’s victory has fuelled questions about whether the US Federal Reserve (Fed) may proceed to cut rates at a slower and smaller pace. This, in turn, boosts the Greenback and weighs on the USD-denominated Gold price.
“This rally in the dollar and yields has put pressure on gold, which traditionally falls as real interest rates rise, reflecting reduced demand for safe-haven assets in the short term,” noted Matthew Jones, precious metals analyst at London-based metals trader Solomon Global. “However, from a longer-term, macro perspective, the future is ‘as good as gold,” added Jones.
The upbeat US economic data on Friday contributes to the USD’s upside. The US Consumer Sentiment Index rose to 73.0 in November from 70.5 in October, according to the preliminary reading by the University of Michigan. This figure came in better than the market expectation of 71.0.
On the other hand, the global economic uncertainty and the ongoing geopolitical tensions in the Middle East might help limit the yellow metal’s losses. Israeli army Chief of Staff Herzi Halevi approved the expansion of the ground invasion of southern Lebanon, state broadcaster Kan reports.
Gold has played a key role in human’s history as it has been widely used as a store of value and medium of exchange. Currently, apart from its shine and usage for jewelry, the precious metal is widely seen as a safe-haven asset, meaning that it is considered a good investment during turbulent times. Gold is also widely seen as a hedge against inflation and against depreciating currencies as it doesn’t rely on any specific issuer or government.
Central banks are the biggest Gold holders. In their aim to support their currencies in turbulent times, central banks tend to diversify their reserves and buy Gold to improve the perceived strength of the economy and the currency. High Gold reserves can be a source of trust for a country’s solvency. Central banks added 1,136 tonnes of Gold worth around $70 billion to their reserves in 2022, according to data from the World Gold Council. This is the highest yearly purchase since records began. Central banks from emerging economies such as China, India and Turkey are quickly increasing their Gold reserves.
Gold has an inverse correlation with the US Dollar and US Treasuries, which are both major reserve and safe-haven assets. When the Dollar depreciates, Gold tends to rise, enabling investors and central banks to diversify their assets in turbulent times. Gold is also inversely correlated with risk assets. A rally in the stock market tends to weaken Gold price, while sell-offs in riskier markets tend to favor the precious metal.
The price can move due to a wide range of factors. Geopolitical instability or fears of a deep recession can quickly make Gold price escalate due to its safe-haven status. As a yield-less asset, Gold tends to rise with lower interest rates, while higher cost of money usually weighs down on the yellow metal. Still, most moves depend on how the US Dollar (USD) behaves as the asset is priced in dollars (XAU/USD). A strong Dollar tends to keep the price of Gold controlled, whereas a weaker Dollar is likely to push Gold prices up.
November 10, 2024 – Written by Frank Davies
STORY LINK Pound to Dollar Week Ahead Forecast: Trump trades dominate GBPUSD
ING has upgraded its dollar forecasts following the US Presidential election and now has an end-2025 Pound to Dollar (GBP/USD) exchange rate forecast of 1.24.
MUFG added; “the bullish implications for the US dollar from a Trump victory and likely Red Sweep will cap further upside for cable beyond the 1.3000-level.”
According to ING; “A Trump win is clearly bullish for the dollar – but the challenge will be in timing it.”
There was a high degree of uncertainty ahead of the US Presidential election, although betting markets had indicated a Trump victory.
In the event, Trump secured a convincing victory in the electoral college and won the popular vote.
The Republicans have also regained control of the Senate and, while there are still some House of Representatives elections to declare, a small Republican victory the most likely outcome which would give the party a clean sweep.
GBP/USD hit 11-week lows below 1.2850 after the US election and hit selling above 1.30.

According to ING; “President-elect Trump’s overwhelming mandate for looser fiscal policy plus universal protectionism should drag the dollar higher over a multi-year period.”
It added; “we pencil in peak dollar strength for something like late 2025/early 2026, when Trump’s new administration is firing up tariffs at a time of high US bond yields.”
MUFG takes a similar view; “President-elect Trump won a very strong mandate to deliver the policies he campaigned on and that will encourage him to act on trade tariffs, deportations of illegal immigrants and to extend this tax cuts and increase fiscal spending. The extent of these policies will remain unclear for some time but investors will likely position for quick implementation that will support yields and lift the US dollar.”
As far as economics is concerned, the Federal Reserve cut interest rates by 25 basis points to 4.75% which was in line with consensus forecasts.
Fed Chair Powell played down the slightly disappointing recent inflation data and indicated that there would be further gradual rate cuts.
J.P. Morgan expects a further rate cut in December, but added; “For 2025, however, the picture will be complicated by potential for trade and tax policies to add to the inflation outlook. The U.S. central bank’s rate trajectory has been clouded by Trump’s election victory as his plans for hefty tariffs are seen as stoking inflation.”
The Bank of England also cut interest rates by 25 basis points to 4.75% which was in line with market expectations.
The bank statement was relatively cautious over the outlook for further interest rate cuts, especially with some concerns that the budget measures would put some upward pressure on inflation.
The UK 10-year bond yield hit a 12-month high near 4.55% during the week before a retreat to near 4.45%.
According to Danske Bank; “the BoE delivered a hawkish twist to its guidance emphasising their gradual approach to reducing the restrictiveness of monetary policy. We think this supports our base case of the next cut coming in February.”
International Money Transfer? Ask our resident FX expert a money transfer question or try John’s new, free, no-obligation personal service! ,where he helps every step of the way,
ensuring you get the best exchange rates on your currency requirements.
November 10, 2024 – Written by Frank Davies
STORY LINK Pound to Euro Week Ahead Forecast: EUR concerns intensify, GBP Gains?
Foreign exchange analysts at MUFG expect that the Pound to Euro (GBP/EUR) exchange rate will strengthen towards 1.22.
The consensus view is that a slow pace of Bank of England rate cuts, allied with difficulties in the Euro-Zone and the threat of trade stresses under a second Trump Presidency, will undermine the Euro and support GBP/EUR.
MUFG commented; “With yields in the UK set to remain at relatively higher levels at least until early next year, the pound is set to remain attractive as a G10 carry currency.”
During the week, GBP/EUR strengthened to a November high close to 1.2040.
Rabobank commented; “GBP has found support in recent sessions in part due to market expectations that the pace of BoE rate cuts will be slower through 2025 than they would have been without the budget changes.”
The Bank of England cut interest rates by 25 basis points to 4.75% at the latest policy meeting which was in line with consensus forecasts.
There was an 8-1 vote for the decision with Mann dissenting and calling for no change.
The bank’s guidance was relatively cautious with Governor Bailey reiterating that rates should not decline too far or too quickly.
The bank also stated some reservations over the impact of the budget of inflation which could deter the BoE from cutting rates aggressively in 2025.
According to Danske Bank; “Overall, we think the communication today supports our call of a more gradual approach to the cutting cycle. We expect the next 25bp cut in February with the Bank Rate ending the year at 4.75% in 2024 and 3.25% in 2025.”
It added; “The guidance delivered yesterday highlights the more cautious approach of the BoE, which supports our case of a continued move lower in EUR/GBP. This is further amplified by UK economic outperformance and tight credit spreads.”
ING has shifted its near-term stance; “A December rate cut, we think, now looks unlikely. Previously we’d thought that the Bank would accelerate its cutting cycle beyond today, but uncertainty surrounding the budget’s impact has changed our mind on that.”
The bank still thinks that rate cuts will accelerate if there is a sustained decline in services-sector inflation.
It added; “Our view is that rate cuts will be cut at every meeting from February until rates reach 3.25% next autumn.”
The German coalition government collapsed during the week. The SPD and Green Party will continue as a minority administration in the short term with elections likely in the first quarter of 2025.
According to Rabobank; “Another fact that could keep EUR/GBP bias lower through 2025 is that Germany and France have plenty of issues of their own.”
Expectations of a policy shift could underpin the Euro in the medium term.
Deutsche Bank head of forex research George Saravelos commented; “The impact would run via the potential confidence effect boosts of a more stable government, and more importantly the direct economic effects of a potentially more pro-active fiscal stance.”
International Money Transfer? Ask our resident FX expert a money transfer question or try John’s new, free, no-obligation personal service! ,where he helps every step of the way,
ensuring you get the best exchange rates on your currency requirements.
The GBP/USD weekly forecast points south amid a drop in BoE rate cut expectations and a stronger dollar after Trump’s win.
After a volatile week, the pound ended on a bearish candle as market participants absorbed the US election results. After weeks of uncertainty, Republican candidate Donald Trump won the election. The win was bullish for the greenback because of the expectation of higher tariffs and tax cuts during Trump’s presidency.
–Are you interested to learn more about low spread forex brokers? Check our detailed guide-
Meanwhile, the Bank of England cut interest rates by 25-bps as expected. However, the pound rallied as policymakers noted that the new budget would likely increase inflation more than earlier expected. As a result, traders reduced the expected rate cuts in 2025 from four to three or two.
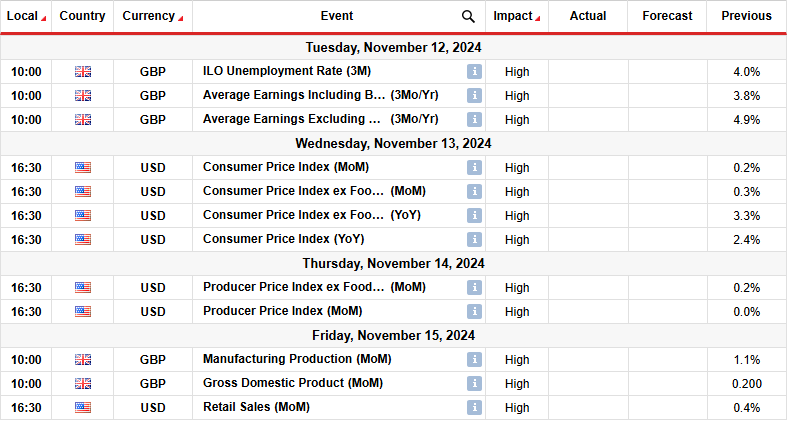
Next week, the UK will release crucial employment figures shaping the outlook for Bank of England rate cuts. Already, economists do not expect another BoE rate cut this year. Robust employment figures will likely push back the timing of the next rate cut.
At the same time, traders will focus on data on manufacturing production and gross domestic product that will show the state of the UK economy. Recent data has demonstrated better-than-expected economic performance, which has lowered the expected rate cuts.
Meanwhile, the US will release consumer and wholesale inflation data that will determine the Fed’s future policy moves. If inflation is higher than forecast, the US central bank might hesitate to cut in December. On the other hand, rate cut expectations will surge on cooler-than-expected figures.
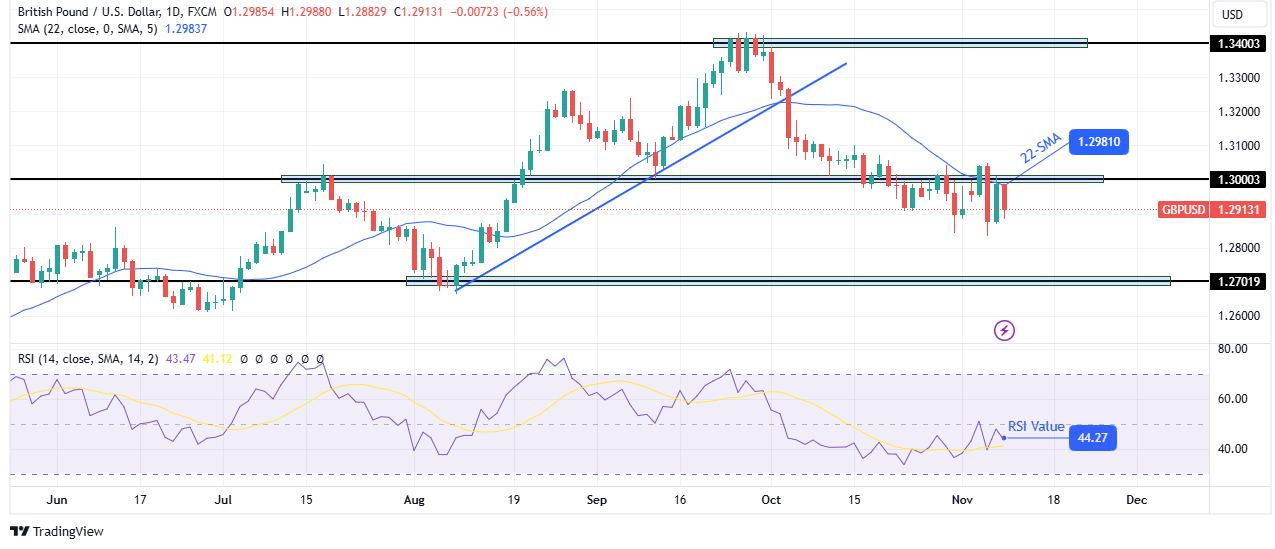
On the technical side, the GBP/USD price has collapsed further to make a new low below the 1.3000 key psychological level. At the same time, the price trades below the 22-SMA with the RSI in the bearish region below 50.
–Are you interested in learning more about AI trading brokers? Check our detailed guide-
After bulls paused at the 1.3400 resistance, bearish momentum surged, prompting the price to break below its support trendline and the 22-SMA. Therefore, control shifted from bulls to bears and has remained that way. At some point, bulls challenged the SMA and the 1.3000 but were not strong enough to take charge. Consequently, the coming week might see GBP/USD reaching the 1.2701.
Looking to trade forex now? Invest at eToro!
67% of retail investor accounts lose money when trading CFDs with this provider. You should consider whether you can afford to take the high risk of losing your money.
The Australian dollar has fallen pretty significantly, and again, this is not a huge surprise, mainly due to the fact that we’re still very sideways overall. At this point, the market looks as if the 0.67 level above is a significant resistance barrier, and underneath the market right now, we have the 0.65 level that offers support, as well as the 0.6550 level.
In other words, I think we continue to see a lot of back and forth, and with that being said, I don’t really think much has changed, quite frankly, and now we’re just looking for hard economic data to start moving on again. In the meantime, if you’re a short-term range-bound trader, you’ve got a couple of levels to pay close attention to. With that being said, it’s a market that is likely still just sitting around and waiting to see whether or not it becomes more risk on, or if it becomes more risk averse.