The main category of Forex News.
You can use the search box below to find what you need.
[wd_asp id=1]
The main category of Forex News.
You can use the search box below to find what you need.
[wd_asp id=1]
Silver retreated from two-day highs of $32.00 and tumbled below the 50-day Simple Moving Average (SMA) at $31.37 late in the North American session. This was weighed down by a strong US Dollar underpinned by former President Donald Trump’s victory. At the time of writing, the XAG/USD trades at $31.29, down 2.29%.
Silver’s price uptrend remains in play despite posting solid losses. The fall of US Treasury yields kept the grey metal from falling further, but a decisive break below the November 6 low of $30.84 could exacerbate a deeper pullback. In that outcome, the next support would be the 100-day SMA at $30.27, followed by the September 5 high turned support at $29.17.
For a bullish resumption, the XAG/USD must close above the $31.50 area. This could pave the way to challenge the July 11 high at $31.75. A breach of the latter will expose $32.00, followed by May’s 20 peak at $32.51.
Momentum is bearish in the near term, as shown by the Relative Strength Index (RSI), breaching its neutral line into the seller’s area.
Silver is a precious metal highly traded among investors. It has been historically used as a store of value and a medium of exchange. Although less popular than Gold, traders may turn to Silver to diversify their investment portfolio, for its intrinsic value or as a potential hedge during high-inflation periods. Investors can buy physical Silver, in coins or in bars, or trade it through vehicles such as Exchange Traded Funds, which track its price on international markets.
Silver prices can move due to a wide range of factors. Geopolitical instability or fears of a deep recession can make Silver price escalate due to its safe-haven status, although to a lesser extent than Gold’s. As a yieldless asset, Silver tends to rise with lower interest rates. Its moves also depend on how the US Dollar (USD) behaves as the asset is priced in dollars (XAG/USD). A strong Dollar tends to keep the price of Silver at bay, whereas a weaker Dollar is likely to propel prices up. Other factors such as investment demand, mining supply – Silver is much more abundant than Gold – and recycling rates can also affect prices.
Silver is widely used in industry, particularly in sectors such as electronics or solar energy, as it has one of the highest electric conductivity of all metals – more than Copper and Gold. A surge in demand can increase prices, while a decline tends to lower them. Dynamics in the US, Chinese and Indian economies can also contribute to price swings: for the US and particularly China, their big industrial sectors use Silver in various processes; in India, consumers’ demand for the precious metal for jewellery also plays a key role in setting prices.
Silver prices tend to follow Gold’s moves. When Gold prices rise, Silver typically follows suit, as their status as safe-haven assets is similar. The Gold/Silver ratio, which shows the number of ounces of Silver needed to equal the value of one ounce of Gold, may help to determine the relative valuation between both metals. Some investors may consider a high ratio as an indicator that Silver is undervalued, or Gold is overvalued. On the contrary, a low ratio might suggest that Gold is undervalued relative to Silver.
Near-term potential support is around 2.58 to 2.55, consisting of a prior interim high and the 20-Day MA, respectively. Also, a weekly low is at 2.51 along with the 50-Day MA at 2.53. So, in summary there is a potential support zone from 2.58 to 2.51, while a drop below this week’s low could lead to an even deeper pullback.
This week will end with an inside week for natural gas. Therefore, a potential weekly bullish breakout will be set up for next week. A rise above the week’s high of 2.82 will signal the breakout, while a drop through the low of 2.51 may lead to a deeper retracement.
Given the price structure for natural gas, the expectation is for an eventual upside breakout. One reason is that last week triggered a bullish weekly reversal from a retracement low. But this doesn’t mean the lower price won’t be tested before a bullish breakout. Nonetheless, the market will signal based on its reaction to price levels.
Earlier signs of strength will first be indicated on a rise above today’s high of 2.75, and then each daily high for this week starting with Tuesday. Notice that there are four days in a row where the high price for the day was lower than the prior day. Nevertheless, a breakout above the weekly high, or swing high of the daily chart, will provide a more convincing bullish signal, that may subsequently lead to an upside breakout from a large symmetrical triangle pattern.
For a look at all of today’s economic events, check out our economic calendar.
The Pound Sterling (GBP) staged a comeback versus the US Dollar (USD), lifting the GBP/USD pair from the lowest level in three months near 1.2835.
GBP/USD returned to positive territory for the first time in five weeks, as the global market optimism and the central banks’ policy announcements overshadowed the resurgent demand for the US Dollar.
The Pound Sterling built on its recovery momentum in the early part of the week, as risk flows prevailed on hopes of Republican candidate Donald Trump’s victory in the US presidential race due on Tuesday. Additionally, profit-taking on the USD long positions ahead of the US election also helped the British Pound gain some positive traction, driving the pair back above the 1.3000 level.
However, sellers quickly returned on Wednesday after Trump decisively won the US presidential race and triggered a massive upswing in the US Dollar against its major rivals. Even though risk traders returned, the USD gains outweighed and smashed GBP/USD to the three-month lows of 1.2834, nearly 150 pips down on that day.
Pound Sterling fought back control on Thursday in the lead-up to the BoE and US Federal Reserve (Fed) interest rate decisions, as the traders resorted to position readjustments in the lead-up to the central banks’ event risk.
Buyers received a fresh boost after the BoE reduced the benchmark policy rate by 25 basis points (bps) to 4.75% from 5.0%, as expected but the Monetary Policy Committee (MPC) voted 8-1 in favor of a cut against expectations of a 7-2 voting composition. Further, Governor Andrew Bailey maintained a cautious stance on the future interest rate outlook in the post-policy meeting press conference.
Bailey noted, “we need to make sure inflation stays close to target, so we can’t cut interest rates too quickly or by too much.” He added that “we will need to see more on how the budget affects inflation. I do not think it is right to conclude that the path of interest rates will be very different due to budget.”
Later in the American session on Thursday, the US central bank cut the fed funds rate by 25 bps to a range of 4.50% to 4.75%, as fully priced in. The Greenback bounced slightly in a knee-jerk reaction to the Fed’s rate decision, which was quickly reversed on Chairman Powell’s press conference. Powell noted that the Fed remains on a gradual easing path and that the election won’t have any near-term effect on the policy decision. He further added that he will not quit even if asked by Trump.
In the Fed’s aftermath, the US Dollar resumed its corrective decline, allowing the major to retest the 1.3000 level. On Friday, the pair consolidated the weekly gains, as the Greenback paused its downside momentum, supported by the cautious market mood heading into the weekend.
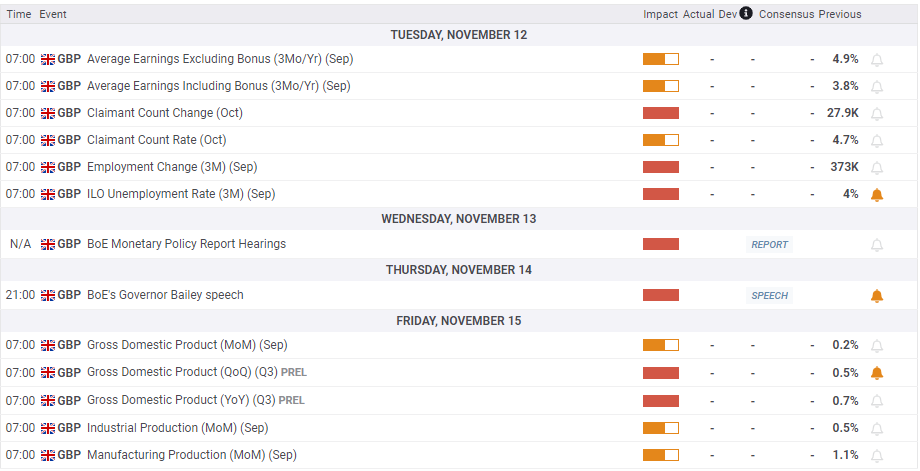
With the central banks’ bonanza week out of the way, the top-tier economic data releases from both sides of the Atlantic grab attention.
It’s a holiday-shortened week though, as US markets are closed on Monday in observance of Veterans Day. On Tuesday, the labor market data from the UK will stand out amid a data-quiet US calendar. However, speeches from several Fed policymakers will keep traders entertained in American trading that day.
Wednesday will feature the all-important US Consumer Price Index (CPI) data, which will be followed by more Fedspeak.
The preliminary and the monthly Gross Domestic Product (GDP) readings from the UK will be in the spotlight on Thursday. Meanwhile, the US Producer Price Index (PPI) will be published alongside the weekly Jobless Claims data later that day.
Fed Chair Jerome Powell’s appearance in a panel discussion, titled “Global Perspectives” at an event hosted by the Federal Reserve Bank of Dallas, will be also eagerly awaited.
The UK and US Retail Sales data will fill in an otherwise light economic calendar on Friday.
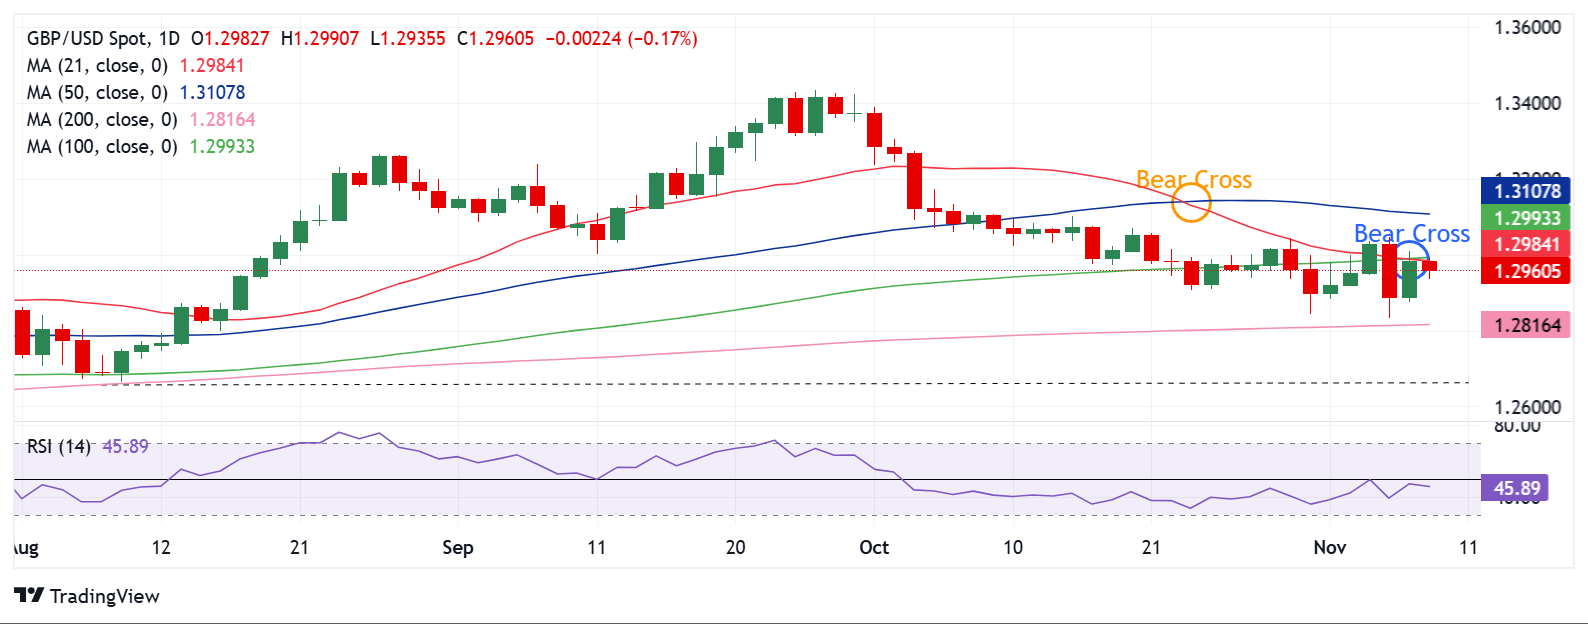
The daily technical setup for the GBP/USD pair indicates that sellers are not yet ready to give up, despite the recovery attempt.
The 200-day Simple Moving Average (SMA) at 1.2816 continued to guard the downside but the double Bear Crosses and a bearish 14-day Relative Strength Index (RSI) remained a looming threat for buyers heading into a new week. The RSI indicator holds slightly below the 50 level.
The 21-day SMA crossed the 50-day SMA from above on a daily closing basis on October 23, Meanwhile, the 21-day SMA and 100-day SMA bearish crossover occurred on Thursday, adding credence to the downside potential.
Therefore, a daily candlestick closing below the 200-day SMA at 1.2816 is critical to initiating a fresh downtrend for the Pound Sterling.
The next bearish target is seen at the 1.2750 psychological barrier, below which a test of the August 8 low of 1.2665 cannot be ruled out.
On the flip side, a sustained recovery is possible only on a firm break above the confluence of the 21-day SMA and the 100-day SMA near the 1.2990 region.
Silver price (XAG/USD) resumes its downside move after its recovery move met resistance near $32.20 in the North American session on Friday. The white metal falls back as traders assess the implications of Donald Trump’s victory in the United States (US) presidential elections on domestic and the global economy.
Donald Trump promised to raise tariffs by 10% universally, expecting China that could face duties rising as much as 60%. Higher tariffs on offering coming from the external economy would boost in house production and prompt labor demand, which will prompt inflationary pressures. This will force the Federal Reserve (Fed) to opt for a hawkish interest rate stance.
However, Fed Chair Jerome Powell doesn’t see any immediate impact of Trump’s victory on the monetary policy action in the upcoming meetings after the bank cut interest rates by 25 basis points (bps) to 4.50%-4.75% on Thursday.
Meanwhile, some recovery in the US Dollar after Thursday’s correction has also weighed on the Silver price. The US Dollar Index (DXY), which gauges Greenback’s value against six major currencies, jumps to nearly 106.40.
Apart from expectations for the Fed turning hawkish, an absence of meaningful economic stimulus by China has also weighed on the Silver price. In Friday’s late Asian session, China announced a massive 10 trillion yuan program to refinance local government debt with approval by the National People’s Congress. Market experts see the stimulus package as a measure against Trump’s potential tariffs, however, they consider it as insufficient to fix the likely impact on their economic growth.
Economists at Standard Chartered Plc expect “China’s growth would suffer a hit of as much as two percentage points should Trump follow through on his campaign vow to raise tariffs on Chinese goods to 60%.”
Silver as a metal has applications in various industries such as solar energy, mining, and power and signs of weak China growth prospects impact the Silver price.
Silver price slides to near $31.00 after breaking below the horizontal support plotted from the May 21 high of $32.50. The near-term trend of the Silver price has turned bearish as it has dropped below the 50-day Exponential Moving Average (EMA), which trades around $31.60.
The asset could find support near the upward-sloping trendline around $29.00, plotted from the February 28 low of $22.30.
The 14-day Relative Strength Index (RSI) dives to near 40.00. Should RSI (14) falls below 40.00, a bearish momentum will be triggered.
Silver is a precious metal highly traded among investors. It has been historically used as a store of value and a medium of exchange. Although less popular than Gold, traders may turn to Silver to diversify their investment portfolio, for its intrinsic value or as a potential hedge during high-inflation periods. Investors can buy physical Silver, in coins or in bars, or trade it through vehicles such as Exchange Traded Funds, which track its price on international markets.
Silver prices can move due to a wide range of factors. Geopolitical instability or fears of a deep recession can make Silver price escalate due to its safe-haven status, although to a lesser extent than Gold’s. As a yieldless asset, Silver tends to rise with lower interest rates. Its moves also depend on how the US Dollar (USD) behaves as the asset is priced in dollars (XAG/USD). A strong Dollar tends to keep the price of Silver at bay, whereas a weaker Dollar is likely to propel prices up. Other factors such as investment demand, mining supply – Silver is much more abundant than Gold – and recycling rates can also affect prices.
Silver is widely used in industry, particularly in sectors such as electronics or solar energy, as it has one of the highest electric conductivity of all metals – more than Copper and Gold. A surge in demand can increase prices, while a decline tends to lower them. Dynamics in the US, Chinese and Indian economies can also contribute to price swings: for the US and particularly China, their big industrial sectors use Silver in various processes; in India, consumers’ demand for the precious metal for jewellery also plays a key role in setting prices.
Silver prices tend to follow Gold’s moves. When Gold prices rise, Silver typically follows suit, as their status as safe-haven assets is similar. The Gold/Silver ratio, which shows the number of ounces of Silver needed to equal the value of one ounce of Gold, may help to determine the relative valuation between both metals. Some investors may consider a high ratio as an indicator that Silver is undervalued, or Gold is overvalued. On the contrary, a low ratio might suggest that Gold is undervalued relative to Silver.
Silver (XAG/USD) meets with a fresh supply on Friday and reverses a major part of the previous day’s goodish recovery move from over a three-week low. The white metal continues losing ground through the first half of the European session and touches a fresh daily low, around the $31.30 area in the last hour.
From a technical perspective, any further decline is likely to find some support near the $31.00 mark ahead of the $30.85-$30.80 region, or the multi-week low. Some follow-through selling below the 50% Fibonacci retracement level of the August-October rally, around the $30.65-$30.60 area, will be seen as a fresh trigger for bearish traders.
Given that oscillators on the daily chart have just started gaining negative traction, the subsequent fall could drag the XAG/USD below the 100-day Simple Moving Average (SMA), currently pegged around the $30.25 area, towards the $30.00 psychological mark. The downward trajectory could extend to the 61.8% Fibo. level, near the $29.65 region.
On the flip side, the $32.00 round figure now seems to have emerged as an immediate strong hurdle. This is followed by a hurdle near the $32.30-$32.35 horizontal zone, which if cleared decisively might trigger a short-covering move to the $33.00 mark before the XAG/USD extends the positive momentum towards the next relevant barrier near the mid-$33.00s.
Silver is a precious metal highly traded among investors. It has been historically used as a store of value and a medium of exchange. Although less popular than Gold, traders may turn to Silver to diversify their investment portfolio, for its intrinsic value or as a potential hedge during high-inflation periods. Investors can buy physical Silver, in coins or in bars, or trade it through vehicles such as Exchange Traded Funds, which track its price on international markets.
Silver prices can move due to a wide range of factors. Geopolitical instability or fears of a deep recession can make Silver price escalate due to its safe-haven status, although to a lesser extent than Gold’s. As a yieldless asset, Silver tends to rise with lower interest rates. Its moves also depend on how the US Dollar (USD) behaves as the asset is priced in dollars (XAG/USD). A strong Dollar tends to keep the price of Silver at bay, whereas a weaker Dollar is likely to propel prices up. Other factors such as investment demand, mining supply – Silver is much more abundant than Gold – and recycling rates can also affect prices.
Silver is widely used in industry, particularly in sectors such as electronics or solar energy, as it has one of the highest electric conductivity of all metals – more than Copper and Gold. A surge in demand can increase prices, while a decline tends to lower them. Dynamics in the US, Chinese and Indian economies can also contribute to price swings: for the US and particularly China, their big industrial sectors use Silver in various processes; in India, consumers’ demand for the precious metal for jewellery also plays a key role in setting prices.
Silver prices tend to follow Gold’s moves. When Gold prices rise, Silver typically follows suit, as their status as safe-haven assets is similar. The Gold/Silver ratio, which shows the number of ounces of Silver needed to equal the value of one ounce of Gold, may help to determine the relative valuation between both metals. Some investors may consider a high ratio as an indicator that Silver is undervalued, or Gold is overvalued. On the contrary, a low ratio might suggest that Gold is undervalued relative to Silver.
Following Wednesday’s sharp decline, EUR/USD gained traction and rose nearly 0.7% on Thursday. The pair, however, struggles to keep its footing and trades below 1.0800 in the European morning on Friday.
After outperforming its rivals with the initial reaction to the Donald Trump’s victory in the presidential election on Wednesday, the US Dollar (USD) lost its strength as investors booked profits ahead of the Federal Reserve’s (Fed) monetary policy announcements.
The table below shows the percentage change of US Dollar (USD) against listed major currencies this week. US Dollar was the strongest against the Swiss Franc.
| USD | EUR | GBP | JPY | CAD | AUD | NZD | CHF | |
|---|---|---|---|---|---|---|---|---|
| USD | 0.51% | -0.38% | 0.40% | -0.27% | -1.39% | -0.45% | 0.64% | |
| EUR | -0.51% | -0.92% | -0.53% | -1.16% | -1.58% | -1.34% | -0.27% | |
| GBP | 0.38% | 0.92% | 0.12% | -0.24% | -0.67% | -0.42% | 0.66% | |
| JPY | -0.40% | 0.53% | -0.12% | -0.66% | -1.23% | -0.63% | 0.55% | |
| CAD | 0.27% | 1.16% | 0.24% | 0.66% | -0.92% | -0.21% | 0.90% | |
| AUD | 1.39% | 1.58% | 0.67% | 1.23% | 0.92% | 0.25% | 1.33% | |
| NZD | 0.45% | 1.34% | 0.42% | 0.63% | 0.21% | -0.25% | 1.09% | |
| CHF | -0.64% | 0.27% | -0.66% | -0.55% | -0.90% | -1.33% | -1.09% |
The heat map shows percentage changes of major currencies against each other. The base currency is picked from the left column, while the quote currency is picked from the top row. For example, if you pick the US Dollar from the left column and move along the horizontal line to the Japanese Yen, the percentage change displayed in the box will represent USD (base)/JPY (quote).
The Fed lowered the policy rate by 25 basis points to the range of 4.5%-4.75% following the November policy meeting, as anticipated. In its policy statement, the US central bank repeated that risks to the job market and inflation were “roughly in balance.” In the post-meeting press conference, Fed Chairman Jerome Powell refrained from hinting whether they will ease the policy further in December and explained that the results of the presidential election will have no effect on the monetary policy in the near term.
The market reaction to the Fed event remained largely muted. According to the CME FedWatch Tool, the probability of a 25 bps rate cut in December remains largely unchanged at about 70%. Early Friday, the cautious market mood helps the USD hold its ground and doesn’t allow EUR/USD to extend its rebound.
The University of Michigan’s (UoM) preliminary Consumer Sentiment Index for November will be featured in the US economic docket. In the meantime, US stock index futures were last seen trading virtually unchanged on the day. In case markets remain cautious following Wall Street’s opening bell, the USD could stay resilient against its peers and limit EUR/USD’s upside.
The Relative Strength Index (RSI) indicator on the 4-hour chart stays below 50, suggesting that the bearish bias remains intact following Thursday’s correction.
On the downside, static support is located at 1.0750 ahead of 1.0700 (static level, round level) and 1.0680 (static level). Looking north, initial resistance aligns at 1.0800 (static level, round level) before 1.0870 (200-day Simple Moving Average).
The Euro is the currency for the 19 European Union countries that belong to the Eurozone. It is the second most heavily traded currency in the world behind the US Dollar. In 2022, it accounted for 31% of all foreign exchange transactions, with an average daily turnover of over $2.2 trillion a day. EUR/USD is the most heavily traded currency pair in the world, accounting for an estimated 30% off all transactions, followed by EUR/JPY (4%), EUR/GBP (3%) and EUR/AUD (2%).
The European Central Bank (ECB) in Frankfurt, Germany, is the reserve bank for the Eurozone. The ECB sets interest rates and manages monetary policy. The ECB’s primary mandate is to maintain price stability, which means either controlling inflation or stimulating growth. Its primary tool is the raising or lowering of interest rates. Relatively high interest rates – or the expectation of higher rates – will usually benefit the Euro and vice versa. The ECB Governing Council makes monetary policy decisions at meetings held eight times a year. Decisions are made by heads of the Eurozone national banks and six permanent members, including the President of the ECB, Christine Lagarde.
Eurozone inflation data, measured by the Harmonized Index of Consumer Prices (HICP), is an important econometric for the Euro. If inflation rises more than expected, especially if above the ECB’s 2% target, it obliges the ECB to raise interest rates to bring it back under control. Relatively high interest rates compared to its counterparts will usually benefit the Euro, as it makes the region more attractive as a place for global investors to park their money.
Data releases gauge the health of the economy and can impact on the Euro. Indicators such as GDP, Manufacturing and Services PMIs, employment, and consumer sentiment surveys can all influence the direction of the single currency. A strong economy is good for the Euro. Not only does it attract more foreign investment but it may encourage the ECB to put up interest rates, which will directly strengthen the Euro. Otherwise, if economic data is weak, the Euro is likely to fall. Economic data for the four largest economies in the euro area (Germany, France, Italy and Spain) are especially significant, as they account for 75% of the Eurozone’s economy.
Another significant data release for the Euro is the Trade Balance. This indicator measures the difference between what a country earns from its exports and what it spends on imports over a given period. If a country produces highly sought after exports then its currency will gain in value purely from the extra demand created from foreign buyers seeking to purchase these goods. Therefore, a positive net Trade Balance strengthens a currency and vice versa for a negative balance.
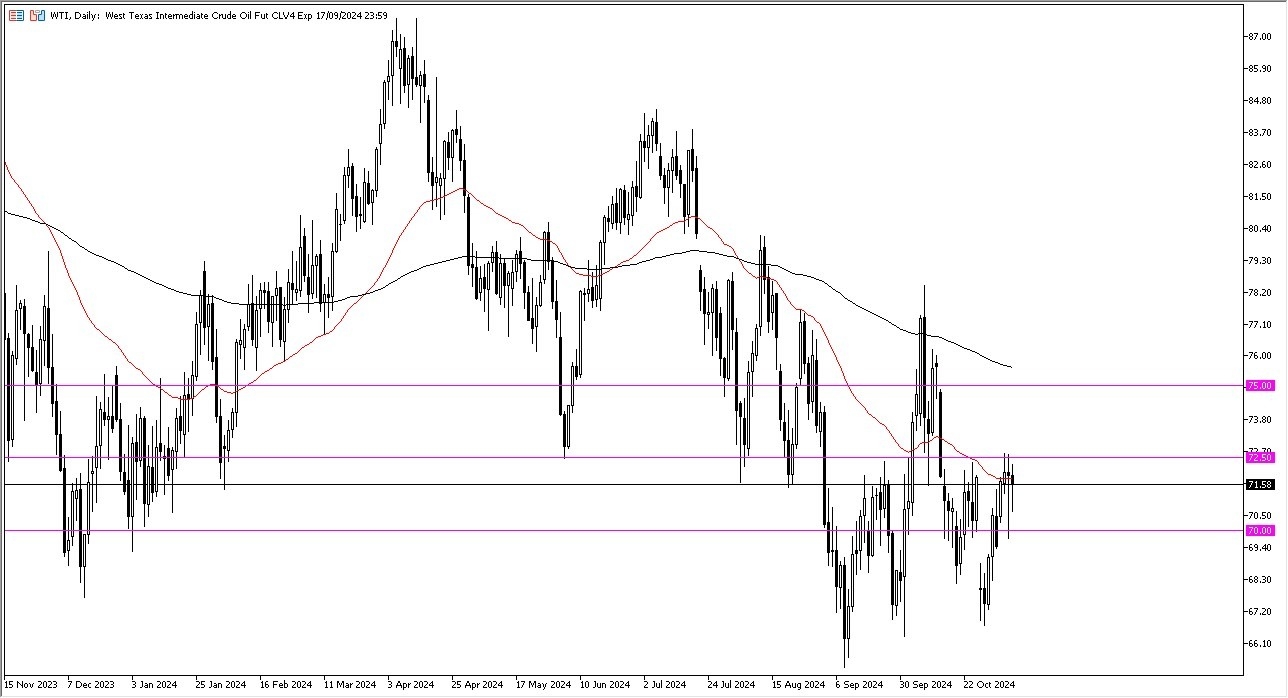
If we can break above that, then I think it opens up the possibility of a move toward the 200-day EMA, which is attractive to a lot of traders. And that happens to be near the crucial $75 region. If we pull back from here, the $70 level could be a major support level as we’ve seen a couple of times here recently, but even if we break down below that, then you’re looking at $67.50 level as a potential floor as well.

In general, this is a market that I think continues to see a lot of choppiness and indecision, and there are a lot of things going on to cause that. After all, we have seen the $65 level underneath is a massive floor in the market over the last couple of years.
Regardless, this is a situation where the United States will be a major influence on the oil market going forward now that Donald Trump has been elected. One of his biggest platforms is to continue to drill and make not only the United States, energy independent, but energy dominant. For example, there are places in United States territory such as the Anwar, which is a preserve in Alaska, but if they tap that, it has more oil than Saudi Arabia. There is a high probability that the Americans will start drilling in places like that again, and if they do, it will put a bit of a ceiling on the market. That being said, that is several months out, maybe even a couple of years, but that will be an overhang in the market. So, I think we go sideways, possibly as high as the 200 day EMA, but breaking above there, I think is going to take some type of event. We’ll have to wait and see.
Ready to trade crude oil daily analysis and predictions? Here are the best Oil trading brokers to choose from.
GBP/USD gathered bullish momentum on Thursday and erased a large portion of Wednesday’s losses. The pair, however, lost its traction after failing to stabilize above 1.3000 and was last seen trading in negative territory near 1.2950.
The table below shows the percentage change of British Pound (GBP) against listed major currencies this week. British Pound was the strongest against the Euro.
| USD | EUR | GBP | JPY | CAD | AUD | NZD | CHF | |
|---|---|---|---|---|---|---|---|---|
| USD | 0.45% | -0.33% | 0.18% | -0.28% | -1.32% | -0.37% | 0.57% | |
| EUR | -0.45% | -0.81% | -0.69% | -1.12% | -1.46% | -1.22% | -0.28% | |
| GBP | 0.33% | 0.81% | -0.14% | -0.31% | -0.65% | -0.40% | 0.53% | |
| JPY | -0.18% | 0.69% | 0.14% | -0.45% | -0.95% | -0.34% | 0.70% | |
| CAD | 0.28% | 1.12% | 0.31% | 0.45% | -0.84% | -0.10% | 0.85% | |
| AUD | 1.32% | 1.46% | 0.65% | 0.95% | 0.84% | 0.24% | 1.19% | |
| NZD | 0.37% | 1.22% | 0.40% | 0.34% | 0.10% | -0.24% | 0.94% | |
| CHF | -0.57% | 0.28% | -0.53% | -0.70% | -0.85% | -1.19% | -0.94% |
The heat map shows percentage changes of major currencies against each other. The base currency is picked from the left column, while the quote currency is picked from the top row. For example, if you pick the British Pound from the left column and move along the horizontal line to the US Dollar, the percentage change displayed in the box will represent GBP (base)/USD (quote).
The Bank of England (BoE) said on Thursday that it cut the bank rate by 25 basis points (bps) to 4.75%, with eight policymakers voting in favor of the decision, against Catherine Mann, who voted to leave the policy rate unchanged at 5%. This decision came in line with the market expectation.
In its policy statement, the BoE announced that it revised its forecast for the Consumer Price Index inflation in one year’s time to 2.7% from 2.4% in August’s projections, adding that the new budget is provisionally expected to boost inflation by just under 0.5 percentage points at peak between mid 2026 and early 2027. The revision to inflation projections helped Pound Sterling stay resilient against the US Dollar (USD).
In the second half of the day, the Federal Reserve (Fed) lowered the policy rate by 25 bps to the range of 4.5%-4.75%. The US central bank repeated in the policy statement that risks to the job market and inflation were “roughly in balance.” In the post-meeting press conference, Fed Chairman Jerome Powell refrained from hinting whether they will opt for another rate cut in December. When asked about Donald Trump’s victory in the presidential election, Powell explained that the results of the election will not have an effect on the monetary policy in the near term. GBP/USD retreated slightly from the session highs after the event but still ended the day with a gain of more than 0.8%.
Early Friday, the cautious market stance makes it difficult for GBP/USD to build on Thursday’s gains. At the time of press, US stock index futures were trading mixed. If risk flows return ahead of the weekend, the USD could have a hard time finding demand and open the door for an extended rebound in GBP/USD.
The Relative Strength Index (RSI) indicator on the 4-hour chart stays slightly above 50, reflecting sellers’ hesitancy. On the upside, the 100-day Simple Moving Average (SMA) forms a key resistance level at 1.3000. A weekly close above this level could attract technical buyers. In this scenario, 1.3050 (static level) could be the next hurdle before 1.3100 (50-day SMA).
Looking south, first support could be spotted at 1.2900 (static level) ahead of 1.2820 (200-day SMA).
Silver price (XAG/USD) loses ground to near $31.70 per troy ounce during the Asian hours on Friday. A modest rise in US Treasury yields is adding downward pressure on non-yielding assets like Silver, as higher yields increase the opportunity cost of holding precious metals. At the time of writing, the 2-year and 10-year US Treasury bond yields stand at 4.20% and 4.33%, respectively.
Additionally, the demand for dollar-denominated Silver struggles, as a stronger US Dollar (USD) makes the precious metal more expensive for buyers using foreign currencies. The US Dollar Index (DXY), which measures the value of the US Dollar against the other six major currencies, advances to near 104.50 at the time of writing.
Traders expect potential stimulus measures from China as the National People’s Congress Standing Committee concluded its five-day meeting. Earlier this week, media reports suggested that the potential stimulus package could exceed 10 trillion yuan. As one of the world’s largest manufacturing hubs for electronics, solar panels, and automotive components, China may have increased demand for Silver.
However, prices of the non-interest-bearing Silver gained ground following the Federal Reserve’s recent rate cut. The Federal Open Market Committee (FOMC) lowered its benchmark overnight borrowing rate by 25 basis points (bps) to a target range of 4.50%-4.75% at its November meeting on Thursday.
Moreover, Federal Reserve Chair Jerome Powell indicated that the central bank is proceeding with interest rate cuts, given the ongoing tightness of monetary policy. Investors are now anticipating the release of the preliminary US Michigan Consumer Sentiment, which is expected later on Friday.
Silver is a precious metal highly traded among investors. It has been historically used as a store of value and a medium of exchange. Although less popular than Gold, traders may turn to Silver to diversify their investment portfolio, for its intrinsic value or as a potential hedge during high-inflation periods. Investors can buy physical Silver, in coins or in bars, or trade it through vehicles such as Exchange Traded Funds, which track its price on international markets.
Silver prices can move due to a wide range of factors. Geopolitical instability or fears of a deep recession can make Silver price escalate due to its safe-haven status, although to a lesser extent than Gold’s. As a yieldless asset, Silver tends to rise with lower interest rates. Its moves also depend on how the US Dollar (USD) behaves as the asset is priced in dollars (XAG/USD). A strong Dollar tends to keep the price of Silver at bay, whereas a weaker Dollar is likely to propel prices up. Other factors such as investment demand, mining supply – Silver is much more abundant than Gold – and recycling rates can also affect prices.
Silver is widely used in industry, particularly in sectors such as electronics or solar energy, as it has one of the highest electric conductivity of all metals – more than Copper and Gold. A surge in demand can increase prices, while a decline tends to lower them. Dynamics in the US, Chinese and Indian economies can also contribute to price swings: for the US and particularly China, their big industrial sectors use Silver in various processes; in India, consumers’ demand for the precious metal for jewellery also plays a key role in setting prices.
Silver prices tend to follow Gold’s moves. When Gold prices rise, Silver typically follows suit, as their status as safe-haven assets is similar. The Gold/Silver ratio, which shows the number of ounces of Silver needed to equal the value of one ounce of Gold, may help to determine the relative valuation between both metals. Some investors may consider a high ratio as an indicator that Silver is undervalued, or Gold is overvalued. On the contrary, a low ratio might suggest that Gold is undervalued relative to Silver.
Gold price has returned to the red early Thursday after reversing more than half of the Trump win-led 3% slide on Wednesday. Gold sellers fight back control, as the US Dollar (USD) finds its feet amid a pause in the US Treasury bond yields sell-off while awaiting the Michigan preliminary Consumer Sentiment data.
Gold is consolidating at around $2,700 in Asian trading on Friday, as investors catch a breather and take account of the volatile trading witnessed over the last two days.
Republican candidate Donald Trump’s second term as the US president, following an outstanding win in the election, spelt doom for the bright metal on Wednesday before being rescued by the US Federal Reserve (Fed) Chairman Jerome Powell after the two-day monetary policy meeting concluded on Thursday.
Markets digested the Trump presidency, believing that his policies on immigration, tax cuts and tariffs would put upward pressure on inflation, prompted a fresh run higher in the USD, US Treasury bond yields and global stocks at the expense of the yieldless Gold price on Wednesday.
On Thursday, Gold price jumped back on the bids, as traders took profits off their USD longs ahead of the Fed interest rate decision. The Gold price rebound extended into American trading after the Greenback witnessed a fresh leg down following the Fed policy announcements.
The USD attempted a bounce in a knee-jerk reaction to the Fed’s rate decision, which was quickly reversed on Chairman Powell’s press conference. Powell noted that the Fed remains on a gradual easing path and that the election won’t have any near-term effect on the policy decision. He added that he will not quit even if asked by Trump.
Powell’s commitment to the Fed’s easing cycle was enough to trigger a fresh sell-off in the US Dollar across the board, providing extra legs to the Gold price recovery.
The US central bank reduced the fed funds rate by 25 basis points (bps) to a range of 4.50% to 4.75%, as expected.
However, the Trump trades optimism remains well in place, as the Fed verdict is now out of the way, reviving the US Dollar’s bullish undertone while acting as a headwind for the Gold price.
The top-tier US consumer sentiment and inflation expectations data will also play its part in influencing the value of the USD and the Gold price in the session ahead, as traders may resort to positioning readjustments following a crucial week for markets while bracing for the US Consumer Price Index (CPI) data due next week.
The end-of-the-week flows could also infuse some volatility around the Gold price.
As observed on the daily chart, Gold price bounced off the important support at $2,641, which is the confluence of the 50-day Simple Moving Average (SMA) and the 78.6% Fibo level of the latest record rally from the October 10 low of $2,604 to the new all-time high of $2,790.
Defending that level triggered a fresh upswing, where buyers challenged the 21-day SMA, then at $2,712.
At the moment, Gold price remains stuck between the confluence resistance of the 21-day SMA and the 38.2% Fibo level at $2,718 while holding well above the aforesaid strong cushion at $2,641.
The 14-day Relative Strength Index (RSI) is flatlining at the 50 level, suggesting a lack of a clear directional bias for Gold price.
If the renewed weakness extends below the 50% Fibo support at $2,695, a fresh leg lower toward the 61.8% Fibo level of $2,673 will be in the offing.
Further down, the $2,641 confluence support will come into play once again.
On the flip side, Gold buyers need acceptance above the healthy resistance at $2,718 to initiate a fresh uptrend toward the previous static resistance near $2,745, where the 23.6% Fibo aligns.
The next relevant bullish target is seen at around the $2,760 round level en route to the record high of $2,790.
Gold has played a key role in human’s history as it has been widely used as a store of value and medium of exchange. Currently, apart from its shine and usage for jewelry, the precious metal is widely seen as a safe-haven asset, meaning that it is considered a good investment during turbulent times. Gold is also widely seen as a hedge against inflation and against depreciating currencies as it doesn’t rely on any specific issuer or government.
Central banks are the biggest Gold holders. In their aim to support their currencies in turbulent times, central banks tend to diversify their reserves and buy Gold to improve the perceived strength of the economy and the currency. High Gold reserves can be a source of trust for a country’s solvency. Central banks added 1,136 tonnes of Gold worth around $70 billion to their reserves in 2022, according to data from the World Gold Council. This is the highest yearly purchase since records began. Central banks from emerging economies such as China, India and Turkey are quickly increasing their Gold reserves.
Gold has an inverse correlation with the US Dollar and US Treasuries, which are both major reserve and safe-haven assets. When the Dollar depreciates, Gold tends to rise, enabling investors and central banks to diversify their assets in turbulent times. Gold is also inversely correlated with risk assets. A rally in the stock market tends to weaken Gold price, while sell-offs in riskier markets tend to favor the precious metal.
The price can move due to a wide range of factors. Geopolitical instability or fears of a deep recession can quickly make Gold price escalate due to its safe-haven status. As a yield-less asset, Gold tends to rise with lower interest rates, while higher cost of money usually weighs down on the yellow metal. Still, most moves depend on how the US Dollar (USD) behaves as the asset is priced in dollars (XAU/USD). A strong Dollar tends to keep the price of Gold controlled, whereas a weaker Dollar is likely to push Gold prices up.