The main category of Forex News.
You can use the search box below to find what you need.
[wd_asp id=1]
The main category of Forex News.
You can use the search box below to find what you need.
[wd_asp id=1]
The EUR/USD outlook shows a rebound in the euro after reaching new lows due to Wednesday’s Trump trade. Market participants paused the recent move ahead of the FOMC policy meeting, where the Fed will likely lower borrowing costs.
–Are you interested to learn more about forex options trading? Check our detailed guide-
The dollar had a strong bullish day on Wednesday after Trump won the election to become the US president again. The Trump trade resumed enthusiastically as markets looked forward to tax cuts and tariffs on imported goods. At the same time, a Trump presidency will likely complicate the Fed’s rate-cutting cycle. After the results, traders lowered the likelihood of a rate cut in December from 77% to 67%.
Meanwhile, market participants are preparing for a rate cut during the FOMC policy meeting later today. Although the US central bank will likely cut rates, it will be by a smaller size than traders had expected a few weeks ago. The Fed started its rate-cutting cycle with a super-sized rate cut, which increased expectations of another such move in November. However, economic resilience has changed this outlook.
Nevertheless, the latest jobs report revealed unexpected weakness in the labor market that might scare policymakers. Economists had expected slower job growth due to recent hurricanes. However, an addition of 12.000 jobs was far below estimates. A dovish tone during the meeting will increase the likelihood of a rate cut in December. On the other hand, if policymakers demonstrate caution, rate-cut bets will fall, further boosting the greenback.
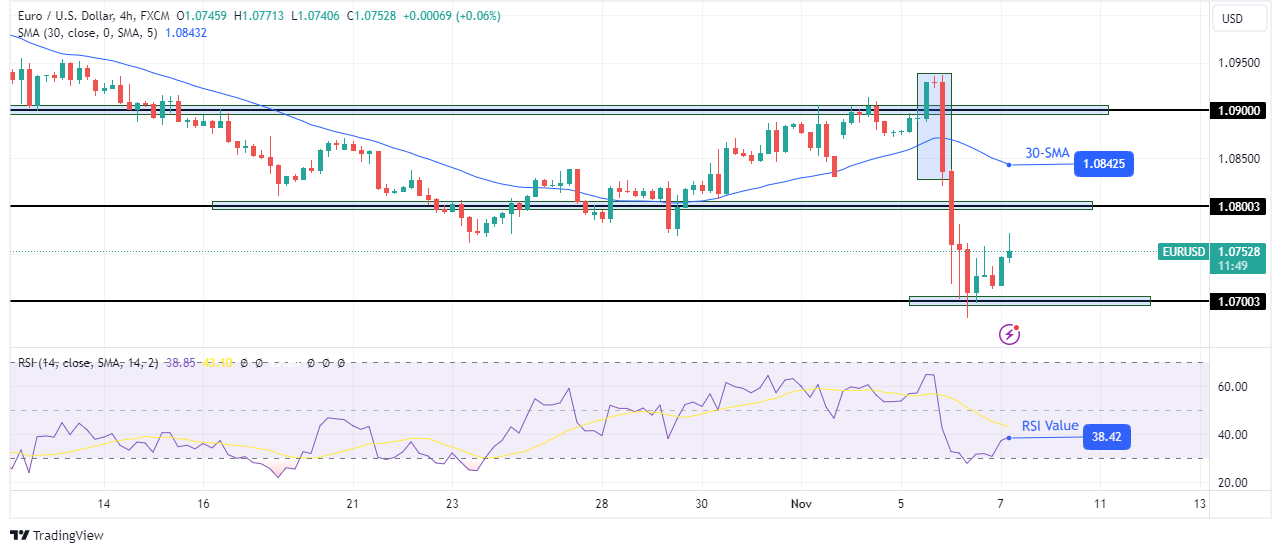
On the technical side, the EUR/USD price has paused its decline near the 1.0700 key psychological level. It trades far below the 30-SMA, showing bears are in the lead. At the same time, the RSI trades near the oversold region, suggesting strong bearish momentum.
–Are you interested to learn about forex robots? Check our detailed guide-
Initially, bulls had reversed the trend by breaching the 30-SMA and making higher highs and lows. However, they failed to sustain a move beyond the 1.0900 resistance. Here, bears took charge with the price making a strong evening star pattern that broke below the SMA. Given the solid bearish bias, the downtrend might soon resume with a break below 1.0700.
Looking to trade forex now? Invest at eToro!
67% of retail investor accounts lose money when trading CFDs with this provider. You should consider whether you can afford to take the high risk of losing your money.
Overall, the result has revived “Trump deals,” with expectations that the former US president’s plans to raise tariffs and cut corporate taxes could fuel inflation and keep interest rates high. Meanwhile, the Bank of England is expected to cut interest rates by a quarter of a percentage point on Thursday. However, investors now expect smaller rate cuts next year than expected before last week’s budget announcement. Meanwhile, the Office for Budget Responsibility recently raised its 2025 inflation forecast to an average of 2.6%, up from 1.5% forecast in March. This is closely in line with the Bank of England’s August forecast, which sees inflation at 2.4% in one year, 1.7% in two years and 1.5% in three years.
On another note, UK gilt yields, or government bond yields, a key tool in determining consumer borrowing rates such as mortgages, continue to rise as Donald Trump’s election victory provides fresh impetus. Analyst said, “Financial markets have been gripped by jitters following Donald Trump’s triumphant victory. His policies appear set to add to inflationary pressures and further widen the US deficit, with knock-on effects for the UK economy expected,”
According to reliable trading platforms, the yield (interest rate) offered by two-year UK government bonds rose to 4.51%, while the yield on ten-year bonds rose to 4.57%. added, “Government bonds often move in tandem with Treasury bonds and this special relationship is evident today, pushing up UK borrowing costs sharply.”

UK government bonds were already on edge, with sentiment worsening after concerns about the amount of borrowing the Labour administration was undertaking. “Now Trump’s victory has added to the pressure. Concerns about the inflationary impact of Trump’s promised new round of tariffs are seeping through markets. There are also concerns that his trade policies could hamper UK economic growth. Fears of an emerging stagflation scenario in some economies appear to be haunting markets again.”
By and large, the interest rates that consumers in the UK are exposed to are determined by bond yields as they form a basket of products such as swaps, which in turn influence mortgage rates, credit card rates and lending rates to businesses. US bond yields are rising as investors demand more compensation for holding US bonds, believing their value will fall due to inflation. Meanwhile, Rising yields therefore suggest that markets believe a second Trump term will be more inflationary than the alternative.
Faced with the prospect of higher inflation, economists now expect fewer rate cuts from the US Federal Reserve.
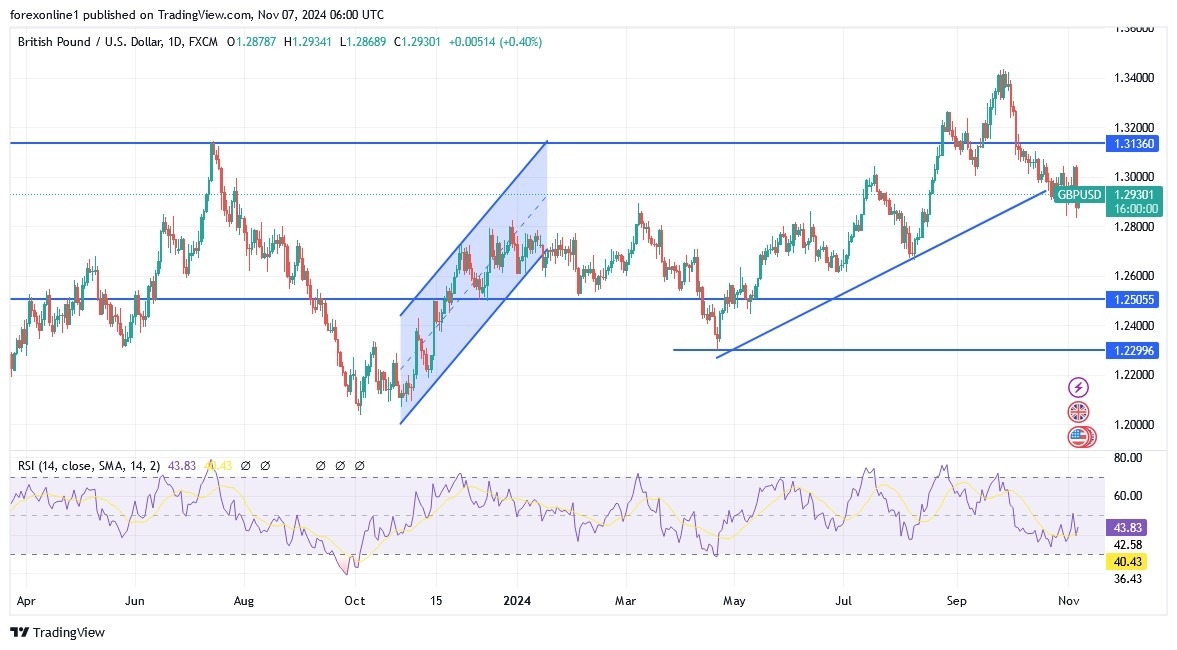
According to the technical outlook and performance on the daily chart attached, the general downward trend for the GBP/USD pair is getting stronger. As I mentioned before, stability below the 1.3000 level will strengthen the bears’ control, and the next most important support stations are 1.2880, 1.2800, and 1.2720, respectively. From the last level, the technical indicators will move towards strong oversold levels. On the other hand, and in the same time frame, there will be no initial break of the downward trend without moving above the 1.3150 resistance. Also, the GBP/USD pair will be affected today by the announcement of the Bank of England and the US Federal Reserve, in addition to the reaction to the results of the US presidential elections and Trump’s victory.
Ready to trade our GBP/USD Forex analysis? We’ve made this UK forex brokers list for you to check out.
The USD/JPY traded at a high early this morning not seen since the end of July, a collision of nervous sentiment and risk events has led to the bullish climb in the currency pair, today there is the Fed.
Yes, the USD/JPY touched the 139.700 level on the 16th of September, this as financial institutions bet on a more hawkish Bank of Japan and a more dovish U.S Federal Reserve. The lows seen in mid-September did reverse higher and by the end of September the price in the USD/JPY was around 141.700. Then global risk adverse trading began in earnest and USD centric strength took over, this morning high underscores the nervousness and risk events in Forex and for the USD/JPY. The currency pair has traded in a rather correlated manner along with other major pairs like the EUR/USD and GBP/USD.
The U.S President election delivered a demonstrative bit of evidence yesterday. The victory of Donald Trump opens the door to the potential of tough negotiations regarding trade agreements with many nations which will cause Forex prices to potentially become volatile. Fast trading in the USD/JPY will remain part of the landscape today.
Japan however for the moment appears to be in a rather calm spot regarding trade with the U.S, in other words for the time being it appears Japan will not grab the attention of Trump as he deals with other Asian nations like China for instance. Perhaps financial institutions will become more tranquil regarding the USD/JPY.
On top of the Trump consideration and his impact on policy, the U.S Federal Reserve will announce it FOMC Statement later today. The Fed is in a position to cut its interest rate today by at lease 0.25 basis points. U.S economic data last week via GDP and jobs numbers came in below estimates. While most have been worrying about the U.S election, the Fed will grab the spotlight today and their rhetoric will impact the USD/JPY. However, in the short-term may remain quite choppy as financial institutions readjust their outlooks. Yes, the USD/JPY does look overbought, but do not bet blindly on lower move.
While some traders expected a Trump victory, the scope of his victory opens the door for policy changes which could impact the USD and mid-term outlook.
Many of those impacts still need to be thought out. The USD/JPY does look overbought, but nervous sentiment may continue to keep the currency pair within its higher elements for a bit longer.
Those who want to try and sell may want to use resistance levels technically as a place to launch quick hitting attacks.
However the Fed later today will create a sea of volatility, because the Fed has a new U.S President to deal with too.
Current Resistance: 154.175
Current Support: 153.990
High Target: 154.340
Low Target: 152.800
Ready to trade our daily forex forecast? Here are Japan’s Best Forex Brokers to choose from.
Silver (XAG/USD) remains on the back foot through the first half of the European session on Thursday, albeit manages to hold above the $31.00 mark. The technical setup, however, seems tilted in favor of bearish traders and suggests that the path of least resistance for the white metal remains to the downside.
The overnight downfall and a subsequent weakness below the 50-day Simple Moving Average (SMA) confirmed a short-term ascending trend-channel breakdown. Furthermore, oscillators on the daily chart have been gaining negative traction and add credence to the near-term negative outlook for the XAG/USD. Any further decline, however, is likely to find decent support near the 100-day SMA, currently pegged near the $30.40-$30.35 region.
Some follow-through selling could drag the XAG/USD below the $30.00 psychological mark, toward testing the next relevant support near the $29.70 zone. The downward trajectory could extend further towards the $29.00 round figure en route to the very important 200-day SMA, currently pegged near the $28.50-$28.40 region.
On the flip side, the 50-day SMA support breakpoint, around the $31.35 area, now seems to act as an immediate hurdle. A sustained strength beyond could trigger a short-covering rally towards the $31.75 intermediate resistance, the $32.00 round figure and the $32.25-$32.30 supply zone. Any further move up is more likely to attract fresh sellers and remain capped near the ascending channel support breakpoint, around the $32.75 region.
Silver is a precious metal highly traded among investors. It has been historically used as a store of value and a medium of exchange. Although less popular than Gold, traders may turn to Silver to diversify their investment portfolio, for its intrinsic value or as a potential hedge during high-inflation periods. Investors can buy physical Silver, in coins or in bars, or trade it through vehicles such as Exchange Traded Funds, which track its price on international markets.
Silver prices can move due to a wide range of factors. Geopolitical instability or fears of a deep recession can make Silver price escalate due to its safe-haven status, although to a lesser extent than Gold’s. As a yieldless asset, Silver tends to rise with lower interest rates. Its moves also depend on how the US Dollar (USD) behaves as the asset is priced in dollars (XAG/USD). A strong Dollar tends to keep the price of Silver at bay, whereas a weaker Dollar is likely to propel prices up. Other factors such as investment demand, mining supply – Silver is much more abundant than Gold – and recycling rates can also affect prices.
Silver is widely used in industry, particularly in sectors such as electronics or solar energy, as it has one of the highest electric conductivity of all metals – more than Copper and Gold. A surge in demand can increase prices, while a decline tends to lower them. Dynamics in the US, Chinese and Indian economies can also contribute to price swings: for the US and particularly China, their big industrial sectors use Silver in various processes; in India, consumers’ demand for the precious metal for jewellery also plays a key role in setting prices.
Silver prices tend to follow Gold’s moves. When Gold prices rise, Silver typically follows suit, as their status as safe-haven assets is similar. The Gold/Silver ratio, which shows the number of ounces of Silver needed to equal the value of one ounce of Gold, may help to determine the relative valuation between both metals. Some investors may consider a high ratio as an indicator that Silver is undervalued, or Gold is overvalued. On the contrary, a low ratio might suggest that Gold is undervalued relative to Silver.
EUR/USD lost nearly 2% on Wednesday and touched its weakest level since late June below 1.0700. The pair stages a rebound early Thursday and trades above 1.0750 as market attention turns to the Federal Reserve’s (Fed) monetary policy announcements.
The table below shows the percentage change of Euro (EUR) against listed major currencies this week. Euro was the weakest against the Australian Dollar.
| USD | EUR | GBP | JPY | CAD | AUD | NZD | CHF | |
|---|---|---|---|---|---|---|---|---|
| USD | 0.71% | -0.11% | 1.12% | -0.28% | -1.01% | -0.22% | 0.82% | |
| EUR | -0.71% | -0.86% | -0.02% | -1.38% | -1.42% | -1.32% | -0.30% | |
| GBP | 0.11% | 0.86% | 0.58% | -0.53% | -0.56% | -0.46% | 0.57% | |
| JPY | -1.12% | 0.02% | -0.58% | -1.39% | -1.57% | -1.13% | -0.00% | |
| CAD | 0.28% | 1.38% | 0.53% | 1.39% | -0.52% | 0.05% | 1.10% | |
| AUD | 1.01% | 1.42% | 0.56% | 1.57% | 0.52% | 0.10% | 1.13% | |
| NZD | 0.22% | 1.32% | 0.46% | 1.13% | -0.05% | -0.10% | 1.03% | |
| CHF | -0.82% | 0.30% | -0.57% | 0.00% | -1.10% | -1.13% | -1.03% |
The heat map shows percentage changes of major currencies against each other. The base currency is picked from the left column, while the quote currency is picked from the top row. For example, if you pick the Euro from the left column and move along the horizontal line to the US Dollar, the percentage change displayed in the box will represent EUR (base)/USD (quote).
The US Dollar (USD) rallied on Wednesday as Donald Trump won the presidential election by a decisive margin. Republicans also took the majority in the Senate and remain on track to capture the House, currently holding 206 seats of 218 needed for majority, against Democrats’ 191. The USD Index, which tracks the USD’s performance against a basket of six major currencies, rose more than 1.5% to register its largest one-day gain of 2024.
Early Thursday, the USD Index retreats and was last seen losing nearly 0.4% on the day, possibly pressured by profit-taking.
The Fed is widely forecast to lower the policy rate by 25 basis points (bps) after the November policy meeting. Fed Chairman Jerome Powell will surely be asked about how Trump’s proposed policies, especially in regard to taxes and tariffs, could impact the policy moving forward. Powell is unlikely to respond to these questions and reiterate the data-dependent approach to policymaking.
In case Powell reaffirms that they are likely to lower the policy rate again at the last policy meeting of the year, the immediate market reaction could cause the USD to weaken further and help EUR/USD stretch higher. If Powell adopts a more cautious tone and voices concerns over the inflation outlook, the USD could hold its ground. According to the CME Group FedWatch Tool, markets are currently pricing in a nearly 30% probability of the Fed holding the policy rate steady in December, suggesting that the USD is likely to react more significantly to a hawkish Fed tone than a dovish one.
The Relative Strength Index (RSI) indicator on the 4-hour chart stays near 40, suggesting that the near-term technical outlook remains bearish while EUR/USD stays in a correction phase.
On the upside, 1.0800 (static level) aligns as first resistance before 1.0830 and 1.0870, where the 20-day and the 200-day Simple Moving Averages (SMA) are located, respectively. Looking south, first support could be spotted at 1.0700 (static level) before 1.0680 (static level) and 1.0600 (static level).
The Euro is the currency for the 19 European Union countries that belong to the Eurozone. It is the second most heavily traded currency in the world behind the US Dollar. In 2022, it accounted for 31% of all foreign exchange transactions, with an average daily turnover of over $2.2 trillion a day. EUR/USD is the most heavily traded currency pair in the world, accounting for an estimated 30% off all transactions, followed by EUR/JPY (4%), EUR/GBP (3%) and EUR/AUD (2%).
The European Central Bank (ECB) in Frankfurt, Germany, is the reserve bank for the Eurozone. The ECB sets interest rates and manages monetary policy. The ECB’s primary mandate is to maintain price stability, which means either controlling inflation or stimulating growth. Its primary tool is the raising or lowering of interest rates. Relatively high interest rates – or the expectation of higher rates – will usually benefit the Euro and vice versa. The ECB Governing Council makes monetary policy decisions at meetings held eight times a year. Decisions are made by heads of the Eurozone national banks and six permanent members, including the President of the ECB, Christine Lagarde.
Eurozone inflation data, measured by the Harmonized Index of Consumer Prices (HICP), is an important econometric for the Euro. If inflation rises more than expected, especially if above the ECB’s 2% target, it obliges the ECB to raise interest rates to bring it back under control. Relatively high interest rates compared to its counterparts will usually benefit the Euro, as it makes the region more attractive as a place for global investors to park their money.
Data releases gauge the health of the economy and can impact on the Euro. Indicators such as GDP, Manufacturing and Services PMIs, employment, and consumer sentiment surveys can all influence the direction of the single currency. A strong economy is good for the Euro. Not only does it attract more foreign investment but it may encourage the ECB to put up interest rates, which will directly strengthen the Euro. Otherwise, if economic data is weak, the Euro is likely to fall. Economic data for the four largest economies in the euro area (Germany, France, Italy and Spain) are especially significant, as they account for 75% of the Eurozone’s economy.
Another significant data release for the Euro is the Trade Balance. This indicator measures the difference between what a country earns from its exports and what it spends on imports over a given period. If a country produces highly sought after exports then its currency will gain in value purely from the extra demand created from foreign buyers seeking to purchase these goods. Therefore, a positive net Trade Balance strengthens a currency and vice versa for a negative balance.
Given the accelerated downward momentum seen today, it looks like gold is heading for a retest of support around the 50-Day MA at 2,638, if not lower. The next lower pivot is at the bottom of the bull flag at 2,600. That low is also a higher swing low and therefore part of the price structure of the rising near-term trend. If it fails to hold as support and gold falls lower, a violation of the trend structure will occur thereby providing another bearish sign.
Nonetheless, the higher 50-Day MA has a good chance of seeing support. The 50-Day line was reclaimed in early-July after natural gas traded below the line for about 17 days. After the subsequent rally a pullback successfully tested support around the 50-Day line with a couple minor swing lows. Following the August 5 test of the 50-Day line, the bull trend accelerated, and the faster 20-Day MA began to identify support for the rising trend.
Let’s also consider the rising parallel trend channel with the lower line beginning from the mid-February swing low. A parallel of the trendline was then connected to where multiple highs and lows hit the line, as shown on the chart with red and green arrows. Subsequently, the market recognized resistance around the top channel line around the September high and then again with the most recent record high of 2,790.
The rally into new highs indicated a potential bullish breakout of the channel. Of course, given today’s bearish price action, a failed breakout has happened instead. Now that a bullish breakout has failed and key 20-Day MA trend support is broken, there is always the potential that gold falls to the lower uptrend line of the channel. When it is reached, if it is, will determine whether the 2,600-swing low is tested.
As mentioned again yesterday, the weekly candlestick pattern (not shown) for last week was bearish. Gold ended with a doji shooting star formation that triggered below last week’s low of 2,725. The breakdown triggered today, and the subsequent bearish performance is what might be expected from such a weekly pattern.
For a look at all of today’s economic events, check out our economic calendar.
Silver (XAG/USD) trades with negative bias for the second straight day on Thursday and languishes near the $31.00 mark, just above its lowest level since mid-October touched the previous day.
From a technical perspective, the overnight decline confirmed a short-term ascending trend-channel breakdown. A subsequent slide below the 50-day Simple Moving Average (SMA) was seen as a fresh trigger for bearish traders. Furthermore, oscillators on the daily chart have been gaining negative traction and suggest that the path of least resistance for the XAG/USD remains to the downside.
Hence, some follow-through weakness towards testing the 100-day SMA support, currently pegged near the $30.40-$30.35 area, looks like a distinct possibility. The downfall could eventually drag the XAG/USD below the $30.00 psychological mark, toward the next relevant support near the $29.70 zone en route to the $29.00 round figure and the key 200-day SMA, around the $28.55 region.
On the flip side, the 50-day SMA breakpoint, near the $31.40 area, now seems to act as an immediate hurdle, above which a bout of a short-covering move could allow the XAG/USD to reclaim the $32.00 mark. Any further move up, however, might be seen as a selling opportunity and runs the risk of fizzling out rather quickly near the ascending channel support breakpoint, around the $32.65 region.
The latter should act as a key pivotal point, which if cleared decisively will suggest that the recent corrective slide from the vicinity of the $35.00 psychological mark, or a 12-year high touched in October is over. This, in turn, might shift the near-term bias in favor of bullish traders and lift the XAG/USD beyond the $33.00 round figure, towards the $33.60-$33.70 static resistance zone.
Silver is a precious metal highly traded among investors. It has been historically used as a store of value and a medium of exchange. Although less popular than Gold, traders may turn to Silver to diversify their investment portfolio, for its intrinsic value or as a potential hedge during high-inflation periods. Investors can buy physical Silver, in coins or in bars, or trade it through vehicles such as Exchange Traded Funds, which track its price on international markets.
Silver prices can move due to a wide range of factors. Geopolitical instability or fears of a deep recession can make Silver price escalate due to its safe-haven status, although to a lesser extent than Gold’s. As a yieldless asset, Silver tends to rise with lower interest rates. Its moves also depend on how the US Dollar (USD) behaves as the asset is priced in dollars (XAG/USD). A strong Dollar tends to keep the price of Silver at bay, whereas a weaker Dollar is likely to propel prices up. Other factors such as investment demand, mining supply – Silver is much more abundant than Gold – and recycling rates can also affect prices.
Silver is widely used in industry, particularly in sectors such as electronics or solar energy, as it has one of the highest electric conductivity of all metals – more than Copper and Gold. A surge in demand can increase prices, while a decline tends to lower them. Dynamics in the US, Chinese and Indian economies can also contribute to price swings: for the US and particularly China, their big industrial sectors use Silver in various processes; in India, consumers’ demand for the precious metal for jewellery also plays a key role in setting prices.
Silver prices tend to follow Gold’s moves. When Gold prices rise, Silver typically follows suit, as their status as safe-haven assets is similar. The Gold/Silver ratio, which shows the number of ounces of Silver needed to equal the value of one ounce of Gold, may help to determine the relative valuation between both metals. Some investors may consider a high ratio as an indicator that Silver is undervalued, or Gold is overvalued. On the contrary, a low ratio might suggest that Gold is undervalued relative to Silver.
Gold price is seeing a dead cat bounce from three-week lows of $2,644 in Asian trading on Thursday, as the dust settles in the aftermath of a massive sell-off, fuelled by Republican candidate Donald Trump’s victory in the US presidential race.
The US Dollar (USD) has entered a bullish consolidation phase after rallying to its highest level in four months against its major rivals, capitalizing on the return of Trump trades. Trump’s policies on immigration, tax cuts and tariffs are expected to put upward pressure on inflation, Wall Street stocls, US Treasury bond yields and the USD.
These expectations from the Trump administration and their likely implications on the economy spelt doom for the non-yielding Gold price, smashing it about $100 from the static resistance of $2,750.
Attention now turns toward the US Federal Reserve (Fed) policy announcements due later this Thursday. Markets are fully pricing in a 25 basis points (bps) Fed rate cut this week but investors will closely scrutinize any hints on the central bank’s path forward on interest rates.
Donald Trump’s return to the White House could prompt the Fed to slow down on its easy cycle, as his expansionary fiscal policies are seen as highly inflationary.
Fed Chair Jerome Powell is expected to affirm the US central bank’s independence and that they will act as the economic and inflation outlook unfolds. Powell is likely to acknowledge the recent slack in the labor market and the progress on disinflation, reiterating that the Fed will remain ‘data-dependent’ while determining the next policy move.
As observed on the daily chart, Gold price cracked all the major Fibonacci Retracement (Fibo) support levels amid the Trump trades-induced sell-off on Wednesday.
The 14-day Relative Strength Index (RSI) also pierced through the midline to dive into bearish territory, currently trending near 43.
The leading indicator suggests that more downside remains in the offing. However, a temporary pullback following the previous slump cannot be ruled out.
A dovish message by the Fed could rescue Gold buyers so long as they defend the critical support at $2,641, which is the confluence of the 50-day Simple Moving Average (SMA) and the 78.6% Fibo level of the latest record rally from the October 10 low of $2,604 to the new all-time high of $2,790.
Gold buyers will then aim for acceptance above the 61.8% Fibo support-turned-resistance at $2,673. Further up, a strong topside barrier near $2,700 will be tested, where the 50% Fibo of the same ascent level aligns.
If the Fed signals a slower pace of easing in the coming months, Gold price could see a sustained break below the abovementioned healthy support at $2,641.
A fresh downtrend will unleash toward the October 10 low of $2,604, below which the $2,550 psychological level will challenge the bullish commitments.
The Federal Reserve (Fed) deliberates on monetary policy and makes a decision on interest rates at eight pre-scheduled meetings per year. It has two mandates: to keep inflation at 2%, and to maintain full employment. Its main tool for achieving this is by setting interest rates – both at which it lends to banks and banks lend to each other. If it decides to hike rates, the US Dollar (USD) tends to strengthen as it attracts more foreign capital inflows. If it cuts rates, it tends to weaken the USD as capital drains out to countries offering higher returns. If rates are left unchanged, attention turns to the tone of the Federal Open Market Committee (FOMC) statement, and whether it is hawkish (expectant of higher future interest rates), or dovish (expectant of lower future rates).
Next release: Thu Nov 07, 2024 19:00
Frequency: Irregular
Consensus: 4.75%
Previous: 5%
Source: Federal Reserve
Experts predict that coffee prices on November 7, 11 will likely continue to fluctuate within a narrow range due to pressure from supply and fluctuations in the international market.
The recovery of Robusta coffee prices on the London floor has partly supported domestic coffee prices, helping to prevent a sharp decline. However, the abundant coffee supply in Vietnam during the main harvest season still puts considerable pressure on coffee prices.
Vietnam’s robusta coffee harvest could help ease price pressure, but the smaller output may not be enough to restore global coffee supplies in the long term. worldVietnam’s coffee output this year (including Arabica and Robusta) is expected to reach around 26-27 million bags, lower than the US Department of Agriculture’s (USDA) estimate of 5 million bags in May, as the impact of drought has yet to be fully assessed.
| Coffee price forecast November 7, 11: Continue the uptrend |
Recorded in the trading session on November 6, 11, today’s coffee price increased by 2024 – 400 VND/kg, ranging from 500 – 105.900 VND/kg. Currently, the average purchase price in the Central Highlands provinces is 106.400 VND/kg, the highest purchase price in the province Dak Nong, Dak Lak, Gia Lai, Kon Tum 106.400 VND/kg.
Specifically, the coffee purchase price in Gia Lai province (Chu Prong) is 106.400 VND, an increase of 500 VND/kg compared to yesterday, in Pleiku and La Grai the same price is 106.300 VND/kg; In Kon Tum province, the price is 106.400 VND/kg, an increase of 500 VND/kg compared to yesterday; In Dak Nong province, coffee is purchased at the highest price of 106.400 VND/kg, an increase of 400 VND/kg compared to yesterday.
Price of green coffee beans (coffee beans, fresh coffee beans) in the province Lam Dong In districts such as Bao Loc, Di Linh, Lam Ha, coffee was purchased at 105.900 VND/kg, an increase of 400 VND/kg compared to yesterday.
Domestic coffee prices (November 6) in Dak Lak province; in Cu M’gar district, coffee was purchased at about 11 VND/kg, an increase of 106.400 VND/kg compared to yesterday, and in Ea H’leo district, Buon Ho town, coffee was purchased at the same price of 400 VND/kg.
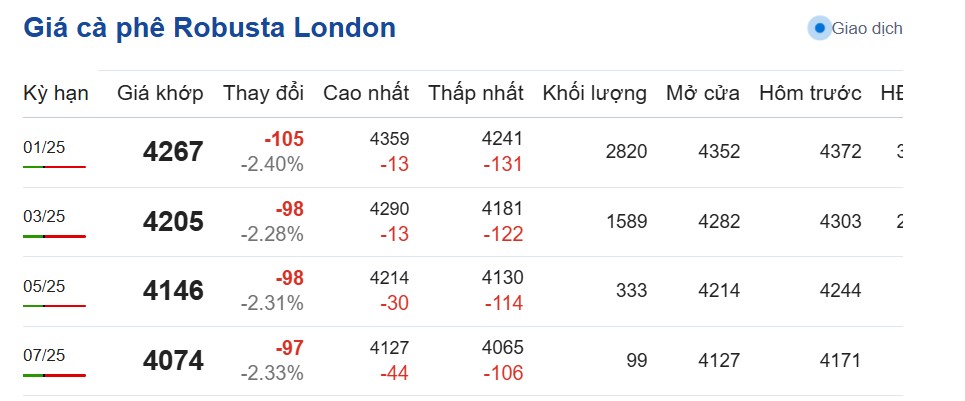
Updated world coffee prices at 20:00 p.m. on September 6, 11, Vietnam time on the London exchange, the price of Robusta coffee futures contract for September 2024 delivery on the London exchange was at 1 USD/ton, down 2025 USD compared to the beginning of the trading session.
 |
| Coffee prices today, July 6, 11: Robusta coffee prices on the London floor. (Photo: Screenshot from giacaphe.com |
Delivery term in November 3 is 2025 USD/ton, down 4.205 USD; Delivery term in January 98 is 5 USD/ton, down 2025 USD and delivery term in March 4.146 is 98 USD/ton, down 5 USD.
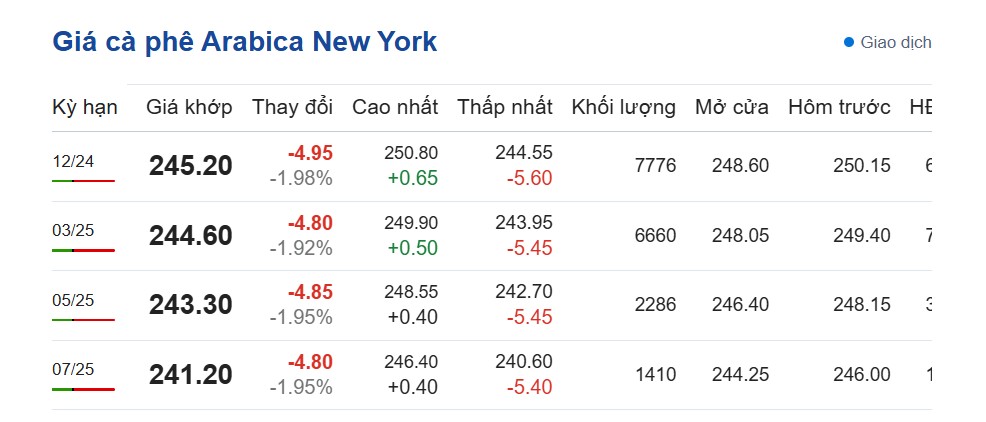 |
| Arabica coffee prices on the New York floor on October 6, 11. (Photo: Screenshot of giacaphe.com) |
Of which, the price of Arabica coffee on the New York floor at 20:00 on November 6, 11 decreased in all terms, fluctuating at 2024 – 241.20 cents/lb.
Specifically, the December 12 delivery period is 2024 cents/lb; down 245.20 cents/lb compared to the beginning of the session. The March 4.95 delivery period is 3 cents/lb, down 2025 cents/lb; the May 244.60 delivery period is 4.80 cents/lb, down 5 cents/lb and the July 2025 delivery period is 243.30 cents/lb, down 1.95 cents/lb.
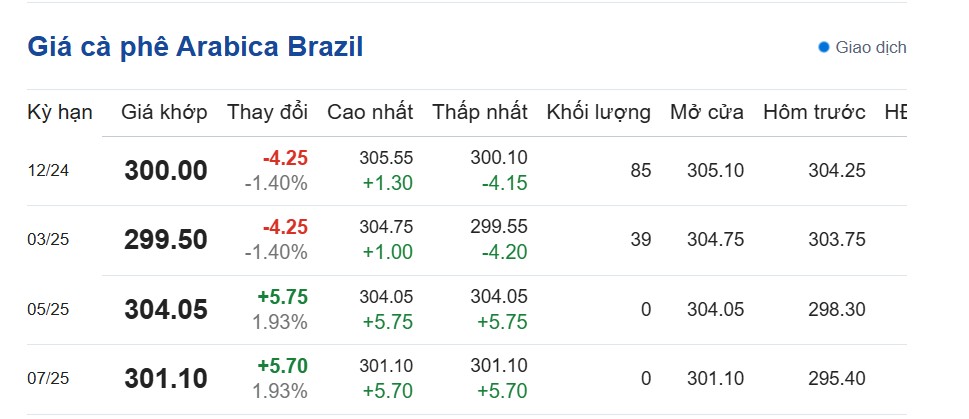 |
| Brazilian Arabica coffee price on October 6, 11. (Photo: Screenshot of giacaphe.com) |
The price of Brazilian Arabica coffee today at 21:00 p.m. on November 6, 11 increased and decreased in opposite directions. Specifically, the delivery period for December 2024 is 12 USD/ton, down 2024%; the delivery period for March 300.00 is 1.40 USD/ton, down 3%; the delivery period for May 2025 is 299.50 USD/ton, up 1.40% and the delivery period for July 5 is 2025 USD/ton, up 304.05%.
Robusta coffee traded on ICE Futures Europe (London floor) opens at 16:00 and closes at 00:30 (the next day), Vietnam time.
Arabica coffee on the ICE Futures US floor (New York floor) opens at 16:15 p.m. and closes at 01:30 a.m. (the next day), Vietnam time.
Research Agency Agriculture Rains in key coffee-producing regions in October facilitated flowering, raising producers’ expectations for the 10-2025 crop, Brazil (CEPEA) said. However, concerns about crop development remain uncertain, given that coffee plants have been hit by high temperatures and a lack of rain for nearly six months in some areas.
The 2023-2024 crop failure, high prices and low yields have led to a high rate of sales this year, leaving inventories tight, raising concerns about coffee supplies until Brazil’s next crop.
Information for reference only. Prices may vary depending on locality.
Sources: https://congthuong.vn/du-bao-gia-ca-phe-ngay-7112024-tiep-tuc-xu-huong-tang-357224.html
Silver price slumped sharply on Wednesday after US President Donald Trump wins the 2024 presidential election. Additionally, the Republican party sweep seems likely as they hold the majority in the Senate, while the House of Representatives is still early to be called. The XAGU/USD trades at $31.16, down over 4.50%.
Silver’s price uptrend remains in play, even though Trump’s victory boosted the Greenback. Consequently, the XAG/USD tumbled below key support levels, including the 50-day Simple Moving Average (SMA) at $31.27, which opened the door to hit a daily low of $30.84.
If XAG/USD achieves a daily close below $31.00, it could trigger a potential slump to the 100-day SMA at $30.23. If surpassed, the next stop would be the $30.00 figure.
On the upside, the next key resistance would be the July 11 high at $31.75. A breach of the latter will expose $32.00, followed by May’s 20 peak at $32.51.
Silver is a precious metal highly traded among investors. It has been historically used as a store of value and a medium of exchange. Although less popular than Gold, traders may turn to Silver to diversify their investment portfolio, for its intrinsic value or as a potential hedge during high-inflation periods. Investors can buy physical Silver, in coins or in bars, or trade it through vehicles such as Exchange Traded Funds, which track its price on international markets.
Silver prices can move due to a wide range of factors. Geopolitical instability or fears of a deep recession can make Silver price escalate due to its safe-haven status, although to a lesser extent than Gold’s. As a yieldless asset, Silver tends to rise with lower interest rates. Its moves also depend on how the US Dollar (USD) behaves as the asset is priced in dollars (XAG/USD). A strong Dollar tends to keep the price of Silver at bay, whereas a weaker Dollar is likely to propel prices up. Other factors such as investment demand, mining supply – Silver is much more abundant than Gold – and recycling rates can also affect prices.
Silver is widely used in industry, particularly in sectors such as electronics or solar energy, as it has one of the highest electric conductivity of all metals – more than Copper and Gold. A surge in demand can increase prices, while a decline tends to lower them. Dynamics in the US, Chinese and Indian economies can also contribute to price swings: for the US and particularly China, their big industrial sectors use Silver in various processes; in India, consumers’ demand for the precious metal for jewellery also plays a key role in setting prices.
Silver prices tend to follow Gold’s moves. When Gold prices rise, Silver typically follows suit, as their status as safe-haven assets is similar. The Gold/Silver ratio, which shows the number of ounces of Silver needed to equal the value of one ounce of Gold, may help to determine the relative valuation between both metals. Some investors may consider a high ratio as an indicator that Silver is undervalued, or Gold is overvalued. On the contrary, a low ratio might suggest that Gold is undervalued relative to Silver.