The main category of Forex News.
You can use the search box below to find what you need.
[wd_asp id=1]
The main category of Forex News.
You can use the search box below to find what you need.
[wd_asp id=1]
A decisive decline below today’s low will trigger a continuation of the bearish retracement. Subsequently, there are two primary potential support zones to watch. The first is from 2.58 to 2.54, and the second starts at the 61.8% Fibonacci retracement level at 2.48 and goes down to the orange 50-Day MA at 2.46. The first price zone starts with a prior interim swing high, includes the 50% retracement at 2.56, and completes with the purple 20-Day MA.
A recent test of support at the 50-Day line failed, and the price of natural gas fell below the line before rebounding back above it. Therefore, the current decline has the potential to successfully test support around the 50-Day MA and lead to a bullish reversal. One reason for this is indicated on the weekly chart (not shown), as a bullish reversal triggered this week.
Although the moving averages help provide some guide to price action, natural gas continues to trade inside consolidation that takes the form of a large symmetrical triangle pattern. Therefore, indications from the moving averages are generally not as reliable or significant as seen in a trending environment. Nonetheless, keeping that in mind they can still provide useful information as they have done recently with support at the 200-Day MA and the 50-Day crossing above the 200-Day.
Behavior around the internal uptrend line that connects the most recent swing low may also provide some insight. If it fails to hold as support, the 200-Day MA becomes a target, which is now at 2.23. Subsequently, if the 200-Day MA fails, the trendline becomes a target. If the trendline is broken to the downside, the potential bullish outlook diminishes.
For a look at all of today’s economic events, check out our economic calendar.
Forecasts from both American and European models show warmer temperatures are likely to persist across the U.S., limiting heating degree days (HDDs) and reducing natural gas demand. NatGasWeather reported that the American model adjusted its forecast by 11 HDDs lower, which decreases the immediate need for heating-related gas. This shift points to mild conditions across much of the country, particularly in the eastern and southern regions, where temperatures are expected to hover between the 60s and 80s Fahrenheit, with isolated areas even reaching the 90s.
In contrast, cooler temperatures in parts of the western and central U.S. will bring highs in the 40s to 60s Fahrenheit, though this will not significantly offset the mild conditions prevailing elsewhere. The overall demand profile remains light, as warmer weather patterns weaken market sentiment for natural gas futures in the near term.
Natural gas storage remains robust, further pressuring prices. As of October 25, 2024, the U.S. Energy Information Administration (EIA) reported working gas in storage at 3,863 billion cubic feet (Bcf), an increase of 78 Bcf from the previous week. These levels are 107 Bcf higher than the same time last year and 178 Bcf above the five-year average. This storage surplus suggests that natural gas supplies are more than adequate to meet current and expected demand, which is particularly light due to the mild weather outlook.
Amid steady production levels, especially with wind energy contributing to electricity generation, natural gas demand for power remains subdued. This excess in supply, combined with steady injections into storage, limits the potential for a bullish reversal in the short term.
Experts predict that the price of coffee on October 30, 2024 in the domestic market will rebound due to the influence of weather and the influence of the international market.
World coffee prices increased due to concerns that the circulation after the storm could cause heavy rain in the key coffee growing region of the Central Highlands of Vietnam, slowing down the progress of the new crop harvest. Storm Tra Mi (storm No. 6) made landfall, causing heavy rain from Ha Tinh to Binh Dinh and the northern Central Highlands of Vietnam, slowing the supply of the current harvest to the market, as the storm dissipated quickly but brought rain with the tropical depression afterwards. Meanwhile, another storm is forming from the East of the Philippines, named Kong-rey. The storm is moving southward as it gets closer to the end of the year.
 |
| October 30, 2024 Coffee Price Forecast: Tends to increase strongly again due to weather concerns |
Coffee prices also rose on news after Brazil’s Somar Meteorologia reported that Brazil’s largest arabica coffee growing region, Minas Gerais, received just 25,1 mm of rain last week, or 74% of the historical average.
Assessing the coffee market in the coming time, experts said that there were too many difficulties right from the beginning of the new crop year, perhaps these difficulties will last until early 2025, when international traders sell all the goods they had hastily purchased before.
At that time, coffee prices will be more stable, but the opportunity to increase prices to reach the previous peak is considered gone. In the current coffee market conditions, we need to do business based on quality, not quantity.
Recorded in the trading session on October 29, 2024, domestic coffee prices today decreased slightly by 800-900 VND/kg, ranging from 108.500-109.100 VND/kg. Currently, the average purchase price in the Central Highlands provinces is 108.700 VND/kg, the highest purchase price in Dak Nong province is 109.100 VND/kg.
Specifically, the coffee purchase price in Gia Lai province (Chu Prong) is 109.000 VND, down 800 VND/kg compared to yesterday, in Pleiku and La Grai the same price is 108.900 VND/kg; In Kon Tum province, the price is 109.000 VND/kg, down 800 VND/kg compared to yesterday; In Dak Nong province, coffee is purchased at the highest price of 109.100 VND/kg, down 900 VND/kg compared to yesterday.
The price of green coffee beans (coffee beans, fresh coffee beans) in Lam Dong province in districts such as Bao Loc, Di Linh, Lam Ha, coffee is purchased at 108.500 VND/kg, a decrease of 900 VND/kg compared to yesterday.
Coffee price today (date 29/10) in Dak Lak province; in Cu M’gar district, coffee is purchased at around 109.000 VND/kg, down 800 VND/kg, while in Ea H’leo district and Buon Ho town, coffee is purchased at the same price 108.900 VND/kg.
Updated world coffee prices at 20:00 on October 29, 2024 Vietnam time on the London exchange, the price of Robusta coffee futures contract for monthly delivery November 2024 on the London exchange was at 4.457 USD/ton, down 45 USD compared to the beginning of the trading session.
 |
| Coffee price today October 29, 2024: Robusta coffee price on London floor. (Photo: Screenshot giacaphe.com |
The monthly delivery term January 2025 is 4.367 USD/ton, down 43 USD; the monthly delivery term March 2025 is 4.296 USD/ton, down 41 USD and the monthly delivery term May 2025 is 4.206 USD/ton, down 51 USD.
 |
| Arabica coffee price on New York floor on October 29, 2024. (Photo: Screenshot of giacaphe.com) |
In particular, the price of Arabica coffee on the New York floor today at 20:00 on October 29, 2024 decreased in all terms, fluctuating at 246.05 – 251.00 cents/lb.
Specifically, the monthly delivery term December 2024 is 251.00 cents/lb; down 1.35 cents/lb compared to the beginning of the session. The monthly delivery term March 2025 is 250.05 cents/lb, down 1.30 cents/lb; the monthly delivery term May 2025 is 248.70 cents/lb, down 1.20 cents/lb and the monthly delivery term July 2025 is 246.05 cents/lb, down 0.47 cents/lb.
 |
| Brazilian Arabica coffee price on October 29, 2024.(Photo: Screenshot from giacaphe.com) |
Brazilian Arabica coffee prices today at 21:00 p.m. October 29, 2024 increased and decreased in opposite directions. Specifically, the monthly delivery term December 2024 was 303.00 USD/ton, down 0.49%; the monthly delivery term March 2025 was 303.00 USD/ton, down 0.61%; the monthly delivery term May 2025 was 306.35 USD/ton, up 1.64% and the monthly delivery term July 2025 was 302.70 USD/ton, up 1.59%.
Robusta coffee traded on ICE Futures Europe (London floor) opens at 16:00 and closes at 00:30 (the next day), Vietnam time.
Arabica coffee on the ICE Futures US floor (New York floor) opens at 16:15 p.m. and closes at 01:30 a.m. (the next day), Vietnam time.
According to data from the General Department of Customs, Vietnam’s coffee exports in the first half of the month October 2024 reached 21,5 thousand tons, worth 125,8 million USD, up 0,4% in volume and 7,5% in value compared to the first half of September; and compared to the first half of the month October 2023 increased by 9% in volume and 20,5% in value. Accumulated from the beginning of the year to October 15, 2024, Vietnam’s coffee exports reached approximately 98,0 million tons, worth 1,13 billion USD, down 4,44% in volume, but up 11,1% in value compared to the same period in 39,1.
Currently, businesses in the Vietnamese coffee supply chain are facing many challenges. Rising prices stimulate farmers to pursue short-term benefits. Increasing supply shortages due to depleting domestic inventories.
Information for reference only. Prices may vary depending on locality.
A Reuters poll released Thursday paints a lackluster future for oil in 2025, with a cocktail of sluggish demand growth and supply glut concerns pulling prices down. Analysts now see Brent crude averaging $80.55 per barrel this year and $76.61 in 2025— a steady downgrade from earlier projections.
The pessimistic shift stems from a trio of factors. China’s lukewarm demand, despite its role as the world’s top oil consumer, casts a long shadow. Meanwhile, oil supplies from key producers are poised to swell, especially with OPEC+ eyeing an output hike in December. And the geopolitical storms that once rattled markets, particularly fears of escalations in the Middle East, have calmed. As Ole Hansen, Saxo Bank’s head of commodity strategy, noted, these flare-ups may stir oil prices, but the risk of real disruption is, well, limited.
U.S. crude also follows suit, with prices expected to hover at $76.73 a barrel this year and down to $72.73 in 2025. This downtrend marks the sixth straight month of reduced expectations for the year’s average prices.
Brent’s current crude price is $73.25, with WTI at $69.55 per barrel—up about 1% on the day, but down based on month-ago levels.
For 2025, the poll hints at a slight bump in global oil demand by roughly 1-1.5 million barrels per day, though it’s not exactly the cavalry. 2024 global demand is expected to be between 0.8 million and 1.2 million bpd, the poll showed.
Seasonal factors may prompt OPEC+ to delay their planned December increase until spring 2025, as Stratas Advisors’ president John Paisie told Reuters, saying “We think that OPEC+ could delay the increase in supply until end of March/beginning of April of 2025, given that demand will drop in Q1 2025 from Q4 2024 because of seasonal factors.”
When the geopolitical winds ease and China’s economy stalls, crude prices might just hit the snooze button for a while.
By Julianne Geiger for Oilprice.com
Gold’s recent price reversal could trigger a short-term correction, with a break below $2,731.63 likely confirming this bearish chart pattern. If the reversal plays out, we expect gold to test the $2,708.76–$2,697.28 support zone over the next few sessions. A decisive break below this range could accelerate selling toward the 50-day moving average of $2,624.71. Conversely, if prices push above the recent high of $2,790.17, this would negate the reversal, resuming the broader uptrend and supporting gold’s bullish momentum.
After profit-taking hit the market on Thursday, pushing gold 1.5% lower, prices rebounded as investors awaited economic insights from the U.S. jobs data. Despite the recent pullback, gold remains up 4% in October as uncertainty ahead of the Nov. 5 U.S. presidential election sustains demand for safe-haven assets.
Traders have kept a close watch on political and economic indicators, with the gold market responsive to any shifts in polling between Donald Trump and Kamala Harris, as the race tightens. Additionally, Citi projects gold may reach $3,000 per ounce within six months, citing labor market concerns and sustained ETF inflows as key drivers.
The U.S. dollar held steady on Friday, supported by a series of economic data suggesting robust underlying economic conditions despite anticipated Fed rate cuts.
The October NFP report is expected to show an increase of roughly 100,000 jobs, a slowdown from September’s 254,000 figure. Analysts, however, caution that external factors, such as recent hurricanes, could weigh on the numbers.
Treasury yields were flat, with markets largely pricing in a 25-basis-point rate cut at the Fed’s November meeting. Dollar strength remains a central theme, supported by reduced expectations for aggressive rate cuts.
Image © Adobe Images
The Dollar should weaken if Kamala Harris wins next week’s U.S. election, but a balance of probabilities favours strength.
According to a new analysis from Crédit Agricole, the U.S. Dollar will retest 2024 highs in the event of a Donald Trump win next week but fall if Kamala Harris wins.
“A soft landing in the U.S. in 2025 could further suggest that the USD rate appeal could persist in the months after the elections. We subsequently see the USD moving closer to its 2024 highs in the wake of a Trump victory while suffering only limited losses following a Harris win,” says Valentin Marinov, Head of G10 FX Strategy at Crédit Agricole.
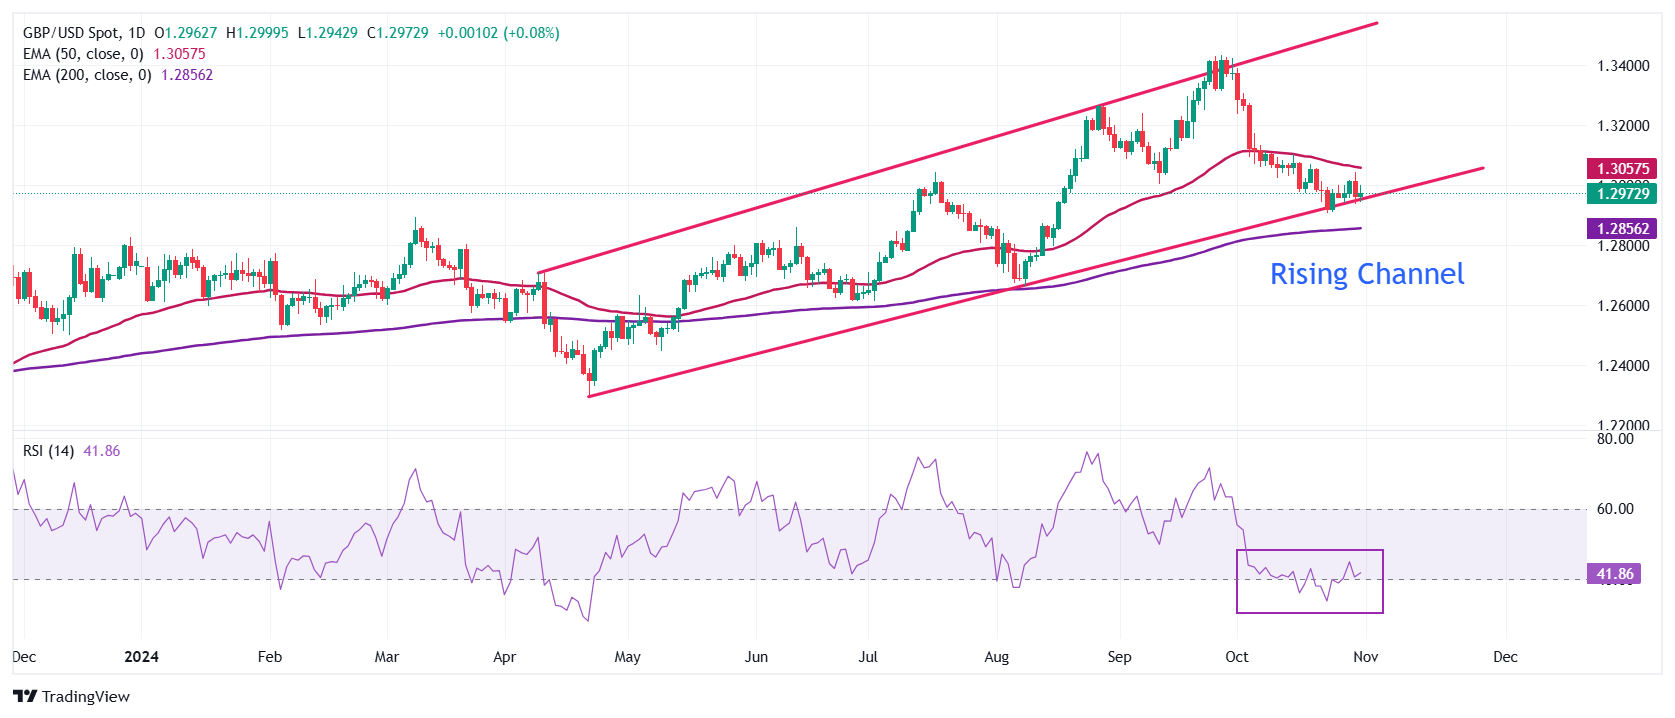
Losses for the Dollar in the event of a Harris win would nevertheless put the GBP/USD comfortably back above the 1.30 marker, provided Sterling stabilises following its post-budget wobble.

“EUR/USD and GBP/USD could slump to their Q124 lows or head lower still in response to a Trump victory accompanied by a ‘red wave’ in the US Congress. In contrast, their upside could be limited to 1.10 and 1.33 in the event of a Harris victory and a divided US Congress,” says Marinov.
Analysts at Barclays say a Harris win would see the USD erase the Trump premium, which they think amounts to a 2% drop (i.e. 2% recovery in GBP/USD and EUR/USD).
The market is currently expecting a Trump win, with odds set at about 60%.
GBP/USD investment bank consensus forecasts: The end-2024 and 2025 guide from Corpay has been released. It shows a sizeable uplift was made to the consensus forecasts for GBP/USD. Please request a copy here.
Rising odds of a Trump victory are reflected in a strengthening U.S. Dollar through the course of October, which pushed the Pound to Dollar exchange rate to an October 31 low at 1.2843.
Also of significance to the market outlook is the outcome of votes for the Senate and House of Representatives. Should the Republicans win both houses, their control of Congress significantly boosts a Trump agenda.
A “red wave” outcome is increasingly likely, according to betting markets, where the odds of this outcome now sit at 44%.
“We see the most bullish dollar outcome as a red sweep and the most bearish dollar outcome as a blue sweep, but the magnitude of the moves is likely larger in the former,” says George Saravelos, an analyst at Deutsche Bank.
“We see the dollar rising across all currency pairs in a red sweep,” he says.
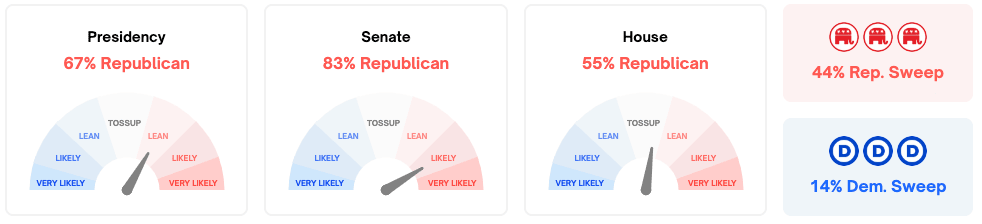
Analysts say Trump’s policy agenda is more radical than that of his Democrat rival Kamala Harris, putting a number of USD-positive policies and scenarios in play.
“We suspect Trump’s proposed curbs on immigration and new tariffs would be stagflationary,” says Paul Ashworth, Chief North America Economist at Capital Economics.
Trump intends to impose significant import tariffs, which would raise domestic inflation and prevent the Federal Reserve from cutting as far and as fast as previously assumed.
“The proposed 10–20% increase in tariffs across the board has the potential to be inflationary,” says Tom Kenny, Senior International Economist at ANZ Bank.
EUR/USD closed the fourth consecutive day in positive territory on Thursday before going into a consolidation phase below 1.0900 on Friday. In the early American session, October employment data from the US will be watched closely by market participants.
The table below shows the percentage change of Euro (EUR) against listed major currencies this week. Euro was the strongest against the Australian Dollar.
| USD | EUR | GBP | JPY | CAD | AUD | NZD | CHF | |
|---|---|---|---|---|---|---|---|---|
| USD | -0.70% | 0.52% | -0.50% | 0.35% | 0.74% | 0.31% | -0.43% | |
| EUR | 0.70% | 1.34% | 0.13% | 1.05% | 1.53% | 1.00% | 0.29% | |
| GBP | -0.52% | -1.34% | -0.37% | -0.16% | 0.25% | -0.25% | -0.78% | |
| JPY | 0.50% | -0.13% | 0.37% | 0.91% | 0.60% | 0.05% | -0.41% | |
| CAD | -0.35% | -1.05% | 0.16% | -0.91% | 0.34% | -0.12% | -0.74% | |
| AUD | -0.74% | -1.53% | -0.25% | -0.60% | -0.34% | -0.55% | -1.21% | |
| NZD | -0.31% | -1.00% | 0.25% | -0.05% | 0.12% | 0.55% | -0.73% | |
| CHF | 0.43% | -0.29% | 0.78% | 0.41% | 0.74% | 1.21% | 0.73% |
The heat map shows percentage changes of major currencies against each other. The base currency is picked from the left column, while the quote currency is picked from the top row. For example, if you pick the Euro from the left column and move along the horizontal line to the US Dollar, the percentage change displayed in the box will represent EUR (base)/USD (quote).
EUR/USD benefited from the selling pressure surrounding the US Dollar (USD) following mixed macroeconomic data releases on Thursday and extended its weekly uptrend. The Initial Jobless Claims declined by 12,000 to 216,000 for the week ending October 26, while the Employment Cost Index rose by 0.8% in the third quarter, falling short of the market expectation for an increase of 0.9%.
Nonfarm Payrolls (NFP) in the US are forecast to rise by 113,000 in October following the 254,000 increase recorded in September. A reading below 100,000 could trigger another leg of USD selloff and allow EUR/USD to push higher. On the flip side, a positive surprise, with an NFP print of 150,000 or higher, could support the USD and make it difficult for the pair to keep its footing heading into the weekend.
Investors could look to adjust positions ahead of the US presidential election and Federal Reserve policy meeting next week and trigger irregular movements in financial markets. Hence, it could be risky to bet on a directional move depending on the outcome of the US labor market data.
EUR/USD was last seen trading within a few pips of the pivot level at 1.0870, where the 200-day and the 20-day Simple Moving Averages (SMA) meet. Once the pair confirms this level as support, technical buyers could remain interested. In this scenario, 1.0900 (round level, static level) could be seen as interim resistance before 1.0940 (100-day SMA) and 1.1000 (round level, 50-day SMA).
If EUR/USD fails to clear 1.0870, it could come under renewed bearish pressure and retreat toward 1.0800 (round level) and 1.0750 (static level).
Nonfarm Payrolls (NFP) are part of the US Bureau of Labor Statistics monthly jobs report. The Nonfarm Payrolls component specifically measures the change in the number of people employed in the US during the previous month, excluding the farming industry.
The Nonfarm Payrolls figure can influence the decisions of the Federal Reserve by providing a measure of how successfully the Fed is meeting its mandate of fostering full employment and 2% inflation. A relatively high NFP figure means more people are in employment, earning more money and therefore probably spending more. A relatively low Nonfarm Payrolls’ result, on the either hand, could mean people are struggling to find work. The Fed will typically raise interest rates to combat high inflation triggered by low unemployment, and lower them to stimulate a stagnant labor market.
Nonfarm Payrolls generally have a positive correlation with the US Dollar. This means when payrolls’ figures come out higher-than-expected the USD tends to rally and vice versa when they are lower. NFPs influence the US Dollar by virtue of their impact on inflation, monetary policy expectations and interest rates. A higher NFP usually means the Federal Reserve will be more tight in its monetary policy, supporting the USD.
Nonfarm Payrolls are generally negatively-correlated with the price of Gold. This means a higher-than-expected payrolls’ figure will have a depressing effect on the Gold price and vice versa. Higher NFP generally has a positive effect on the value of the USD, and like most major commodities Gold is priced in US Dollars. If the USD gains in value, therefore, it requires less Dollars to buy an ounce of Gold. Also, higher interest rates (typically helped higher NFPs) also lessen the attractiveness of Gold as an investment compared to staying in cash, where the money will at least earn interest.
Nonfarm Payrolls is only one component within a bigger jobs report and it can be overshadowed by the other components. At times, when NFP come out higher-than-forecast, but the Average Weekly Earnings is lower than expected, the market has ignored the potentially inflationary effect of the headline result and interpreted the fall in earnings as deflationary. The Participation Rate and the Average Weekly Hours components can also influence the market reaction, but only in seldom events like the “Great Resignation” or the Global Financial Crisis.
The next lower target is the 38.2% Fibonacci retracement at 2.65. A decline below today’s low will signal a likely move to that price level. Nonetheless, a lower and what looks like a potentially more significant target zone is from 2.58 to 2.55. That range consists of a previous interim swing high and the 20-Day MA, respectively. Also, within that range is the 50% retracement level at 2.57. If that price zone is broken to the downside, then watch for support around the 61.8% Fibonacci retracement at 2.48, along with the 50-Day MA at 2.45.
Recently, natural gas successfully tested the 200-Day MA as support. The 200-Day line was recaptured on September 11. Other than a quick test of support a week after the initial breakout, there has been no subsequent test of the 200-Day line as support. It can be considered as a maximum support level before the potential of natural gas in the foreseeable future starts to change. Staying above the 200-Day line during weakness would indicate strength overall given its long-term nature.
Moreover, notice how bullish momentum has been improving overall in recent months as represented by the higher swing lows and accompanying trendlines. If the higher internal trendline that connects the recent swing low fails as support, the potential for an eventual bullish breakout of the triangle diminishes or it may take longer to occur. The top triangle trendline is significant as it connects five swing highs. This means it may continue to offer strong resistance, or a bull breakout triggers with momentum spiking – a possibility.
For a look at all of today’s economic events, check out our economic calendar.
Next up, there is a potentially significant resistance zone a little higher, starting from 71.83 and rising to 73.21. The higher level is the 50% retracement, which should be watched in concert with the most recent interim swing high at 73.15. The price range starts with the 38.2% Fibonacci retracement level. Also, included with the range is potential resistance around the 50-Day MA at 71.96, and the 20-Day MA at 72.27.
Nonetheless, the 73.15 swing high is the key pivot as a breakout above starts to reverse the price structure of the short-term downtrend. A bull breakout above 73.15 would provide a renewed sign of strength once there is a daily close above it. Further, the moving average trend indicators would have been exceeded by then.
The large symmetrical triangle pattern in crude oil has been discussed before. A bearish breakdown triggered at the beginning of September, and it was followed by a bullish reversal that rose back into the pattern. Subsequently, another breakdown from the pattern triggered. Given that crude continues to chop around it is possible that the consolidation pattern has evolved into a larger triangle.
That may account for the lack of follow-through. Nevertheless, it is not clear yet. The initial lower boundary line of the triangle, that is now around the 61.8% Fibonacci retracement level at 74.60, may continue to provide insights if it is approached again. The question is, will it lead to a bearish reversal or a bullish breakout?
For a look at all of today’s economic events, check out our economic calendar.